N
N
Covered by US Pat. 6512975
WARNING
The enclosed technical data is eligible for export under License Designation NLR and is to be used solely by the individual/organization to whom it is addressed. Diversion contrary to U.S. law is prohibited.
COPYRIGHT NOTICE
Copyright ??
Reproduction of this publication or any portion thereof by any means without the express written permission of Honeywell International Inc. is prohibited. For fur- ther information contact Technical Publications; Honeywell; One Technology Center; 23500 West 105th Street; Olathe, Kansas 66061. Telephone: (913) 712- 0400.
KMD 250
and
KMD 250
Software Version 02/01 or later

Revision History and Instructions
Summary
S/W 02/01: Added XM functionality to the KMD 250

Revision History and Instructions
Summary
S/W 01/08: Added Airport Type on Airport Info Screen on page
Changed Awareness to Avoidance on page
Changed 100L to 100LL on page
Added Definition for Heading on TIS screen on page

Revision History and Instructions
Summary
Added:
Internal GPS
Flight planning capability
Nearest function
User Waypoints
Quick Tuning capability
Airspace Alerting
Airspace depiction
Waypoint Alerting
Turn Anticipation

Revision History and Instructions
Summary
Change in text on Startup Caution Page.

Revision History and Instructions
Summary
This is the original release of this publication.

Intentionally left blank

Table of Contents
SECTION 1
BASIC KMD 250 OPERATION
GENERAL
MENU
FUNCTION STATUS
STARTUP
COURSE DEVIATION INDICATOR
GREAT CIRCLE COURSES AND MAGNETIC
MAP
SELECTING A MAP
VFR
IFR
Relative Terrain
Baro
OBSTACLE
Table of Contents
USING THE
Map Data
Airport
Navaid
Airspace
Airspace
Temporarily Decluttering the
Find Nearest (Units With Internal
Waypoint
Turn
USER
ENTERING A USER
ENTERING A USER
FLIGHT PLAN
VIEWING FLIGHT PLAN
Fuel
Changing the Data
CREATING A FLIGHT
ACTIVATING A STORED FLIGHT
Inserting a Waypoint in the Flight

Table of Contents

Table of Contents
SECTION 2
FIS VDL OR XM OPERATION
EQUIPMENT
BASIC WEATHER
CONVECTIVE
VALUE ADDED SERVICE WEATHER
NEXRAD
NEXRAD
GRAPHICAL
GRAPHICAL
GRAPHICAL
GRAPHICAL CONVECTIVE
GRAPHICAL ALERT WEATHER WATCHES (VDL
VDL
Setting Up a VDL
Checking FIS VDL

Table of Contents
XM WX
Setting Up An XM WX
Checking XM WX
NORMAL
NEXRAD Page Operational
Using the NEXRAD
GRAPHICAL METARS
Graphical METARs Page Operational
Using the Graphical METARs
GRAPHICAL AIRMETS
Graphical AIRMETs Page Operational
Using the Graphical AIRMETs
GRAPHICAL SIGMETS
Graphical SIGMETs Page Operational
Using the Graphical Convective SIGMETs
GRAPHICAL ALERT WEATHER WATCHES PAGE (AWW)
(VDL
FIS Network Status Page Operational
Using the FIS Network Status
FIS TEXTUAL WEATHER
FIS Textual Products Operational
Using the FIS Text
Changing Weather
Changing Filter

Table of Contents
FIS
NO METARS AVAILABLE IN SELECTED
INVALID SUBSCRIPTION CODE, PLEASE CHECK AND
(VDL
UNDERSTANDING AVIATION WEATHER
UNDERSTANDING
UNDERSTANDING
SECTION 3
TRAFFIC AVOIDANCE OPERATION
TRAFFIC FUNCTION STATUS
Proximity Intruder
Traffic Advisory
Resolution Advisory
???Off Scale???
???No Bearing???

Table of Contents
TA/RA WHILE IN MAP OR WEATHER
VIEWING TRAFFIC IN A DATA
SYSTEM
TRAFFIC INFORMATION SERVICE
TIS
TIS OPERATIONAL
TIS
Proximity Intruder
Proximity Intruder
Traffic Advisory
Traffic Advisory
???Off Scale???
TRAFFIC ADVISORY WHILE IN MAP
VIEWING TRAFFIC IN A DATA
COAST
TIS SYSTEM
System
No Data
Transponder Not Reporting

Table of Contents
SECTION 4
FUNCTIONAL
STORMSCOPE?? FUNCTIONS STATUS
SWITCH BETWEEN WEATHER
Strike Display
CHANGING DISPLAY
SECTION 5
SYSTEM MESSAGES
VIEWING SYSTEM
APPENDIX A
DEFINITIONS, ACRONYMS AND
ACRONYMS AND

Table of Contents
APPENDIX B
COMMON WEATHER
APPENDIX C
GPS
GPS DATA
APPENDIX D
NAVIGATION

Table of Contents
Intentionally left blank

Introduction
SECTION 1
BASIC KMD 250 OPERATION
INTRODUCTION
All of us at Honeywell congratulate you on choosing this product. You are now the owner of one of the most sophisticated yet
We have made the operation of this unit as intuitive as possible through the use of Softkeys, menus, and
We thank you for your decision to purchase a KMD 250 and wish you many happy and safe hours flying.
The KMD 250 MFD is a panel mounted
The KMD 250 features a 3.8 inch diagonal color LCD display. It includes a high capacity data card for storing Jeppesen aviation data as well as cartographic map data including terrain elevation, roads, lakes, rivers, railroads, obstacles, political boundaries, cities, and urban areas. The card is updated on a 28 day cycle. Application software is also included on this card.
The KMD 250 is available in two versions. One version has an internal GPS and the other requires GPS information from an external source, such as the KLN 94. The internal GPS is certified only for VFR opera- tions. The functions of both versions will be discussed in this pilot???s guide. Functions that are related to the use of the optional internal GPS are marked with this  symbol.
1 Section
Operation Basic
Introduction

General Information
GENERAL INFORMATION
This portion of the manual provides an overview of the user interface controls and display presentation of the KMD 250 Multifunction Display.
This manual also provides an explanation of each of the individual dis- plays that the KMD 250 unit presents.
The operating system of the Bendix/King KMD 250 keeps to a minimum the number of key presses necessary to activate the various functions, especially those most frequently used in the air. The provision of a joy- stick makes it considerably easier to operate the unit and allows for fast and efficient access to most functions.
1 Section
Operation Basic
3 
2
1
1.On/Off/Brightness Control
2.Function Select Keys
3.Display
4.Softkeys
5.Data Card
6.Menu Key
7.Range Up Key
8.Range Down Key
9. NRST (Nearest) Key
10.Joystick
11.Rotary Knob
12.Softkey Labels
Rev 4 Aug/2007
45
10
11

Basic Operation
Section 1
General Information
FUNCTION SELECT KEYS
These keys are used to select available data sources (as indicated on the key) for display on the LCD. Pressing the same Function Select Key multiple times will sequence through the available pages associated with that function. The following diagram shows the available pages under each function. Note that not all pages will be available in all installations.
MENU KEY
Displays the available Softkey options for the currently selected function.
RANGE KEYS
RNG - Pressing this key will increase the range scale one level on the displayed page. Range scales on other pages will not be affected.
RNG???- Pressing this key will decrease the range scale one level on the displayed page. Range scales on other pages will not be affected.
The
The NRST (Nearest) Key is found on units without the internal GPS option. When pressed the Find Nearest Window will be displayed.
SOFTKEYS
When active, the description indicated in the label describes the key???s present function related to the displayed page. Whenever a new option is selected, a new display is shown along with its new key labels. This

General Information
capability of displaying operations that are only applicable to a particular screen is referred to as ???Soft Keying???, and allows one key to perform mul- tiple functions without the complications of multiple key presses on a conventional keypad.
JOYSTICK
This is a pointing device which moves a
1 Section
Operation Basic
ROTARY KNOB
The Rotary Knob, located in the lower right of the unit, has various func- tions as indicated by a soft label when active. It is also used to move through menu lists and change data within data fields.
STORMSCOPE?? OPTION
The KMD 250 has the ability to interface and control an
DEMO MODE
The Demo Mode can be used to practice using the KMD 250. This will allow you to utilize it to the maximum extent.
When the KMD 250 is in the Demo Mode, it performs as if it is receiving adequate sensor signals to use the various functions. See DEMO MODE & SETUP later in this section.
FUNCTION STATUS ICONS
The Function Status Icons are used to show the current status of Traffic Avoidance, Flight Information Services Weather Products and
In general, if a Status Icon has a gray background the function is not being displayed on the current display. This may be due to the setting on the Map Setup Overlays Group Page. If the map display range is beyond that set on the Map Setup Overlays Group Page, then the Status

Basic Operation
Section 1
General Information
Icon background will be gray because that function will not be displayed at that range setting.
If a Status Icon has a light blue (cyan) background the function is cur- rently being displayed. This does not necessarily mean that data is vis- ible because there may be nothing to view.
For example, if traffic icons are set to display at 30nm on the Map Setup Overlays Group Page and the VFR Map range is increased to beyond 30nm, then traffic will no longer be overlayed on the VFR Map display and the traffic Status Icon background will change from light blue to gray.
The following table illustrates the Function Status Icons and their mean- ings in more detail.

1 Section
Operation Basic
General Information
Basic Operation
Section 1
STARTUP DISPLAYS
At
If Stormscope?? is installed with the system, a display similar to the one at the right will be seen.
After the completion of the Self Test, press the OK Softkey.
One of the following Instrument Panel Self Test Pages will be displayed depending on whether the unit is equipped with an internal GPS or is the

General Information
Verify that the Message and Waypoint Alert annunciator lamps are on. These annunciators are external to the KMD 250, mounted elsewhere on the instrument panel as shown
here represented as MSG and
WPT. However, they are optional and may not be installed. Verify the GPS ALTITUDE (BARO ALTI-
TUDE will be displayed if the Typical External Annunciator Unit system is configured to use a baro-
metric altitude source) is consistent with the altimeter. If the KMD 250 is configured to use the optional internal GPS as ???sole source??? or ???backup??? verify the Course Deviation Indicator (CDI) is showing half scale right deflection with a FROM indication. If all is correct after verification, press the OK Softkey.
One of the following caution screens will now be displayed depending on whether the unit is the
1 Section
Operation Basic
Acknowledge the next caution page by pressing the OK Softkey.
The KMD 250 is now ready for use and will be showing the VFR Map Display.

Basic Operation
Section 1
General Information
Weather Display
POWER DOWN
When power is turned off a display similar to that shown here will be seen. The system will shut down in 5 seconds. This allows for inad- vertently turning off the system. Push the ON/OFF/Brightness Control back in before the count- down is over and the system will continue where it left off with no loss of data.
DATA FIELDS
Power Down Display
Data Fields may be used to display various types of information in win- dows on the left side of the screen, as shown here. This makes it easy to get quick access to desired information.
The Data Fields can be turned on or off and customized separately in each of the MAP, WX or TRFC Displays. The system will remember the last selected parameters in each function display and will maintain this configuration until changed.
General Information
1 Section
Operation Basic
Each field can be customized to display any of the following:
NOTE: Some fields may not have valid data depending on the installa- tion.
The CDI (Course Deviation Indicator) Display has scaling of 5nm, 1nm and .3nm depending on the setting on the Navigation Setup Page (see Navigation Setup in this section).
Basic Operation
Section 1
General Information
The Near Position (NEAR POS) display is intended to provide an easy method of reporting aircraft position to Air Traffic Control. This is done by always displaying the nearest reporting position to the aircraft???s pre- sent position in the Data Field. The position criteria can be set to display the nearest VORs, VORs plus airports or all data (airports, VORs, VOR/DME, VORTAC, NDB, VRP). Settings are made on the Navigation Setup Page discussed later in this section.
Pressing the RESTORE DEFAULT Softkey will reset the Data Fields back to the factory settings.

General Information
COURSE DEVIATION INDICATOR (CDI)
A Course Deviation Indicator (CDI) graphically displays left and right deviation from a desired course. A CDI can be displayed in any of the Data Fields as shown in Figure 1- 4. The CDI???s vertical bar operates like a navigation deviation needle on a conventional CDI or HSI using VOR/Localizer navigation. An
the CDI is not usable for navigation as seen in Figure
Figure
Figure
1 Section
Operation Basic

Basic Operation
Section 1
General Information
GREAT CIRCLE COURSES AND MAGNETIC VARIATION 
Due to ???great circle??? courses and magnetic variation differences between present position and the active waypoint, the To bearing and From radial may not be exactly 180?? different from each other. This condition is most likely to occur when long distances are involved, and/or you are operating in very northerly or southerly latitudes.
NN
72??
KPHX 
269??
Figure
See Figure
MINIMUM AND ENROUTE SAFE ALTITUDE
The Minimum Safe Altitude (MSA) displayed is the altitude defined by Jeppesen as ???Grid Minimum
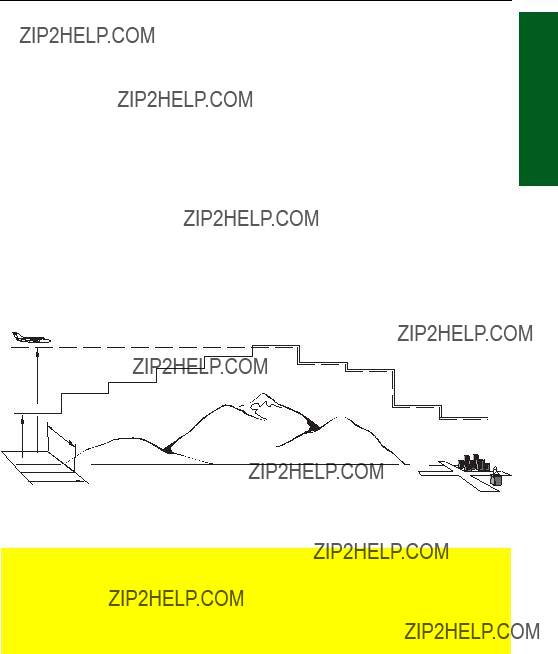
General Information
The MSA provides ???reference point??? clearance within these one degree latitude by one degree longitude sectors. Jeppesen defines a reference point as ???a natural (Peak, Knoll, Hill, etc.) or
The Enroute Safe Altitude (ESA) is the highest MSA sector altitude from the present position to the active waypoint, then to the destination way- point along the active flight plan. See Figure
1 Section
Operation Basic
ESA (MSL)
MSA (MSL)
1 ??
L A T.
1?? LONG.
Figure
CAUTION
The MSA and ESA altitudes displayed are advisory only. They should not be relied upon as the sole source of obstacle and ter- rain avoidance information. Refer to current aeronautical charts for appropriate minimum clearance altitudes.

General Information
INTERNAL GPS STATUS 
Basic Operation
Section 1
For an overview on how the Global Positioning System works, refer to Appendix C, GPS Primer.
Such parameters as present posi- tion, altitude, date, time, satellite state, DOP, satellites tracked, signal strength and elevation for the internal GPS can be monitored on the Internal GPS Status Page. To access this page perform the following:
1.Press the MENU Key to dis- play Figure
2.Press the AUX MENU Softkey to display Figure
3.Using the Rotary Knob or the Joystick to select Internal GPS Status as shown in Figure
4.Press the SELECT Softkey to display Figure
5.Press the RCVR INFO Softkey to view information such as the GPS receiver software part number, software version, soft- ware revision and serial number as shown in Figure
Figure
Figure
The KMD 250 is capable of tuning the KX 155A/165A Nav/Comm. The KMD 250 is capable of tuning up to four Nav/Comm systems, depending on the installation. Use of this feature will be discussed later in Map Operation and Flight Planning.
Figure

Map Operation
MAP OPERATION
The following illustration describes the data that appears on the Map Display.
1 Section
Operation Basic
2
6
7
 8 9
8 9
1
1Function Status Icons - Displays icons representing data available and displayed as well as sensor status.
2Data Fields - These can be turned on or off. Each of the 5 windows can be set to display one of the following; ALT, BRG, CDI, DIS, DEP TIME, DTK,
ESA, ETA WPT, ETE WPT, FLT TIME, GNDSPD, HEADING, MSA, NEAR POS, PPOS, TIME, TKE, TRFC, TRK, WPT, XTK.
3 North Pointer
4Aircraft Symbol - Indicates present position. Stylized airplane when heading or track input is present, a plus symbol with no heading or track.
5Range Rings - Outer ring radius is selected range, inner ring radius is one half the selected range.
6 RESET STICK Soft Label
7 Traffic Symbol Overlay - Displayed when traffic avoidance system is installed.
8Graphical METAR Icon Overlay - Displayed when FIS is installed and subscription is valid.
9 LEGEND Soft Label
10Current MAP Selection - VFR MAP (absolute altitude terrain shading), IFR MAP (no terrain shading) or Relative Terrain Map (relative altitude terrain shading).
11Display Range - RNG:####.

Basic Operation
Section 1
Map Operation
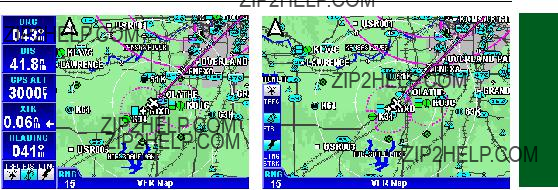
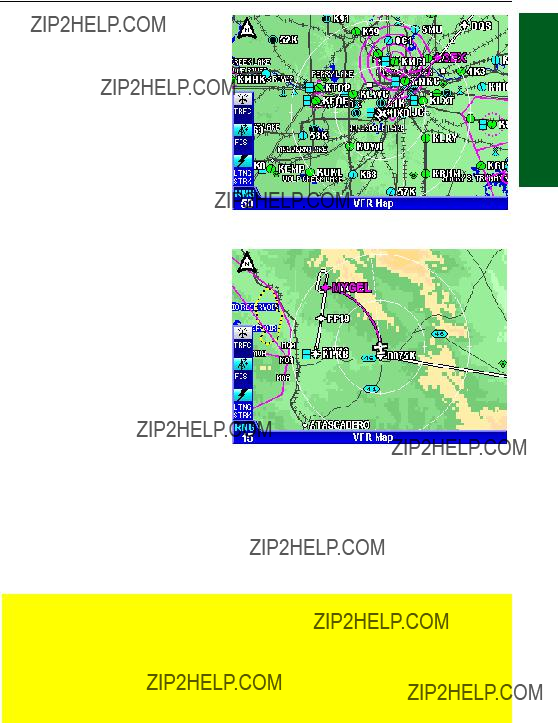
SELECTING A MAP DISPLAY
Press the MAP Function Select Key to sequence through the VFR Map, IFR Map and Relative Terrain Map Display. With the IFR Map displayed, no topographic data is displayed. With the Relative Terrain Map dis- played, topographic data is displayed as colors corresponding to eleva- tion relative to the aircraft???s present altitude. See Tables
VFR Map
IFR Map
Relative Terrain
Map
VFR MAP
With the VFR Map displayed, topographic data is displayed as colors corresponding to the absolute altitude stored in the database (see Figure
The VFR Map displays terrain similar to a VFR sectional chart. Table
levels and terrain shading used Figure
A color key can be displayed by moving the Joystick Pointer pressing the LEGEND Softkey as shown in Figure
Figure
Absolute Terrain Color Key

Table
1 Section
Operation Basic
IFR MAP
Terrain is not displayed on the IFR Map display as shown in Figure
RELATIVE TERRAIN MAP
With Relative Terrain Map dis- played, topographic data and obstructions are displayed as colors corresponding to eleva- tion relative to the aircraft???s present altitude as shown in Figure
Figure
Figure

Map Operation
Table
Figure
Relative Terrain Color Key
A color key can be displayed by moving the Joystick Pointer and pressing the LEGEND Softkey. Notice there are two legends when viewing the Relative Terrain Map Display. The first page shows the color key for terrain (Figure
however, does not represent current aircraft altitude. Press the NEXT and PREV Softkeys to toggle between the two displays. To exit, press the CLEAR Softkey then press the RESET STICK Softkey.
Figure

Map Operation
Terrain display to provide situational awareness by displaying a 1/2 nm ring around the obstacle. For example, the obstacles displayed with a red ring, as shown in Figure
NOTE: The color scale for obstacles is more severe than terrain so that they stand out on the map.
CAUTION
NEVER USE THE TOPOGRAPHIC ELEVATION DISPLAYED ON
THIS EQUIPMENT AS YOUR SOLE REFERENCE FOR TERRAIN
AVOIDANCE.
The KMD 250 must be receiving altitude information from an altitude source for the Relative Terrain Map to function. Altitude sources may be GPS altitude, pressure altitude (ARINC 429 or Gillham) or
source options are determined at installation. If no altitude information is received a cau- tion will be displayed as in Figure
NOTE: If a
Baro Correction
If the altitude information source is Gillham pressure alti- tude, then a baro correction must be entered manually. If the baro correction is not kept current the Relative Terrain Map will not display the proper color coding for the aircraft???s actual altitude.
When on the Relative Terrain
Map the KMD 250 will prompt for an entry every 30 minutes as shown in Figure
NOTE: The manual baro correction entry must be kept current on both the KMD 250 and the altimeter for the Relative Terrain Map to function properly.
1 Section
Operation Basic
Basic Operation
Section 1
Map Operation
The baro correction may also be entered through the AUX MENU as follows:
1.Press the MENU Key to display the Menu Softkeys as in Figure
2.Press the AUX MENU Softkey to display Figure
3. Press the SELECT Softkey and Figure
4. Turn the Rotary Knob to select the desired entry.
5. Press the OK Softkey.
OBSTACLE LABELS
Figure
Obstacles are labeled with two numbers. The first number is the height of the obstacle in FEET ABOVE MSL. The second number (in brackets) is the height of the obstacle in
FEET AGL.
Figure
Figure

Map Operation
USING THE MAP
After
If there is no valid GPS or FMS position fix data available, the words
CAUTION, No position data will be shown across the center of the display in a box as seen in Figure 1-
26. If the fix is lost at any time during normal operation of the unit, the same CAUTION, No position data box will be overlayed on the map.
CAUTION: Do not use the map for navigation while this notification is displayed.
The map will be shown in either North Up, Track Up or Heading Up orientation depending upon the setting selected in the Map Setup and is reflected by the North Pointer in the upper left of the display.
The displayed data is updated every second. Press the RNG (range up) or RNG ??? (range down) key at any time to zoom the map in and out to whichever one of the twelve
When active, Auto Zoom automatically adjusts the range setting up or down as needed to keep the flight plan active waypoint within the view- able area of the Map display.
Auto Zoom is enabled in either of the following ways:
1.Pressing RNG ??? past the minimum setting of 1 nm.
2.Pressing and holding either RNG Key for 2 seconds or more. While Auto Zoom is enabled, AUTO is displayed in light blue text above the current range setting (see Figure 1- 27).
1 Section
Operation Basic

Basic Operation
Section 1
Map Operation
MAP DATA
INTERROGATION
As soon as the joystick is moved, a display similar to Figure
The latitude and longitude of the pointer position is dis- played at the bottom of the display. The bearing (PBRG) and distance (PDIS) are also displayed. These show the distance and bearing from the aircraft present position to the joystick pointer. This function can be used to measure dis- tance and bearing to any point on the map. The window formed by the extremities of the display can be moved (panned) around the map by "bumping" the display borders left, right, up or down with the pointer. The RNG and RNG ??? keys can still be used to zoom the map in and out. Press RESET STICK and the
joystick pointer will vanish, the display will return to the moving map, and the map will be placed back in its present position at the zoom level that was selected prior to activating the joystick. If the joystick is not moved for 30 seconds, the display will
In addition to finding it useful for measuring distances and bearings, the joystick can be used for other tasks. By placing the pointer over any data icon a window will pop up similar to that shown in Figure 1- 29. Pressing the MORE INFO Softkey, a display similar to Figure

Map Operation
Press the CLEAR Softkey to return to the map display.
If the FIS INFO Softkey is pressed, the textual METAR page will be displayed for the closest reporting station to the current selection.
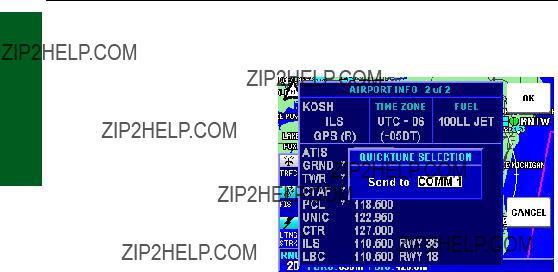
AIRPORT INFORMATION
As shown in Figure
Pressing the NEXT Softkey will display more details like radio frequencies and ser- vices, similar to Figure
times. The next window will display the available fuel types at this air- port. See Figure
1 Section
Operation Basic
Basic Operation
Section 1
Map Operation
If the FIS INFO Softkey is pressed, the textual METAR page will be dis- played with the current METAR report (if available) for this airport or the nearest report to the airport.
Pressing the QUICK TUNE Softkey will tune the appro- priate KX 155A/165A Nav/Comm to the selected frequency. Use the Joystick or Rotary Knob to place the cursor over the desired fre- quency in the list. If the system contains only one KX 155A/165A, simply pressing the QUICK TUNE Softkey will tune the Nav/Comm to the selected frequency. If multiple
KX 155A/165A systems are contained in the installation, pressing the QUICK TUNE Softkey will display the Nav or Comm selection display as shown in Figure

3Non GPS Approach Availability - The following may be displayed in this field:
NO APR No approaches are available
NP APR
ILS ILS approach available
ILS/MLS ILS and MLS approaches available
4 GPS Approach Availability - If an approved
5 Comm Frequency List - Lists the available communications frequencies for the airport being displayed. See Appendix A for abbreviations.
6 Fuel Availability - The following fuel types may be displayed: 80 80 to 87 octane
100 100 to 130 octane 100LL 100 octane, low lead JET Jet fuel, any type
AUTO Automotive fuel (also known as MOGAS)
7Time Zone - Displays the difference between local standard time and UTC for the selected airport. The difference in local daylight time and UTC is in
parenthesis.
8Radar Indicator - If (R) is displayed, this indicates an approach/departure radar environment.
Figure
NAVAID INFORMATION
1 Section
Operation Basic
As explained previously, you can access additional Navaid information by placing the joy- stick pointer over a VOR or NDB icon to display informa- tion similar to Figure
Figure

Basic Operation
Section 1
Map Operation
type, frequency and ident as shown in Figure
As discussed previously in Airport Information, pressing the QUICK TUNE Softkey will tune the appropriate KX 155A/165A Nav/Comm to the navaid frequency. If the system contains only one KX 155A/165A, simply pressing the QUICK TUNE Softkey will tune the Nav radio. If multiple KX 155A/165A systems are contained in the installation, pressing the QUICK TUNE Softkey will display the Nav selection display as shown in Figure
AIRSPACE
INTERROGATION
In order to interrogate a piece of airspace on the Map display, move the joystick pointer to one of the airspace boundaries to display an information window as shown in Figure 1- 39.
IMPORTANT:
When a single airspace boundary line is shared by two different pieces of air-
space (which is very common), the airspace with the lower vertical limit will always be highlighted.
Once it is determined the piece of airspace highlighted is the piece for which information is wanted (you may have to zoom out to verify this, but beware, some airspace switches off as you zoom out dependent on the settings made in Map Setup), press the MORE INFO Softkey and addi- tional information will be displayed as in Figure

Map Operation
The information shown on this display is all the information from the internal database that is relevant to the airspace selected. If some of the fields are blank or say SEE CHART, this means that Jeppesen data is not available for that partic- ular item.
As discussed previously, pressing the QUICK TUNE Softkey will tune the appro- priate KX 155A/165A Nav/Comm to the selected fre- quency. Use the Joystick or Rotary Knob to place the cursor over the desired fre- quency in the list. If the system contains only one KX 155A/165A, simply pressing the QUICK TUNE Softkey will tune the Comm to the selected frequency. If multiple KX 155A/165A systems are contained in the installation, pressing the QUICK TUNE
Softkey will display the Comm selection display as shown in Figure 1- 35. Use the Joystick or Rotary Knob to select the desired Comm for tuning. Press the OK Softkey to tune the radio.
1 Section
Operation Basic
AIRSPACE ALERTING
The Special Use Airspace (SUA) alert feature is three dimensional. The SUA areas are stored in the KMD 250 database with regard to altitude when the actual SUA altitude limitations are charted in terms of mean sea level (MSL). However, if the actual lower limit of an SUA is charted in terms of an altitude above ground level (AGL), then it is stored in the database as all altitude below the upper limit of the SUA. If the actual upper limit of an SUA is charted in terms of AGL, it is stored in the data- base as ???unlimited???.
If the altitude input to the KMD 250 is pressure altitude from an altitude encoder or air data computer, then you must manually update the KMD 250 with an altimeter setting (Baro Correction) in order to receive accu- rate SUA alerting. See the discussion on Baro Correction earlier in this section. It is a good idea to update the Baro Correction each time you make a change to the aircraft???s altimeter setting.

Basic Operation
Section 1
Map Operation
NOTE: If there is no altitude input to the KMD 250, all altitudes will be regarded as being within the boundary of the SUA area.
The message prompt for a special use airspace alert will occur when the aircraft???s position is at a point such that a projection of the aircraft???s existing track over the ground is approximately 10 minutes from pene- trating the outer boundary of one of these areas. It will also occur if the aircraft is within approxi-
mately two nautical miles of
one of these areas even if the aircraft???s projected track over the ground won???t actu- ally penetrate the SUA area
(see Figure
another message will state:
Inside SUA.
If the SUA alert feature has been enabled, the KMD 250 allows selection of a vertical buffer on the in order to provide an additional layer of protec- tion from inadvertently entering an SUA. The vertical buffer serves to ???stretch??? the SUA area in both directions (up and down) by the selected buffer altitude. For example, a buffer of 1,000 feet is selected and the actual SUA area exists from 5,000 feet MSL to 12,000 feet MSL. In this case SUA alert messages are displayed if the aircraft enters the lateral boundary at any altitude between 4,000 and 13,000 feet MSL.
CAUTION
It is the pilot???s responsibility to avoid special use airspace where ATC clearance to penetrate is required but has not been obtained. The airspace alert is only a tool to assist the pilot and should never be relied upon as the sole means of avoiding these areas.

Map Operation
When SUA Alerting is enabled, an Airspace Alert message will be provided when the aircraft is approximately 10 minutes or 2 miles (depending on ground speed) from entering the air- space boundary. When an Airspace Alert message is given, MESSAGE PRESS MENU will flash at the bottom of the display as shown in Figure
Pressing the MENU Key will display the message as shown in Figure
To enable or disable SUA Alerting perform the following:
1.Press the MENU Key. Press the AUX MENU Softkey to display Figure
2.Use the Rotary Knob or the Joystick to place the cursor over Navigation Setup as shown in Figure
Figure
Figure
1 Section
Operation Basic
Figure
Map Operation
Basic Operation
Section 1
3.Press the SELECT Softkey to display Figure
4.Press the NEXT Softkey to display Figure
5.Use the Joystick to place the cursor in the selection field for SUA Alerting.
6.Use the Rotary Knob to select On or Off.
7.When On is selected the
SUA Alerting Buffer will be editable. Use the Joystick to place the cursor over this field (see Figure
Figure
Figure
Figure
Map Operation
DISPLAY FLIGHT PLAN
DATA ON MAP
If a host GPS is outputting data in the Bendix/King equivalent ARNAV
If a KLN 94 is supplying the GPS data, and the KLN 94 is configured to produce the ???Enhanced
If another type of GPS is used, then during the curved flight segments of approaches (i.e. DME arcs, procedural turns and holds) most GPS units
stop outputting flight plan data but continue to output positional data. During a DME arc or procedural turn, the KMD 250 will continue to show position, track and ground speed but the curved line depicting the arc or turn will not be displayed. In OBS mode, some GPS units will not be able to provide flight plan data. Present position is still provided and flight plans will be displayed as soon as the mode is returned to LEG.
CAUTION
In the case of DME arcs, turns and holds, some GPS units send the flight plan information as if there was no arc or curved flight path. Therefore the KMD 250 has no option but to connect the beginning and end waypoints of the arc or curve with a straight line. Under these circumstances the line on the KMD 250 MUST BE IGNORED.
1 Section
Operation Basic

Map Operation
Basic Operation
Section 1
TEMPORARILY DECLUT-
TERING THE MAP
Sometimes it is necessary to temporarily reduce the amount of data displayed on the map in order to make it more readable. This is known as decluttering. Perform the following steps until the desired level declut- tering is achieved.
1.Press the MENU Key to display the DECLUTTER Softkey as shown in Figure 1-
2.Press the DECLUTTER
Softkey. On the first press the land data will be removed from the display as seen in Figure 1-
52.Notice roads, railways, city icons, etc. are no longer dis- played. Note also that a
3.Press the DECLUTTER
Softkey again. On the second press the aeronautical data will be removed from the display as seen in Figure
Figure
Figure
Figure

Map Operation
4.Press the DECLUTTER
Softkey again. The third press will now restore the land data as seen in Figure
5.Press the DECLUTTER
Softkey again. The fourth press will now restore the
When leaving the Map display to view another function, all data will be restored.
1 Section
Operation Basic
FIND NEAREST (UNITS WITHOUT INTERNAL GPS)
Find Nearest allows the user to find the airport, VOR, NDB, intersection or user entered waypoint closest to the aircraft???s present position. Up to 20 of the find criteria may be listed and must be within 200nm of the air- craft???s position. The closest will be listed first, the furthest listed last.
1. Press the NRST Key to display the FIND NEAREST display as shown in Figure 1- 55. In this case a list of air- ports is displayed.
Figure

Map Operation
Basic Operation
Section 1
3.To change to one of the other Find parameters, press the NEAREST TYPE Softkey to display the SELECT NEAREST TYPE window as shown in Figure
4.Use the Joystick or Rotary Knob to place the cursor over the desired Find type.
5.Press the OK Softkey.
6.If Airports is selected as the type (as in Figure
7.The listed airports can be filtered by runway length and runway type. Use the Joystick to place the cursor over the desired field and use the Rotary Knob select the the desired value. When finished press the OK Softkey.
Figure
Figure
Figure

Map Operation
FIND NEAREST (UNITS
WITH INTERNAL GPS) 
As discussed previously, Find Nearest allows the user to find the airport, VOR, NDB, inter- section or user entered way- point closest to the aircraft???s present position. Up to 20 of the find criteria may be listed and must be within 200nm of the aircraft???s position. The closest will be listed first, the furthest listed last.
1. Press the
FIND NEAREST display. The Find Nearest feature is now used as discussed previously.
If the KMD 250 is presently navigating using the internal GPS, Figure 1-
60 will not be displayed and Figure
immediately upon pressing the
Figure
Figure
Figure
1 Section
Operation Basic
2. Press the NEAREST Softkey to go to the FIND NEAREST display as shown in Figure
Map Operation
Basic Operation
Section 1
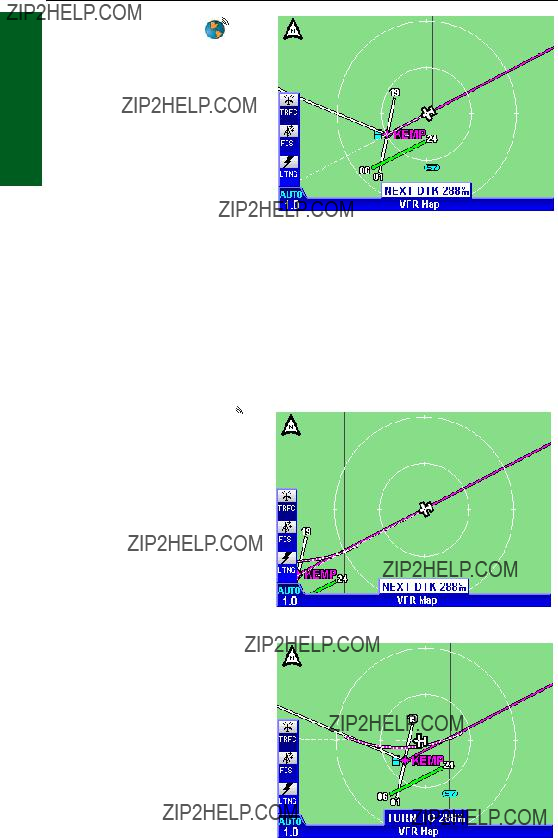
WAYPOINT ALERT
The Waypoint Alert will flash the next desired track (NEXT DTK) when the estimated time to the next waypoint is about 15 seconds as shown in Figure
Figure
If the waypoint is being dis-
played in a Data Field the WPT field will flash annunciating the Waypoint Alert.
When viewing the Flight Plan Page the arrow indicating the current leg will flash to annunciate the Waypoint Alert.
If an external Waypoint Alert annunciator is installed in the aircraft, it will also flash.
TURN ANTICIPATION 
When Turn Anticipation is enabled in Navigation Setup, it will provide turn guidance to a new course for intercepting the next leg of the flight plan.
Waypoint Alerting will begin when the estimated time to the start of the turn is about 20 seconds. As previously dis- cussed, the Waypoint Alert will be annunciated by flashing the next desired track (NEXT DTK) window as in Figure 1- 64. When the computed turn point is reached TURN TO will displayed as shown in Figure
Figure
Figure
KMD 250 Pilot's Guide

Map Operations
Turn Anticipation will be inhibited if the angle between the legs is less than 5?? or greater than 175?? or the Crosstrack Error (XTK) is greater than 4 nm.
To utilize the Turn Anticipation feature, start the turn transition to the next leg in the flight plan at the very beginning of the computed turn point. Upon reaching this computed turn point the Waypoint Alert annunciator will stop flashing and remain on steadily while the text ???TURN TO??? is dis- played as shown in Figure
If an autopilot is engaged, this is the time to change the selected course on the CDI or HSI to that indicated next to TURN TO. In the case of Figure
1 Section
Operation Basic

Map Operation
Basic Operation
Section 1
Intentionally left blank

User Waypoints
USER WAYPOINTS
User waypoints can be entered as either user defined waypoints or as airports. The KMD 250 allows for the programming of up to 1,000 user waypoints. User waypoints are stored on the KMD 250 data card and can be transferred to a new data card when installed.
These waypoints can be used for flight plans if the KMD 250 contains the optional internal GPS, but only if the internal GPS is currently being used for navigation. Flight plans running on an external GPS cannot utilize waypoints stored in the KMD 250.
KMD 250 systems that do not have the internal GPS also allow user waypoints to entered, but can only be used for marking points on the map for such things as points of interest, landing locations not contained in the database, etc.
1 Section
Operation Basic
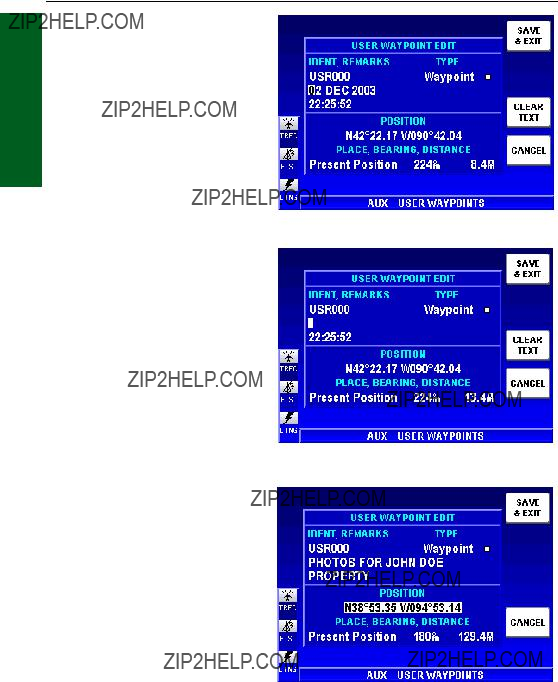
ENTERING A USER WAYPOINT
The following illustration describes the User Waypoint Edit display.
9
1
 8
8
2
3 
4
1Waypoint Identifier - The system default will initially be USR000 and will increment with each entered waypoint up to USR999. Any combination of alphanumeric characters (up to six places) may be entered in place of the default.
21st Remarks Field - The default entry is current date. This field may be cleared and any combination of up to 24 alphanumeric and punctuation characters may entered.
32nd Remarks Field - The default entry is current time. This field may be cleared and any combination of up to 24 alphanumeric and punctuation characters may entered.
4Waypoint Latitude/Longitude - Initially, the aircraft position at the time this display was selected is entered here. This field may be changed to place the waypoint at different
location.
5Place - A new waypoint is initially placed at the present position. An airport or navaid identifier can also be entered to define the waypoint position as a bearing and distance from
the airport or navaid.
6Bearing - Can indicate bearing from the current aircraft position to the waypoint, or
a bearing may be entered to define a waypoint position relative to an airport or navaid.
7Distance - Can indicate distance from the current aircraft position to the waypoint,
or distance may be entered to define a waypoint position relative to an airport or navaid.
8 Waypoint Icon - Waypoint symbol that will be displayed on the map.
9Waypoint Type - This field may be changed to indicate Waypoint or Airport depending on the desired waypoint definition.
Basic Operation
Section 1
User Waypoints
Softkey to display the USER WAYPOINT LIST display as shown in Figure
Figure
Figure

User Waypoints
3. Press the NEW WPT Softkey to display the USER WAYPOINT EDIT display as shown in Figure
The system default waypoint identifier will be a naming con- vention as shown in the IDENT field. The default identifier will increment starting with USR000. The user can also enter any identifier desired, but limited to any combination of six alphanumeric characters. If the default identifier is accept- able, proceed to step 5.
4.To enter a waypoint identi- fier other than the system default, turn the Rotary Knob one increment and the first character will be highlighted as in Figure
5.The current date and time default to the two fields under the waypoint identifier. Remarks regarding the way- point can be entered in these fields in place of the date and time.
Figure
Figure
Figure
1 Section
Operation Basic
If remarks are desired, use the Joystick to place the cursor on the first line containing the date as shown in Figure
Basic Operation
Section 1
User Waypoints
6.Turn the Rotary Knob one increment to highlight the first character on the line as in Figure
7.Press the CLEAR TEXT
Softkey to clear the field as shown in Figure
8.Turn the Rotary Knob to enter the desired alphanumeric or punctuation character.
11. The default waypoint POSITION is the aircraft posi- tion at the time the USER WAYPOINT EDIT display was selected. The latitude and longitude of the waypoint is displayed. As the aircraft con- tinues moving, the Present
Position is indicating the current bearing and distance to the waypoint position. Note that these are changing as the aircraft moves.
12. A waypoint can be entered for any position. This can be done in two ways. One way is by entering the desired latitude and longitude of the waypoint. This is done by using the Joystick to place cursor over the latitude/longitude field as shown in Figure

User Waypoints
the cursor to the next field. Again, use the Rotary Knob to enter the desired number. Repeat using the Joystick and the Rotary Knob until the desired latitude/longitude is entered.
13.The second way to enter the position of a waypoint is by entering the bearing and dis- tance from a known position, such as an airport or navaid. This is done by first using the Joystick to place the cursor over Present Position as shown in Figure
14.Use a combination of the Joystick and Rotary Knob as previously discussed to enter the desired identifier of the air- port or navaid as shown in Figure
Figure
Figure
1 Section
Operation Basic
Figure

Basic Operation
Section 1
User Waypoints
15.Press the OK Softkey and the selected identifier will be entered into the PLACE field as shown in Figure
16.Use the Joystick to place the cursor over the BEARING field as in Figure
17.Use the Rotary Knob to enter the waypoint bearing noted from the WAYPOINT
ENTRY Page.
18.In the same way as entering the bearing, use the Joystick to place the cursor over the DISTANCE field.
19.Use the Rotary Knob to enter the waypoint distance noted from the WAYPOINT ENTRY Page. Note that the KMD 250 has also computed the latitude/longitude for the waypoint.
20. Press the SAVE & EXIT
Softkey.
Also, if a waypoint is defined by entering the latitude/longitude and an airport or navaid identi- fier is then entered, the KMD 250 will compute the bearing and distance of the waypoint from the selected airport or navaid.
After the waypoints are saved, the User Waypoint List is dis- played. Several waypoints
have been entered in the example in Figure

User Waypoints
ENTERING A USER AIRPORT
A User Airport is actually a User Waypoint to which additional airport information may be added.
The first User Airport Edit display is used in the same way as the User Waypoint Edit display as previously discussed. The following illustration describes the second User Airport Edit display.
1 Section
Operation Basic
9
1
8
2
3
7
6
45
1 Waypoint Identifier - Editable on the first User Airport Edit display.
2 Runway Orientation - Selectable from 01/19 through 18/36. 3 Runway Surface Type - Hard or Soft can be selected.
4Comm Frequecy Type - One of 33 abbreviations may be selected in each of two fields. See Appendix A for abbreviations.
5Comm Frequecies - Any valid 8.33 kHz or 25 kHz communication frequency in each of two fields.
9Waypoint Type - This field reflects Waypoint or Airport depending on the desired waypoint definition. Selectable on the first User Airport Edit display.
After entering the identifier, remarks and position informa- tion as discussed in steps 1 through 19 of Entering A User Waypoint, perform the fol- lowing to enter additional infor- mation airport information.
1. Use the Joystick to place the cursor over the TYPE field as shown in Figure
Figure

Basic Operation
Section 1
User Waypoints
2.Turn the Rotary Knob to select Airport as shown in Figure
3.Press the NEXT Softkey to display USER AIRPORT 2 of 2 as shown in Figure
Figure
4. Turn the Rotary Knob to enter the desired runway orien- tation. Values of 01/19 through 18/36 may be entered as seen in Figure
Figure
Figure

User Waypoints
5.Use the Joystick to place the cursor in the Surface field as shown in Figure
6.Turn the Rotary Knob to select either Soft or Hard for the type of surface as shown in Figure
7.Use the Joystick to place the cursor in the runway Length field. Use the Rotary Knob to select the desired runway length. A value from 0 to 20,000 feet can be entered. Note that 2000 ft. has been entered in Figure
8.Use the Joystick to place the cursor in the runway eleva- tion (Elev) field. Use the Rotary Knob to select the desired runway elevation. A value from
Figure
Figure
1 Section
Operation Basic
Figure

Basic Operation
Section 1
User Waypoints
9.Two communication fre- quencies may be entered to provide QuickTune??? capa- bility. Use the Joystick to place the cursor in the desired comm Type field as shown in Figure
10.Turn the Rotary Knob to select the desired the fre- quency type as shown in
11.In a similar manner as pre- viously discussed, use the Joystick and the Rotary Knob to enter the desired frequen- cies in the appropriate Freq fields as seen in Figure
12.When all desired entries are completed, press the
SAVE & EXIT Softkey.
Figure
Figure

User Waypoints
Table
1 Section
Operation Basic
User Waypoints
Basic Operation
Section 1
EDITING A USER WAY-
POINT
Editing a waypoint is accom- plished in a similar manner to entering a new waypoint. To edit a User Waypoint that has been previously stored, per- form the following steps:
1.Press the MENU Key to display Figure
2.Press the SELECT Softkey to display the USER WAYPOINT LIST display as shown in Figure
3.Press the EDIT WPT Softkey to display the USER
WAYPOINT EDIT.
4.Repeat steps 3 through 20 in Entering A User Waypoint.
Figure
Figure
Figure

User Waypoints
DELETING A USER
WAYPOINT
To delete a User Waypoint that has been previously stored, perform the following steps:
1. Perform steps 1 and 2 in Editing A User Waypoint.
2. Press the DELETE WPT Softkey. Figure
1 Section
Operation Basic
be displayed.
Figure
3. Press the OK Softkey to complete the deletion.
NOTE: Waypoints that are part of a flight plan (denoted by the lock symbol in the User Waypoint List) cannot be deleted until removed from the flight plan.

User Waypoints
Basic Operation
Section 1
Intentionally left blank


The
The KMD 250 must be navigating using the internal GPS when using the
must be performed from the external navigation source.
1 Section
Operation Basic
BASE OR STORED
WAYPOINT
1.If there is no active flight plan, pressing the
2.Turn the Rotary Knob to display the Waypoint Entry Page as shown previously in Figure
3.Press the OK Softkey to enter the destination in the DIRECT TO field as in Figure
Also, the NEAREST Softkey can be used to select a desti- nation from the FIND NEAREST list as discussed earlier in this section. Pressing the SELECT Softkey will enter the selected identifier into the
DIRECT TO field.
4. Press the ACTIVATE Softkey and the selected
Figure
Figure
Figure

Basic Operation
Section 1
JOYSTICK POINTER
1.While on the Map Display, use the Joystick Pointer to select the desired destination as in Figure
2.Press the
3.Press the ACTIVATE Softkey and the route will be displayed on the Map as shown in Figure
Figure
Figure
The
OBS Course Mode allows the selection of a course based on a bearing ???to??? or ???from??? a waypoint much like a VOR receiver.

1.Select the destination as discussed in the
2.Press the OBS COURSE
Softkey shown in Figure
1 Section
Operation Basic
NOTE: Unless using OBS Course Mode within an active flight plan, Auto Leg Sequencing (see Appendix A) will be disabled.
3.The course field will be highlighted. Use the Rotary Knob to select the desired OBS course. If desired, the Joystick can be used to select the destination identifier in order to enter a new destina- tion. Turn the Rotary Knob to display the WAYPOINT ENTRY window.
4.Press the ACTIVATE Softkey and the route will be displayed on the Map as shown in Figure
Figure
Figure
NOTE: When OBS Mode is active, pressing the
To change the OBS course to
a
To center the CDI, from the OBS COURSE window (Figure

Basic Operation
Section 1
Intentionally left blank

Flight Plan Operation
FLIGHT PLAN OPERATION
VFR flight plans can be created in the KMD 250 when configured to use the internal GPS. In units without the optional internal GPS the active flight plan from the external GPS may be viewed.
The FPL Key is used to toggle between the ACTIVE FLIGHT PLAN Page and the FLIGHT PLAN INDEX Page.
Active Flight
Plan
Flight Plan
Index
1 Section
Operation Basic
NOTE: The internal GPS of the KMD 250 is not certified for IFR opera- tion.
The KMD 250 calculates a flight plan by picking the most direct route between selected waypoints. This is known as Leg Mode operation.
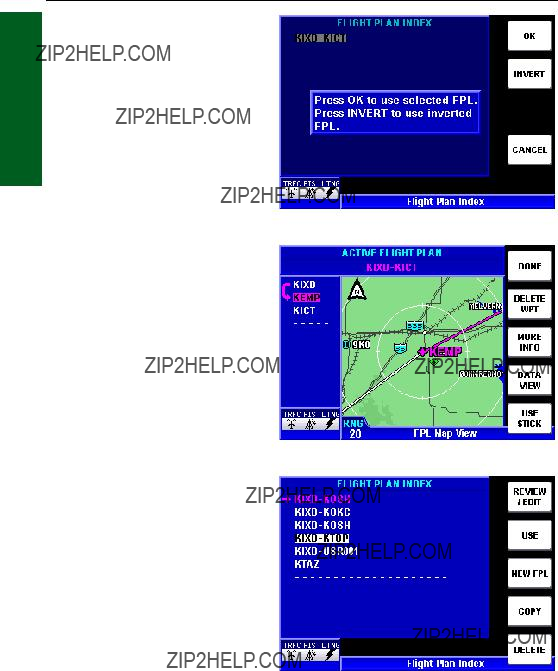
VIEWING THE ACTIVE FLIGHT PLAN
Press the FPL Key to display the ACTIVE FLIGHT PLAN
Page as shown in Figure 1- 104. If the KMD 250 does not have the optional internal GPS the DONE and DELETE WPT
Softkeys will not be available.
The active leg and waypoint are shown in magenta. When Auto Leg Sequencing is enabled, after passage of the active waypoint the KMD 250 will automatically sequence to the next waypoint in the flight
plan. The next leg and active waypoint will then be displayed in magenta.
The waypoints in the flight plan are listed on the left of display. Moving the Joystick up or down will scroll through the waypoints. The magenta arrow denotes the current leg of the flight plan. The active waypoint identifier is also displayed in magenta. When scrolling through the way-

Basic Operation
Section 1
Flight Plan Operation
points, as each waypoint is highlighted it is displayed on the map centered in the window. The current leg and active waypoint are shown in magenta on the map.
Information about a waypoint can be viewed by using the Joystick to select the desired waypoint identifier in the list and then pressing the MORE INFO Softkey. Information will be displayed as shown in Figure
Pressing the USE STICK Softkey will allow use of the Joystick Pointer for map inter- rogation as discussed previ- ously in Map Operation (see Figure
If applicable, press the MORE INFO softkey to view more
information about the selection. In the case of an airport, pressing the NEXT softkey on the AIRPORT INFO 1 of 2 Page will display the AIRPORT INFO 2 of 2 and allow access to the QUICK TUNE Softkey. Pressing this softkey will tune the radios to the correct frequencies for the airport as discussed previously in Airport Information.
VIEWING FLIGHT PLAN
DATA
When viewing the the ACTIVE FLIGHT PLAN Page (Figure
107. Pressing the MAP VIEW Softkey will return to the previous map view display.

Flight Plan Operation
FUEL FLOW
If the KMD 250 is installed in conjunction with a fuel flow monitor, the actual fuel flow and estimated fuel usage cal- culations will be displayed in white as in Figure
NOTE: Fuel flow values can only be entered manually on the ACTIVE FLIGHT PLAN
Page if no fuel flow monitor is installed.
CHANGING THE DATA
COLUMNS
The three data columns can be changed to reflect various types of information for each leg. To change the columns perform the following steps.
1.Press the CHANGE FIELDS Softkey to display Figure
2.Move the Joystick horizon-
Figure
1 Section
Operation Basic
tally to select the desired data column (in this case the first column).
3.Turn the Rotary Knob to select one of the available options from the list. Each field can be customized to display any of the following:
4.Press the DONE Softkey when finished and the columns will now display the selected data options.
Pressing the RESTORE DEFAULT Softkey to change the columns back to the factory settings.
Flight Plan Operation
Basic Operation
Section 1
CREATING A FLIGHT
PLAN 
A maximum of 99 flight plans may be stored in the KMD 250. Each flight plan may contain up to 99 waypoints. To create a new flight plan, perform the fol- lowing steps.
1.Press the FPL Key to toggle to the FLIGHT PLAN INDEX Page. Initially, if no flight plans have been stored, the display will appear as shown in Figure
2.Press the NEW FPL Softkey to display the STORED FLIGHT PLAN Page as seen in Figure
To enter an identifier, turn the Rotary Knob and the WAYPO- INT ENTRY window will be dis- played as in Figure
Figure
Figure
Figure

Flight Plan Operation
Press the OK Softkey and the first waypoint is entered in the list as shown in Figure
To select the waypoint using the Joystick Pointer, press the USE STICK Softkey. Using the Joystick, move the pointer to the desired place on the map as in Figure
Figure
3. Continue entering way- points using either method until the flight plan is complete. Press the DONE Softkey and the flight plan will be entered on the FLIGHT PLAN INDEX
Page as shown in Figure 1- 115.
Figure
Figure
1 Section
Operation Basic
Flight Plan Operation
Basic Operation
Section 1
4.To start using the flight plan press the USE Softkey. Figure
5.Press the OK Softkey to activate the flight plan as shown in Figure
ACTIVATING A STORED
FLIGHT PLAN 
Perform the following steps to activate a flight plan that has been stored in the KMD 250.
1.Press the FPL Key to dis- play the FLIGHT PLAN INDEX
Page as seen in Figure
2.Use the Joystick to select the desired flight plan in the list.
Figure
Figure
Figure

Flight Plan Operation
3.Press the USE Softkey and Figure
4.Press the OK Softkey to use the selected flight plan. If desired, the selected flight plan can be navigated in reverse by pressing the INVERT Softkey.
The selected flight plan will now be displayed on the ACTIVE FLIGHT PLAN Page as in
5. Press the DONE Softkey to return to the FLIGHT PLAN INDEX Page.
Figure
1 Section
Operation Basic

Flight Plan Operation
Basic Operation
Section 1
EDITING A STORED
FLIGHT PLAN 
To edit the active or a stored flight plan, begin by pressing the FPL Key to display the
FLIGHT PLAN INDEX Page as seen in Figure
Pressing the COPY Softkey will allow the selected flight plan to be copied for editing while not changing the original.
DELETING A WAYPOINT IN
THE FLIGHT PLAN
To delete a waypoint in the flight plan, perform the fol- lowing steps.
1.Use the Joystick to select the waypoint to be deleted in list on the left of the display.
2.Press the DELETE WPT
Softkey to display Figure 1-
123.Press the OK Softkey to delete the waypoint.
3.Press the DONE Softkey to return to the FLIGHT PLAN INDEX Page.
Figure
Figure
Figure

Flight Plan Operation
INSERTING A WAYPOINT IN
THE FLIGHT PLAN
To insert a waypoint in the flight plan, perform the following steps.
1.Use the Joystick to select a waypoint in list to which the new waypoint will be inserted before or after (in this case OTM) as shown in Figure 1-
2.Select the new waypoint with one of the following methods.
To enter an identifier, turn the Rotary Knob and the WAYPO- INT ENTRY window will be dis- played as in Figure
Figure
Figure
1 Section
Operation Basic
Figure

Basic Operation
Section 1
Flight Plan Operation
To select the waypoint using the Joystick Pointer, press the USE STICK Softkey. Using the Joystick, move the pointer to the desired place (KTVK) on the map as in Figure
to return to the FLIGHT PLAN INDEX Page.
Figure
Figure

Flight Plan Operation
CHANGING THE NAME OF
THE FLIGHT PLAN
The name of the flight plan can be changed from either the
STORED FLIGHT PLAN or ACTIVE FLIGHT PLAN Pages while in FPL Map View or FPL Data View.
To change the name of the flight plan, perform the fol- lowing steps.
1.Use the Joystick to select the flight plan name as shown in Figure
2.Turn the Rotary Knob one increment and the flight plan name will shift to the left with the first character highlighted as in Figure
3.Use the Rotary Knob to enter the desired first character for the new waypoint name.
4.Use the Joystick to select the next character field.
5.Use the Rotary Knob to enter the next desired char- acter for the new waypoint name. Continue until the desired name is entered as seen in Figure
Figure
Figure
Figure
1 Section
Operation Basic
Pressing the DEFAULT NAME
Softkey will cause the flight plan name to revert back to name previously given by KMD 250. Pressing the CLEAR NAME Softkey will delete all characters in the flight plan name field allowing different characters to be entered.

Basic Operation
Section 1
Flight Plan Operation
6.Press the OK Softkey and the new name will shift back to the center as in Figure
7.Press the DONE Softkey and the new flight plan name will be displayed in the list of flight plans as shown in Figure
To delete a flight plan, perform the following steps.
1.Press the FPL Key until the FLIGHT PLAN INDEX
Page is displayed as shown in Figure
2.Use the Joystick to select the flight plan name.
Figure
3.Press the DELETE Softkey and Figure
4.Press the OK Softkey and the flight plan will be deleted.
Figure

Flight Plan Operation
DELETING THE ACTIVE
FLIGHT PLAN 
To delete the active flight plan perform the following steps:
1.Press the FPL Key until the
FLIGHT PLAN INDEX Page is displayed as shown in Figure
2.Press the DELETE Softkey and Figure
3.Press the OK Softkey to delete the active flight plan. As shown in Figure
NOTE: If the active flight plan has not been stored prior to deleting, press the COPY Softkey to store a copy of the active flight plan before pressing the DELETE Softkey.
Figure
Figure
1 Section
Operation Basic
Figure
Basic Operation
Section 1
Flight Plan Operation
USING 
Sometimes it may be desirable to proceed directly to a waypoint in a flight plan or a specific leg in a flight plan. For example, after takeoff in a terminal area, vectors may be given followed by a clearance directly to the first waypoint in the filed flight plan or to intercept a particular leg in the filed flight plan. A
NOTE: Remember, the internal GPS of the KMD 250 is not certified for IFR operation. Navigation of ATC clearances on the KMD 250 can only be done as a backup to the primary navigation system.
PROCEEDING
AN ACTIVE FLIGHT PLAN
WAYPOINT
To do a
Figure
Flight Plan Operation
4. The
After the waypoint is reached, the KMD 250 will navigate the remainder of the active flight plan.
MANUALLY SELECTING AN
ACTIVE FLIGHT PLAN LEG
To select a specific leg within an active flight plan perform the following steps.
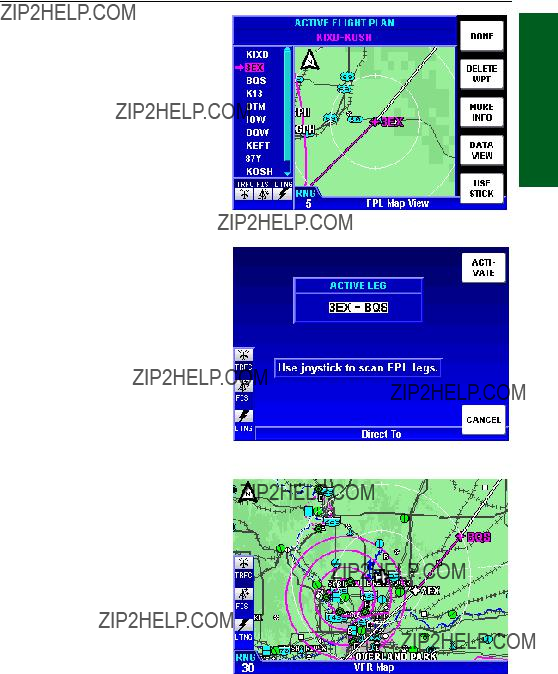
1.Press the
2.Press the
3.Use the Joystick to scan the flight plan legs.
4.When the desired leg is displayed, press the ACTI- VATE Softkey and the Map will again be displayed as in Figure
Figure
Figure
Figure
1 Section
Operation Basic
After the leg is intercepted, the KMD 250 will provide navigation guid- ance the remainder of the active flight plan.

Basic Operation
Section 1
Flight Plan Operation
DELETING A
WITHIN THE ACTIVE
FLIGHT PLAN
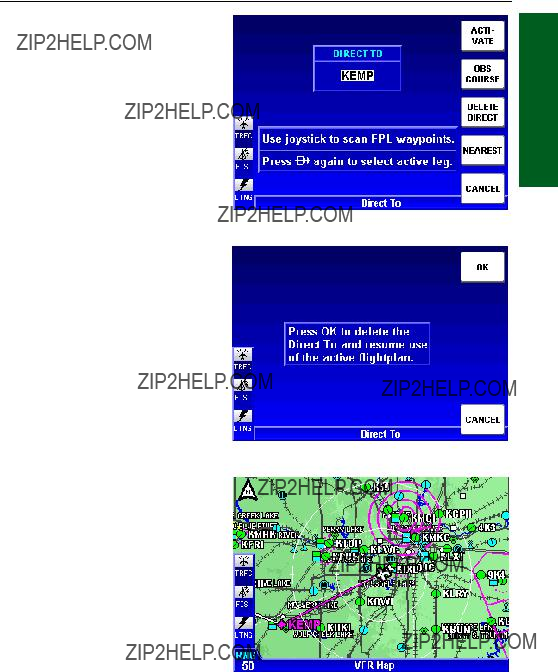
If it becomes necessary to delete a
1.Press the
2.Press the DELETE DIRECT Softkey to display Figure
3.Press the OK Softkey. The Map will again be dis- played with guidance to inter- cept and resume the active flight plan as shown in Figure
Figure
Figure

Flight Plan Operation
USING OBS COURSE MODE IN THE ACTIVE FLIGHT
PLAN 
It may also be desirable to proceed directly to a waypoint in a flight plan on a specific bearing. An OBS Course can be set to the waypoint. If Automatic Leg Sequencing (see Appendix A) is enabled, after reaching the waypoint the KMD 250 will automatically begin navigating the next leg in the active flight plan. If Automatic Leg Sequencing is disabled, the aircraft will overfly the waypoint and continue on the selected course. If waypoints exist in the flight plan prior to that which the OBS Course is established, these waypoints will be bypassed. If an OBS Course is established to a waypoint not in the flight plan, the navigation of the active flight plan will not resume after the waypoint is reached.
1 Section
Operation Basic
SETTING AN OBS COURSE
TO AN ACTIVE FLIGHT
PLAN WAYPOINT
To set an OBS Course to a waypoint within an active flight plan perform the following steps.
Figure

Basic Operation
Section 1
Flight Plan Operation
4. Use the Joystick to high- light the Auto Leg Seq. field as shown in Figure
5. Use the Rotary Knob to select Enabled. With Auto Leg Sequencing enabled the remaining portion of the flight plan will automatically resume after passing the waypoint.
Figure
Flight Plan Operation
DELETING AN OBS
COURSE WITHIN THE
ACTIVE FLIGHT PLAN
If it becomes necessary to cancel the selected OBS Course in an active flight plan (as seen in Figure
1.Press the
2.Press the DELETE DIRECT Softkey and Figure 1-
152will be displayed.
3.Press the OK Softkey to confirm the deletion. The map will now display the active flight plan in Leg Mode as shown on Figure
1 Section
Operation Basic
Figure
Figure

Flight Plan Operation
Basic Operation
Section 1
TRIP PLANNING USING
PRESENT POSITION 
For planning purposes the internal calculator can be used to determine such things as time, distance and required fuel to waypoints, for another flight plan or for modifications to the active flight plan. This is done by inserting the aircraft???s prese- nt position into a desired sce- nario and using the data view of the Active Flight Plan Page and selecting the desired data columns to present the needed information.
The following example illus- trates checking time, distance and required fuel to KDSM while navigating a flight plan from KIXD to KOSH as shown on Figure
1.Perform the following steps to create a new flight plan as previously discussed.
2.Enter the desired destina- tion (in this case KDSM) using the Rotary Knob as shown in Figure
3.Press the OK Softkey to display Figure
Figure
Figure
Figure

Flight Plan Operation
4.Use the Joystick to high- light the destination identifier as shown in Figure
5.Turn the Rotary Knob one increment to display Figure 1-
6.Press the INSERT PPOS
Softkey and the aircraft???s present position will be inserted before the selected identifier as seen in Figure
Inserting the aircraft???s present position in the flight plan is just like inserting any other way- point in the flight plan except the position continually updates.
Note the ground speed and fuel flow values shown in Figure 1- 159 indicate actual values by being displayed in white. Fuel flow is taken from a fuel flow monitor and GPS ground speed is being used.
7. If desired, press the
CHANGE FIELDS Softkey to change the data columns as discussed previously to view
other calculated data for the destination.
Figure
Figure
Figure
1 Section
Operation Basic
8. If desired, both the ground speed (GNDSPD) and fuel flow (FFLOW) can be changed to a user defined number to view various ???what if??? sce- narios.

Basic Operation
Section 1
Flight Plan Operation
9. To change the ground speed as in Figure
10. With the cursor over the GNDSPD value, press the USE ACTUAL Softkey to return the ground speed to the actual GPS ground speed as shown in Figure
Fuel flow (FFLOW) values can be changed in the same manner as ground speed. Fuel flow and ground speed can
also be changed in conjunction with one another to work out different scenarios.
NOTE: If the KMD 250 is not interfaced with a functioning fuel flow mon- itor, the fuel values will always be displayed in yellow.
11. Press the DONE Softkey to return to the FLIGHT PLAN INDEX Page. The flight plan created in this process can now be deleted if no longer needed.

System Setup
SYSTEM SETUP
This portion of the manual is designed to provide step by step instructions for the setup of the KMD 250. Note that not all features discussed here are available in all installations. If an item is not available it will appear ???grayed out??? and will not be selectable.
Figure
MAP SETUP
1. Press the MENU Key to display Figure
Orientation: Set either in Track Up, North Up or Heading Up.
Extended TRK: Turns on or off the extended track line, which is drawn ahead of the present position in the direction of the present track.
Range Rings: Turns range rings on or off on the map.
Airport Settings: Selectable airport filtering for display on the map.
Min Rwy Len: Minimum Runway Length allows the display of airports on the map based on minimum runway length. This can be set to Any or 1000 ft to 5000 ft in 100 foot increments.
Surface: Allows the display of airports on the map based on Any sur- face or Hard surface only.
Label: May be set to display the airport on the map with ICAO identifier, the airport Name or City.
All settings on MAP SETTINGS GROUP 1 affect all map displays for all functions. Settings on GROUP 2 through 6 affects only the displays for the currently viewed function.
1 Section
Operation Basic
Basic Operation
Section 1
System Setup
2. Press the NEXT GROUP Softkey to display the AVIATI- ON ICON GROUP Page as in Figure
VFR Map aviation related icons are shown with corresponding definitions.
The next series of menus allows customizing of the Map Displays to show the amount of data desired for ease of read- ability at various display ranges.
The maximum range settings at which the ICON, LINE and/or TEXT is displayed on the map may be selected for each category. Use the Joystick to select the desired field and turn the Rotary Knob to change the setting.
3. Press the NEXT GROUP Softkey to display the AVIATI- ON LINE GROUP Page as in Figure
VFR Map aviation related lines are shown with corresponding definitions.
The database filters airspace first by class, then by type. If the class is not known and the type does not fit into one of the categories, it will be displayed as Unknown.
Other SUA types are Radar
Area, Alert, Caution, Training, Warning or Unspecified.
Again, use the Joystick to select the desired field and turn the Rotary Knob to change the setting.
NOTE: Class A, E, F and G airspace will not be shown in the United States, but are in the international data.
4. Press the NEXT GROUP Softkey to display the LAND ICON GROUP Page as in Figure

System Setup
VFR Map land related icons are shown with corresponding definitions.
As before, use the Joystick to select the desired field and turn the Rotary Knob to change the setting.
5. Press the NEXT GROUP Softkey to display the second
LAND LINE GROUP Page as in Figure
Again, use the Joystick to select the desired field and turn the Rotary Knob to change the setting.
6. Press the NEXT GROUP or OVLY SETUP Softkey to display the OVERLAYS GROUP Page as in Figure 1- 168.
Overlay icons are shown with corresponding definitions.
Figure
Figure
1 Section
Operation Basic
NOTE: Some functions may not
be available in certain installations. Unavailable functions will appear gray with dashes for values and will not be selectable.
If Stormscope, a Traffic Avoidance System and/or Flight Information Services have been installed, control of how the data is displayed (or not displayed) on the map is accomplished on this page. The maximum range settings at which the ICON and TEXT is displayed on the map may be selected for each function. Use the Joystick to select the desired field and turn the Rotary Knob to change the setting.
7. Press the DONE Softkey when Map Setup is complete.
Basic Operation
Section 1
System Setup
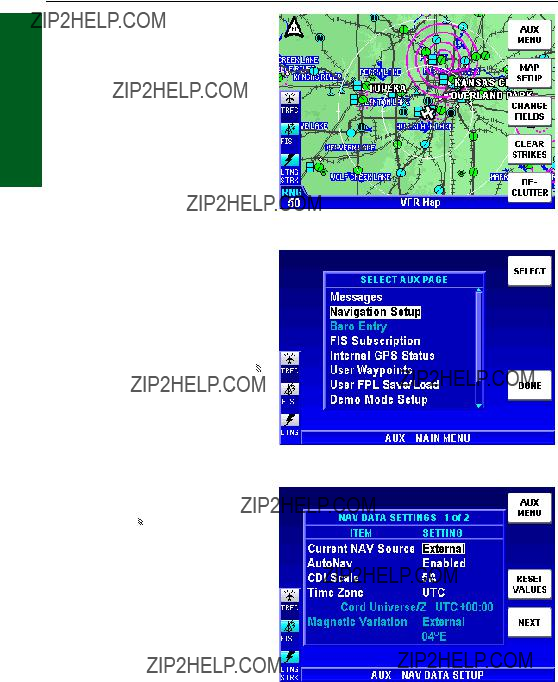
NAVIGATION SETUP
1.Press the MENU Key to display Figure
2.Press the AUX MENU Softkey to display Figure 1-
3.Use the Joystick to select
Navigation Setup then press
the SELECT Softkey to display the first the NAV DATA SET- TINGS Page as in Figure 1- 171.
4. Use the Joystick to select the desired item and use the Rotary Knob to change the value.
Current NAV Source  :
:
Used to select the naviga- tion source in units with the optional internal GPS. Can be set to Internal GPS or
External. Options are depen- dent on installation configura- tion.
AutoNav  : If the KMD 250 is installed to function with an external GPS
source, such as a KLN 94, and KMD 250 has the optional internal GPS, the system is capable of automatically switching from the external GPS source to the internal GPS when situations dictate. When AutoNav is enabled, this
allows the system to prompt the user for a change in navigation source if valid position data is not being received from the external source. The flight plan will be copied from the external navigation source to the KMD 250 active flight plan. Navigation displayed will be limited to VFR only as annunciated by INTERNAL VFR GPS. Options are dependent on instal- lation configuration.
CDI Scale: Used to set the sensitivity of the Course Deviation Indicator when being viewed in a Data Field. Options are 5nm, 1nm or .3nm.

System Setup
NOTE: The 0.3 nm scale could result in overly active roll performance depending upon the particular autopilot installation. Use of the 1 nm or 5 nm CDI scale may be preferred during autopilot operation.
Time Zone: Selection determines the time displayed in any time related Data Field. The next line gives a description of the abbreviation and the offset from UTC time. When Local Time is selected the UTC offset field will be an entry field to input the local offset value. The following is a list of the available Time Zone options:
Magnetic Variation: The magnetic variation used for navigation calcula- tions. Options are Auto, Manual or External depending on installation configuration. When Manual is selected, the offset can be entered using the Rotary Knob.
5. Press the NEXT Softkey to display the second NAV DATA SETTINGS Page as in Figure
Position Format: Determines whether position information is displayed with reference to Lat/Lon (Latitude/Longitude), UTM (Universal Transverse Mercator) or OSGB (Ordinance Survey of Great Britain) in the PPOS Data Field. This will also
affect the PBRG and PDIS data when the Joystick Pointer is active.
Note: OSGB is only defined for Great Britain.
1 Section
Operation Basic

Basic Operation
Section 1
System Setup
Near Pos Format: Determines parameters used to display the near position reporting when viewed in a Data Field. Can be set to
Airports+VORs, VORs only or All data.
Turn Anticipation: When turned on, turn guidance to a new course is provided along an arc.
SUA Alerting: When turned on, a Special Use Airspace Alert Message will be annunciated when the aircraft is approximately 10 minutes or two miles from entering the airspace.
SUA Alerting Buffer: Defines the altitude boundary for the Special Use Airspace at which the Alert Message is annunciated. Can be set from 300 feet to 59900 feet in 100 foot increments.
Default/WPT Char.: Defines the default first character displayed in way- point data entry fields. Use the Rotary Knob to enter the desired alphanumeric character.
6. Press the AUX MENU Softkey to return to the first NAV DATA SET- TINGS Page. Now press the DONE Softkey to exit the setup.
DEMO MODE & SETUP
A great way to become familiar with all the features of the KMD 250 is to use it???s built in Demo Mode. When the KMD 250 is in the Demo Mode, it performs as if it is receiving adequate sensor signals to use the various functions. Units without the optional internal GPS, a
In order for the KMD 250 to function in the Demo Mode it must be used in conjunction with a product such as the Commander 2900 from Lone Star Aviation.
For more information on the Commander
Lone Star Aviation, Inc. 604 Wisteria Street Mansfield, TX 76063 Phone: (682)
The KMD 250 is automatically put into Demo Mode when it is used with a Commander 2900. In addition, an authorized Honeywell Service Center may also arrange for you to put the KMD 250 into Demo Mode by grounding the appropriate pin at the back of the unit while it is removed from the aircraft and is connected to an appropriate power supply. The KMD 250 must never be put into the Demo Mode when it is installed in the aircraft.
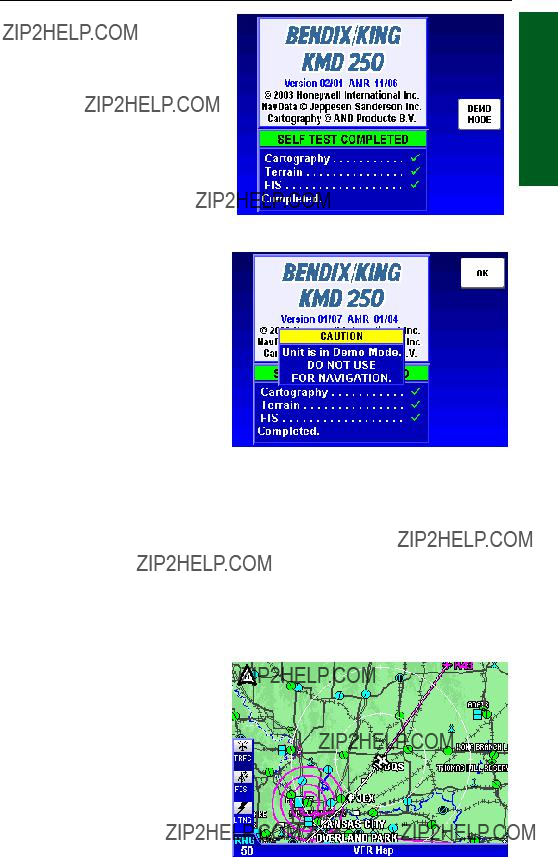
After
Press the OK Softkey to acknowledge the next caution displays as in previous discus- sions.
System Setup
1 Section
Operation Basic
DEMO MODE FOR
VERSIONS
If KMD 250 does not have the optional internal GPS it will begin navigating a simulated flight plan that is stored on each of the three different types of data cards as shown in Table
In this example the AMR data- base is installed, therefore,
Figure
Table
The system defaults for Demo Mode will automatically start the demo at the beginning way- point for the flight plan stored in the data card. The simulated flight will be at an altitude of 2000 feet and groundspeed will be 135 knots. Track and heading will be equal.
Figure

Basic Operation
Section 1
System Setup
DEMO MODE FOR GPS
VERSIONS 
If the KMD 250 contains the optional internal GPS, way- points and flight plans may be created, stored and navigated in the Demo Mode. After entering Demo Mode refer to previous discussions for opera- tion of the KMD 250.
CHANGING DEMO MODE
SETTINGS
To modify the Demo Mode set- tings, perform the following steps:
1.Press the MENU Key to dis- play the AUX MENU Softkey as in Figure
2.Press the AUX MENU
Softkey to display Figure 1- 177. If necessary, use the Joystick to highlight Demo Mode Setup as shown.
3. Press the SELECT Softkey to display Figure
desired field. Turn the Rotary Knob to enter the desired values.
In versions containing the optional internal GPS, Mode is not available and all fields are selectable and editable.
4. When finished making changes, press the RESTART DEMO Softkey to begin the demo using the new parameters.

System Setup
SOFTWARE VERSIONS
The current unit software ver- sion may be checked by per- forming the following steps:
1.Press the MENU Key to dis- play the AUX MENU Softkey as in Figure
2.Press the AUX MENU Softkey to display Figure 1-
179.If necessary, use the Joystick to highlight Software Versions as shown.
3.Press the SELECT Softkey to display Figure
Figure

System Setup
Basic Operation
Section 1
DATABASE VERSIONS
The current database version may be checked by performing the following steps:
1.Press the MENU Key to dis- play the AUX MENU Softkey as in Figure
2.Press the AUX MENU Softkey to display Figure
3.Press the SELECT Softkey to display Figure
NOTE: For a VDL installation, if a new datacard is not installed before the date shown under SUBSCRIPTION DATA,, the KMD 250 will no longer receive FIS subscriptions even if the FIS subscriptions are cur- rent. A new datacard is only required on initial XM installa- tions, not for later database updates.
Figure
Figure
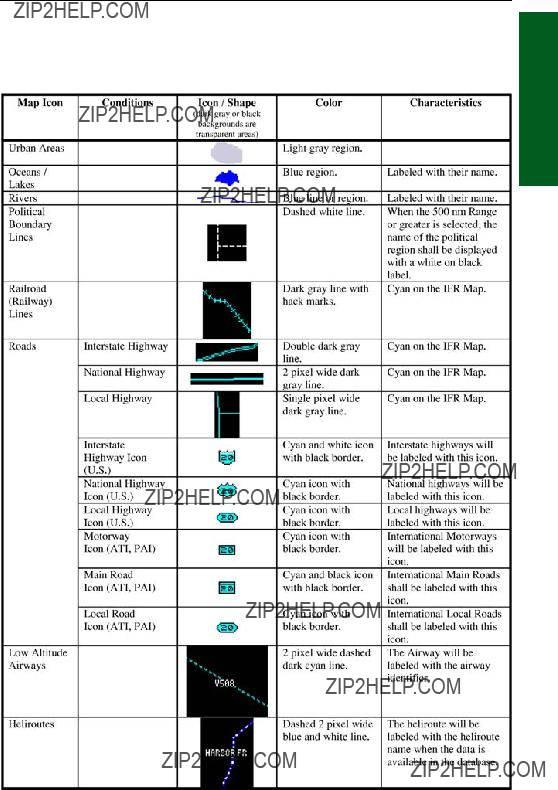
Map Display Icons
MAP DISPLAY ICONS
The following table shows the map display icons and their meanings:
1 Section
Operation Basic
Map Display Icons
Basic Operation
Section 1

Map Display Icons
1 Section
Operation Basic

Map Display Icons
Basic Operation
Section 1

Datacards
DATACARDS
DATA AREAS
Honeywell produces three datacards based on the ICAO/ARINC geo- graphic areas for the KMD 250 that cover the entire world. Each card for each area contains the operating software, the appropriate Jeppesen aeronautical data, cartographic data and topological data to a high reso- lution. Also included is a low resolution map of the rest of the world.
The ten ICAO/ARINC areas along with their three letter identifiers are:
These areas are combined to produce three data cards covering the entire world that contain the following data:
 AMR Americas - comprising CAN, USA, LAM, SAM

 ATI Atlantic International - comprising EUR, AFR, EEU, MES

 PAI Pacific International - comprising PAC, SPA, EEU, MES
1 Section
Operation Basic
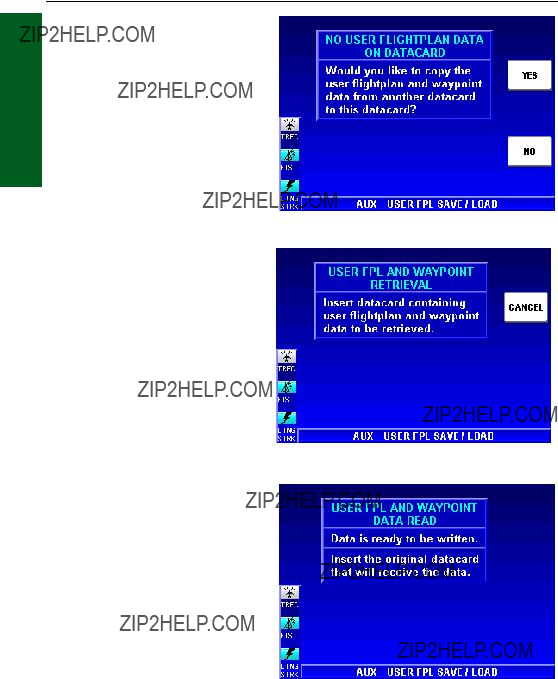
Basic Operation
Section 1
Datacards
INSERTING A NEW
DATACARD
Each KMD 250 Database cycle will result in the necessity to load a new database when using the database subscripti- on service. This is done by inserting a new datacard.
NOTE: Since all user way- points and flight plans are stored on the datacard, it will be necessary to transfer this data to the new datacard.
The following displays depict those seen on a KMD 250 con- taining the internal GPS.
To change the datacard follow these steps:
1.Turn off the KMD 250.
2.Push in the datacard until it
clicks, then release. The data- card should now slide straight out.
3.With the new card facing upward, as indicated on it???s label, insert the new datacard until it clicks. The new data- card is now locked in place.
4.Turn the unit on and, if necessary, wait for the new software to load.
5. Figure
waypoints stored on the previous datacard to be moved to the new data- card. Press the YES Softkey to move stored data. Other wise press the NO Softkey.
6.After pressing the YES Softkey, Figure
7.When Figure

8. The flight plans and way- points are now written to the new card as shown in Figure 1- 186. Press the OK Softkey.
NOTE: In units that do not contain the internal GPS, refer- ences to flight plans will not be displayed. For example the title of the window in Figure 1- 186 will be ???USER WAYPOINT
DATA STORED???.
Figure
TRANSFERRING DATA
BETWEEN DATACARDS
User stored data such as flight plans and waypoints can be moved between datacards.
The following displays depict those seen on a KMD 250 con- taining the internal GPS.
Datacards
1 Section
Operation Basic
STORE CURRENT USER
DATA ON ANOTHER DATA-
CARD
To move from one datacard to another, perform the following steps:
1.Press the MENU Key.
2.Press the AUX MENU Softkey to display Figure 1-
187.Use the Joystick to high- light User FPL Save/Load as shown.
Figure
Figure
3.Press the SELECT Softkey to display Figure
4.If necessary, use the Joystick to highlight Store current user data on another datacard.
5.Press the SELECT Softkey.

Datacards
Basic Operation
Section 1
6.When Figure
7.After the datacard is inserted, the data will be copied and Figure
8.
NOTE: In units that do not con- tain the internal GPS, refer- ences to flight plans will not be displayed. For example the title of the window in Figure 1- 190 will be ???USER WAYPOINT
DATA STORED???.
RETRIEVE USER DATA
FROM ANOTHER DATA-
CARD
To move from one datacard to another, perform the following steps:
1.Press the MENU Key.
2.Press the AUX MENU Softkey to display Figure 1-
191.Use the Joystick to high- light User FPL Save/Load as shown.
Figure
Figure
Figure

Datacards
3.Press the SELECT Softkey to display Figure 1-
4.If necessary, use the Joystick to highlight Read user data from another datacard.
5.Press the SELECT Softkey.
6.When Figure
7.After the datacard is inserted, the data will be read and Figure
8.
9.Figure
10.Press the OK Softkey to overwrite.
Figure
Figure
1 Section
Operation Basic
Figure

Basic Operation
Section 1
Datacards
11.Figure
12.Press the OK Softkey to continue.
NOTE: In units that do not con- tain the internal GPS, refer- ences to flight plans will not be displayed. For example the title
of the window in Figure
POINT DATA???.
DATABASE INFORMATION
Due to Honeywell???s policy of continual development and routine data- base updates, new VDL datacards will become available every 28 days. As a registered owner of a KMD 250, you will be offered a 1/3/6/12 monthly datacard subscription.
DATABASE CYCLE INFORMATION
Keeping the database current in the KMD 250 is the user???s responsibility. Honeywell maintains its VDL databases to be current at all times to the latest Jeppesen
For VDL database subscriptions and FIS subscriptions, contact Wingman Services at the following numbers:
(913)
(913)
Visit Wingman Services at www.bendixking.com
For XM subscriptions, contact XM Radio at

Introduction
SECTION 2
FIS VDL OR XM OPERATION
INTRODUCTION
CONCEPT OF OPERATION
The Flight Information Services (FIS) system supplies
FIS is not intended to replace voice radio services. Voice communication of weather and meteorological information, in accordance with FAA operating rules, is still required.
This diagram illustrates how FIS VDL data is received in the aircraft.
2 Section
Operation FIS
Introduction
See our website at www.bendixking.com for VDL network status and coverage. Continuous coverage of most of the continental US is possible at altitudes as low as 5,000 ft. AGL, except for regions of precipitous ter- rain. As with all VHF communications, the
FIS Operation
Section 2
The following diagram illustrates how XM Wx data is received in the air- craft.
The XM Satellite Radio weather system provides continuous coverage down to ground level over the entire continental United States. A good view of the southern horizon must be available in order to receive at least one of the two satellites.

Introduction
To receive FIS WX products, an aircraft must be equipped with a com- patible VDL receiver (KDR 510) or XM receiver (KDR 610), dedicated VHF antenna or satellite antenna, and appropriate display (KMD 250). FIS VDL uses a
Both basic
2 Section
Operation FIS
The VDL ground station network repetitively broadcasts the same product until either newer data is available or the information has exceeded a
NOTE: Due to inherent delays, areas of coverage and relative age and availability of the data that can be experienced, weather data cannot be viewed as an absolute depiction of conditions at a specific location.
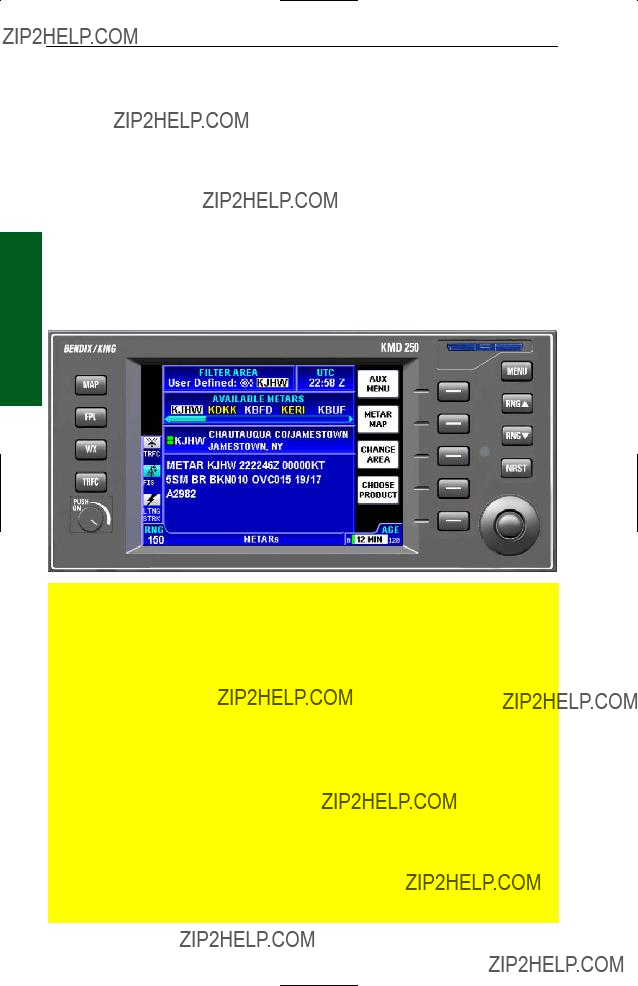
FIS Operation
Section 2
Introduction
EQUIPMENT OVERVIEW
The Datalink Weather Function of the Bendix/King KMD 250 allows for the display and control of textual and graphical weather information received from the Bendix/King KDR 510 VDL Receiver or the KDR 610 XM satellite receiver. The choice of VDL or XM receiver is made during installation. A single display can display only VDL weather or only XM weather, not both.
This section describes the operation of the KMD 250 display and dis- cusses the proper use of the displayed data for strategic weather plan- ning.
The Bendix/King KMD 250 is shown below with the Text METAR Page selected.
CAUTION
Datalink weather information is to be used as a strategic planning tool for pilot decisions on avoiding inclement weather areas that are beyond visual range or where poor visibility precludes visual acquisition of inclement weather. Datalink weather information may be used as follows:
a.To aid the pilot in situational awareness of hazardous meteo- rological conditions.
b.As a cue to the pilot to communicate with the ATC controller, AFSS specialist, Operator Dispatch, or Airline Operations Control Center (AOCC) to get further information about the current meteo- rological conditions. In no case should the pilot take any evasive action based solely upon the datalink weather display.
The datalink weather information is intended for assistance in strategic flight planning purposes only and lacks sufficient resolu- tion and updating necessary for tactical maneuvering.
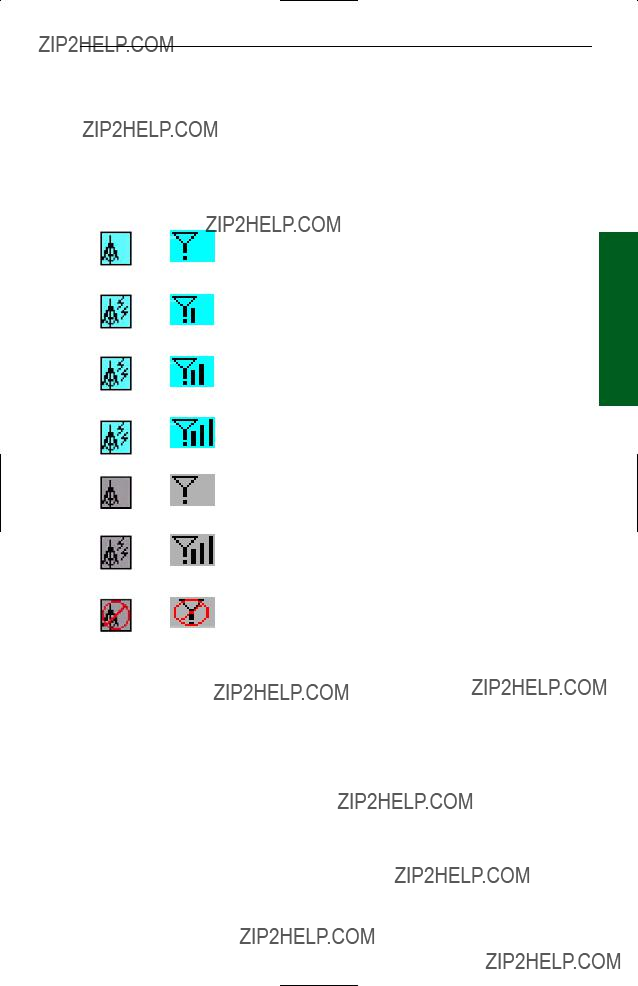
Introduction
DATALINK WEATHER FUNCTION STATUS ICONS
The Datalink Weather Function Status Icons are located in the lower left of the display. They are used to indicate whether or not the KMD 250 is currently receiving and/or displaying weather information. The following table shows the various icons and their meanings:
2 Section
Operation FIS

Introduction
FIS Operation
Section 2
Intentionally left blank

Basic Service Weather Products
BASIC SERVICE WEATHER PRODUCTS
The following is a discussion of weather products offered with the basic
All basic and
METAR
A METAR (Aviation Routine Weather Report) describes the specific weather conditions at a particular airport at a given time. The elements of a METAR are in order as follows:
1.Type of report
2.ICAO station identifier
3.Date and time of issue
4.Modifier (AUTO if automated report or COR if corrected observation)
5.Wind
6.Visibility
7.Runway visual range (as required)
8.Weather phenomena
9.Sky condition
10.Temperature/dew point group
11.Altimeter
12.Remarks (as required)
METARs available within the selected range of the selected area will be displayed up to a maximum of 25 reports. These reports are displayed in an encoded textual format. METARs displayed graphically on the map are offered through a subscription service.
NOTE: When a specific element of METAR data is not available, it is omitted from the report. The user must know the sequence of data to recognize omissions. METAR observations older than 120 minutes will be discarded.
See the section on Understanding Textual Aviation Weather Reports, for instructions on decoding textual METARs.
2 Section
Operation FIS

Basic Service Weather Products
SPECI
A SPECI (Aviation Selected Special Weather Report) is related to the METAR. SPECIs are issued when certain specific conditions or events have been observed at a particular location, usually an airport. A SPECI will contain the same elements as a METAR and will generally be issued for the following reasons:
TAF
A TAF (Terminal Area Forecast) is a statement of expected meteorolog- ical conditions at an airport during a specified period of time. Many aspects of the TAF are the same as a METAR. Abbreviations are the same as in a METAR with addition of a few more discussed later. Many
Rev 4 Aug/20072-8KMD 250 Pilot's Guide

Basic Service Weather Products
of the data elements are formatted as those in a METAR report. A TAF will contain elements in the following order:
1.Type of report
2.ICAO station identifier
3.Date and time of issue
4.Date and time valid
5.Wind
6.Visibility
7.Weather phenomena
8.Sky conditions
9.Wind shear (as required)
10.Forecast weather change indicator
TAFs available within the selected range of the selected area will be dis- played up to a maximum of 25 reports. These reports are displayed in an encoded textual format.
NOTE: TAFs older than the forecast validity period are discarded. Amended or corrected TAFs generated within the issuance period are provided as soon as they are available, and the previous outdated TAF is no longer transmitted.
See the section on Understanding Textual Aviation Weather Reports, for instructions on decoding textual TAFs.
2 Section
Operation FIS
PIREP (VDL ONLY)
A PIREP (Pilot Weather Report) is an observation of conditions at a spe- cific location or along a specific route. These conditions are reported by pilots when communications are established with ground facilities such EFAS, AFSS/FSS, ARTCC or ATC. Abbreviations are the same as in a METAR. Pilots are encouraged to promptly volunteer these reports. A PIREP will contain elements in the following order:
1.Type of message (urgent or routine)
2.Location in relation to an airport or VHF NAVAID
3.Time observed
4.Flight Level (may not always be present)
5.Type of aircraft (may not always be present)
6.Sky cover (may not always be present)
7.Weather conditions (may not always be present)
8.Temperature (may not always be present)
9.Wind direction and speed (may not always be present)

FIS Operation
Section 2
Basic Service Weather Products
10.Turbulence (may not always be present)
11.Icing (may not always be present)
12.Remarks (may not always be present)
PIREPs available within the selected range of the selected area will be displayed up to a maximum of 25 reports. These reports are displayed in an encoded textual format.
NOTE: PIREPs older than 120 minutes are discarded.
See the section on Understanding Textual Aviation Weather Reports, for instructions on decoding textual PIREPs.
AIRMET
An AIRMET (Airman???s Meteorological Information) is an advisory of significant weather that could be hazardous to single engine, light aircraft and VFR pilots. However, parameters are such that the phenomena does not require issuance of a SIGMET. AIRMETs address details regarding IFR, extensive mountain obscuration, turbulence, strong sur- face winds, icing and freezing levels. AIRMETs are considered wide- spread because they must either be affecting or forecast to affect an area at least 3,000 square miles. However, during the forecast period, the actual affected area may be much smaller. AIRMETs are issued every six hours and the maximum forecast period is 6 hours. An AIRMET will contain elements in the following order:
1.Forecast Area
2.Report Type
3.Date and time issued
4.Report designation and reason for issuance
5.Validity period
6.Area of coverage
7.Weather phenomenon details.
These reports are displayed in an encoded textual format.
NOTE: AIRMETs may be issued up to 15 minutes prior to the start of the validity period. The system will display the data age as zero until the start of the validity period. AIRMETs older than 360 minutes are discarded. Amended or corrected AIRMETs generated within the issuance period are provided as soon as they are available, and the previous outdated AIRMET is no longer transmitted.
When an AIRMET is cancelled, neither the original report nor the cance- lation message can be displayed.

Basic Service Weather Products
See the section on Understanding Textual Aviation Weather Reports, for instructions on decoding textual AIRMETs.
SIGMET
A SIGMET (Significant Meteorological Information) is an advisory of non- convective weather that is potentially hazardous to all aircraft. SIGMETs address details regarding severe icing not associated with thunder- storms, severe or extreme turbulence not associated with thunderstorms, dust or sand storms lowering visibility to less than 3 miles, volcanic ash. SIGMETs are considered widespread because they must either be affecting or forecast to affect an area at least 3,000 square miles. However, during the forecast period, the actual affected area may be much smaller. SIGMETs are issued as needed and the maximum fore- cast period is 4 hours, except for 6 hours for conditions associated with hurricanes. A SIGMET will contain elements in the following order:
1.Forecast Area
2.Report Type
3.Date and time issued
4.Report designation and reason for issuance
5.Validity period
6.Area of coverage
7.Location of weather phenomenon
8.Weather phenomenon details.
These reports are displayed in an encoded textual format.
NOTE: SIGMETs older than the forecast period are discarded. Amended or corrected SIGMETs generated within the issuance period are pro- vided as soon as they are available, and the previous outdated SIGMET is no longer transmitted.
When an SIGMET is cancelled, neither the original report nor the cance- lation message can be displayed.
See the section on Understanding Textual Aviation Weather Reports, for instructions on decoding textual SIGMETs.
2 Section
Operation FIS
CONVECTIVE SIGMET
A Convective SIGMET (Convective Significant Meteorological Information) is an advisory of convective weather that the forecaster believes hazardous to all aircraft. Convective SIGMETs address details regarding severe thunderstorms, embedded thunderstorms, a line of
FIS Operation
Section 2
Basic Service Weather Products
thunderstorms, or thunderstorms producing heavy precipitation affecting an area 40 percent or more of an area at least 3,000 square miles. Convective SIGMETs are issued hourly with a maximum forecast period of 2 hours. A Convective SIGMET will contain elements in the following order:
1.Region Identifier and issue date and time
2.Report designator
3.Validity period
4.Area of coverage
5.Location details
6.Weather phenomena details
NOTE: Convective SIGMETs older than the forecast period are dis- carded. Amended or corrected Convective SIGMETs generated within the issuance period are provided as soon as they are available, and the previous outdated Convective SIGMET is no longer transmitted.
See the section on Understanding Textual Aviation Weather Reports, for instructions on decoding textual Convective SIGMETs.
ALERT WEATHER WATCHES (VDL ONLY)
Alert Weather Watches (AWW) are Alert Severe Weather Watch Bulletins that describe areas of possible severe thunderstorm or tornado development. These are watches, not warnings; and are issued as needed. Severe weather may not actually develop. An Alert Weather Watch will contain elements in the following order:
1.Report designation and date and time of issuance
2.Watch number, reason for issuance, area of coverage and validity period.
3.Watch coordinates
4.Forecast
NOTE: Alert Weather Watches older than the forecast period are dis- carded.
See the section on Understanding Textual Aviation Weather Reports, for instructions on decoding textual Alert Weather Watches.

Value Added Service Weather Products
VALUE ADDED SERVICE WEATHER PRODUCTS
The following is a discussion of weather products offered with the value added VDL subscription service. Accessing and navigating these ser- vices will be discussed in detail later in this section.
All basic and
NEXRAD
Next Generation Radar (NEXRAD) is formally designated
FIS VDL provides NEXRAD base reflectivity and XM WX provides NEXRAD composite reflectivity. Each NEXRAD ground radar site scan is composed of separate beam scans at several elevation angles for 360 degrees around the site. Base reflectivity is the highest precipita- tion echo (reflectivity) contained in the lowest NEXRAD radar elevation angle scan (5 degrees). Composite reflectivity provides the highest precipitation echoes within all of the elevation scan angles. The NEXRAD base or composite reflectivity modes provide a display of echo intensity depicted by colors. NEXRAD information is good for identifying precipitation intensity.
This NEXRAD base reflectivity data product content consists of reflec- tivity measured at the minimum scan angle of 0.5 degree elevation.
CAUTION: NEXRAD data must be used for strategic planning pur- poses only. Due to inherent delays and relative age of the data that can be experienced, NEXRAD data cannot be used for tactical avoidance of weather.
NEXRAD reflectivity images older than 75 minutes are dis- carded and no longer dis- played.
Figure
The display range may be changed to zoom in on a spe-
cific area to get a more detailed weather picture, or zoom out to display a wider range.
2 Section
Operation FIS

Value Added Service Weather Products
NEXRAD ABNORMALITIES
The following is a list of NEXRAD abnormalities that may be experi- enced:
Earth's surface resulting in Anomalous Propagation (AP) echoes on the radar display.

Value Added Service Weather Products
10.Echoes from migrating birds, bats, and insects will be displayed as circular patterns of level 1 reflectivity centered near NEXRAD sites.
11.Significant variation in humidity with altitude can cause reflections from the Earth's surface. These reflections are also displayed as large circular or oval areas of uniform low intensity.
12.Differences will be noted between the base reflectivity (VDL) and composite (XM) products. The base reflectivity product displays the lower extent of cloud masses, so the extent of water droplets appears to be less. The composite product provides more airborne water reflection seen at higher angles as viewed from the NEXRAD ground sites, so higher level features of the convective activity will be given. For example, the ???blowout??? portion of thunderstorms (the anvil portion) containing high altitude ice particles is often depicted as light precipitation and might be confused for lower altitude light precipitation. Either base or composite product provides an accurate, but somewhat time delayed depiction of high levels of precipitation for fully developed or late stage thunder- storms.
NEXRAD LIMITATIONS
2 Section
Operation FIS
The following are limitations on the use of NEXRAD data:
1.NEXRAD does not provide sufficient information to determine cloud layers or precipitation characteristics (frozen vs. liquid, hail vs. rain, etc.), nor does it provide information on turbulence, only the amount of reflected energy from the precipitation.
2.The displayed NEXRAD product does not provide sufficient detail to infer future weather trends. Due to delays involved in product creation and transmittal, the pilot should always review the age bar to determine
information currency.
3. Due to NEXRAD site loca- tion limitations, terrestrial block- ages and outages, NEXRAD coverage gaps exist. Coverage gaps are displayed as a cross hatched pattern as shown in Figure
Coverage Gap
Figure
4. The resolution of NEXRAD
VDL data is 4 kilometers (km). Thus, when zoomed in on the display, each square block is 4 km in diameter. The intensity level reflected by the square will be the highest level sampled within the 4 km area.
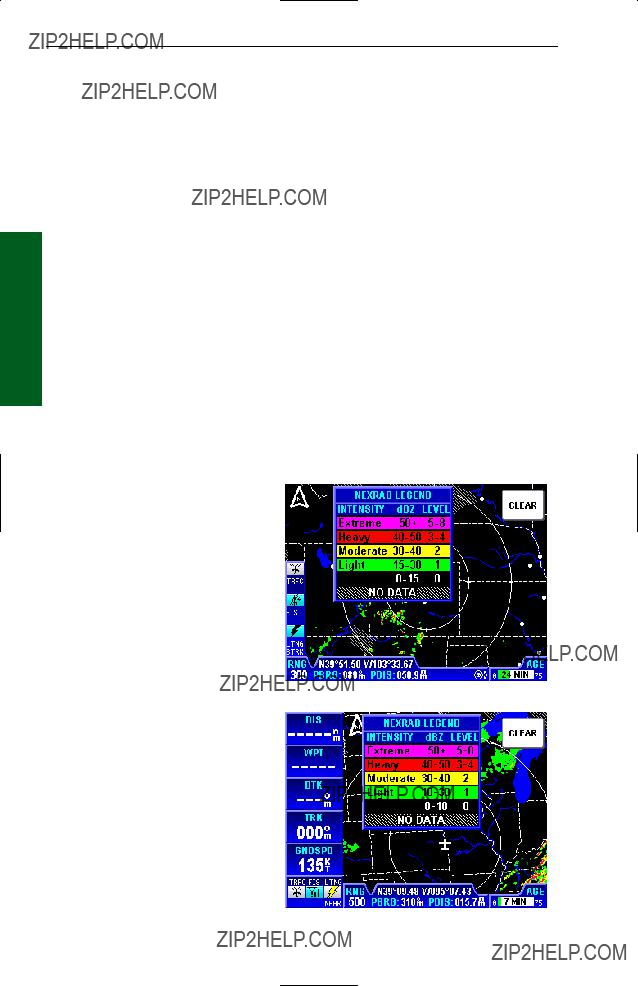
Value Added Service Weather Products
5. The resolution of NEXRAD XM data is 2 km. Thus, when zoomed in on the display, each square block is 2 km on a side. The intensity level reflected by the square will be the highest level sampled within the 2 km area.
INTENSITY
FIS Operation
Section 2
Precipitation intensity is depicted using colors as follows:
The NEXRAD dBz levels, descriptions and colors are consistent with FAA guidelines.
Moving the joystick and pressing the LEGEND Softkey will display the NEXRAD legend as shown in Figure
The column labeled dBz is a measure of the radar echo intensity.
The strength of a radar return signal typically varies as a function of distance (i.e., weaker from distant targets, stronger from those nearby) and the object size.
Many weather sources avail- able on the internet use color coding that is different than the KMD 250 color coding. The dBz and intensity level can be used to compare intensity levels between dif- ferent sources of NEXRAD information since many internet weather providers will include a legend with dBz
Figure

Value Added Service Weather Products
GRAPHICAL METAR
The graphical METAR is derived from the most currently received tex- tual METAR or SPECI data from reporting sites. This is displayed on a map background to enhance
situational awareness as shown on Figure
The graphical METAR icon is gray when the textual METAR or SPECI report exceeds 75 minutes (AGED), but is less than the textual METAR
CAUTION: Graphical METAR data must be used for strategic plan- ning purposes only. Due to inherent delays, areas of coverage and relative age and availability of the data that can be experi- enced, Graphical METAR data cannot be viewed as an absolute depiction of conditions at a specific location.
Graphical METARs are shown using two color coded boxes, one indi- cating ceiling (upper box), the other visibility (lower box). Next to the boxes is the ICAO station identifier for the airport to which the METAR pertains. Color coding for the boxes is specified in the table below:
2 Section
Operation FIS

FIS Operation
Section 2
Value Added Service Weather Products
Moving the joystick pointer to an area that will not highlight a specific report then pressing the LEGEND Softkey will dis- play the graphical METAR legend as shown in Figure
Figure
GRAPHICAL AIRMET
The graphical AIRMET is derived from the location description (if pro- vided) in the textual AIRMET and displayed as a boundary box with the appropriate color for the condition as shown in the legend (for a description, see AIRMETs in the Basic Weather Services section). The ???IN??? box in the legend indicates the current aircraft position is within the corresponding forecast condition. The boundaries are displayed on a map background to enhance situational awareness as shown on Figure
NOTE: If no location description is provided in the textual AIRMET the AIRMET cannot be depicted graphically. These AIRMETs are denoted by displaying the AIRMET identifier in green within the textual AIRMET.
Figure

Value Added Service Weather Products
GRAPHICAL SIGMET
The graphical SIGMET is derived from the location description in the textual SIGMET and displayed as a boundary box with the appropriate color for the condition (for a description, see SIGMETs in the Basic Weather Services section). This is displayed on a map background to enhance situational awareness as shown on Figure
2 Section
Operation FIS
Figure
GRAPHICAL CONVECTIVE SIGMET
The graphical Convective SIGMET is derived from the location descrip- tion in the textual Convective SIGMET and displayed as a yellow boundary box (for a description, see CONVECTIVE SIGMETs in the Basic Weather Services section). The ???IN??? box in the legend indicates the current aircraft position is within the corresponding forecast condi- tion. The boundaries are displayed on a map background to enhance situational awareness as shown on Figure
Figure

Value Added Service Weather Products
GRAPHICAL ALERT WEATHER WATCHES (VDL ONLY)
The graphical Alert Weather Watches (AWWs) are derived from the location description in the textual AWW and displayed as a boundary box with the appropriate color for the condition as shown in the legend (for a description, see ALERT WEATHER WATCHES in the Basic Weather Services section). The ???IN??? box in the legend indicates the current aircraft position is within the corresponding forecast condition. The boundaries are displayed on a map background to enhance situa- tional awareness as shown on Figure
FIS Operation
Section 2
Figure

FIS Subscriptions
SUBSCRIPTIONS
A current subscription (VDL or XM) and a current data card (VDL only) are required to receive services. Subscriptions are used to gain access to services. Some VDL services are offered at no cost and others are fee based. All XM weather services are provided on a fee basis. All services not identified as VDL only are available with an XM subscription.
VDL SUBSCRIPTIONS
Obtaining a VDL subscription can be performed via website, (http://www.bendixking.com) select Wingman Services, Data Link Weather, or alternatively by contacting Wingman Services at
NOTE: Although the basic textual products are free of charge, they still require a subscription as well as a current data card to receive the ser- vice.
To accommodate users with varying service needs (for example, during different flying seasons over the course of a year), the display unit allows storage for up to four individual subscriptions, in much the same way that a computer can support multiple user accounts with different passwords. Once entered, the display unit manages selection of the appropriate sub- scription without any operator intervention. A subscription code must be entered into the display unit whenever you add or renew a subscription.
When subscribing for a FIS VDL service package, you may specify the date when service shall commence and the duration. If you subscribe to multiple packages, the start date and duration of each can differ (if desired). For instance, a user may select the free text weather package for an entire year and also choose a graphical weather package for part of the year.
During the subscription process, you will receive 1 to 4 subscription codes which you must enter into your display unit to permit access to all products. A subscription code is an alphanumeric sequence that permits access to the FIS VDL broadcast network in much the same way that a computer password permits access to a computer network. When you subscribe for FIS services, the online system will ask for a FIS Display ID in order to provide you with the subscription code. The FIS Display ID is a unique alphanumeric serial number associated with your display unit. This ID is obtained by viewing the FIS VDL Subscription Status page on your display unit. After obtaining the subscription code (from either
2 Section
Operation FIS
FIS Operation
Section 2
FIS Subscriptions
www.bendixking.com or via a phone call to Wingman Services), enter this code into your display unit. The subscription code tells the display the service(s) to which you have subscribed and for what period of time.
Also, the data card must be updated at least once a year for continuance of FIS subscription service. The validity period for the subscription data on the data card is shown on the FIS Caution page at power on and also on the FIS Subscription Status Page. The data card contains both sub- scription data that is needed to access FIS products as well as the latest operating software. By updating the data card at least once a year prior to the expiration date you will ensure uninterrupted FIS service and also have the latest version of software to utilize new FIS products as they become available. Note that data card updates are available every 28 days and also include the latest version of Jeppesen navigation data.
How to Subscribe to FIS VDL Services

FIS Subscriptions
SETTING UP A FIS VDL SUBSCRIPTION
At least one subscription must be set up, even to receive the
NOTE: Entering more than four subscriptions will cause previous sub- scriptions to be overwritten.
NOTE: The following details require selection of a
2 Section
Operation FIS

FIS Subscriptions
FIS Operation
Section 2
Obtain the unique ID for your system and visit the Wingman Services website on www.bendixking.com or call 1-
NOTE: For uninterrupted FIS services, the data card must be updated by the date shown in
???DATA CARD UPDATE REQUIRED BY??? field.
5.After obtaining the Subscription Code, press the ADD SUBSCR softkey to dis- play Figure
6.The Rotary Knob selects the alphanumeric character and the Joystick selects the char- acter position. Turn the Rotary Knob until the first character of the Subscription Code is dis- played in first space. Push the Joystick to the right to move to the next space to the right. Turn the Rotary Knob until the second character of the Subscription Code is displayed. Continue this sequence until the entire Subscription Code has been entered as shown in Figure
After selecting the last char- acter space of the Subscription Code the ENTER Softkey will be available.
Figure
Figure
Figure
7. After entering the last Subscription Code character, press the ENTER Softkey. The subscription should be accepted and processed as shown in Figure

FIS Subscriptions
If an incorrect code has been entered, a notification like that shown in Figure
8. After the subscription has been accepted, Figure
CHECKING FIS VDL SUB-
SCRIPTIONS
To check FIS VDL subscription validity or status perform the following steps:
1. Repeat steps 1 through 4 in the Setting Up a FIS VDL Subscription section.
Figure
Figure
2 Section
Operation FIS
2. A screen similar to Figure
The symbols that may appear in the Status column, and their meanings, are shown in Figure
Figure
NOTE: Only the validity period for subscriptions is shown on the display. To determine which products are available with each subscription, access the account on Wingman Services at www.bendixking.com.

FIS Operation
Section 2
FIS Subscriptions
XM WX SUBSCRIPTIONS
An XM subscription must be set up to receive XM WX services. This process involves accessing the XM Radio website and a
SETTING UP AN XM WX SUBSCRIPTION
NOTE: The following details require selection of an XM receiver (such as a
Setting up an XM WX subscription can be accomplished by following these steps:
1a. Retrieve the
OR
1b. Apply power to the display and receiver, select the MENU key and the AUX MENU softkey. The SELECT AUX PAGE is shown on the screen. Scroll down to FIS Subscription so it is highlighted as shown in Figure
2.Go to the website www.xmradio.com/weather to select your weather subscrip- tion package.
3.Apply power to the XM receiver, and place the receiver???s antenna where the signal can be received from the XM satellites. Make certain the antenna has a good view of the
4. With the Receiver ID and desired subscription package in hand, con- tact XM Radio at
5.Verify the activation of the receiver and the subscription validity by selecting and viewing the ???FIS Subscription Status Page??? on the KMD screen.
If for any reason the receiver was not exposed to the XM signal within the initial 24 hour broadcast period, or is not successfully authorized for some other reason, a subsequent 15 minute resend of the subscription information can be obtained. Get the receiver ID (instructions in step 1a or 1b above), go to the website http://www.xmradio.com/refresh/, and

FIS Subscriptions
follow the instructions.
CHECKING XM WX
SUBSCRIPTIONS
To check the FIS XM subscrip- tion and receiver status, apply power to the display and receiver, select the MENU key, then the AUX MENU softkey, which opens the SELECT AUX PAGE. Scroll down to FIS Subscription so it is highlighted, and finally select the SELECT
softkey, as in step 1b previ-Figure
The Application IDs are displayed along with the receiver activation and subscription status as shown in Figure
2 Section
Operation FIS

FIS Subscriptions
FIS Operation
Section 2
Intentionally left blank

Normal Operation
NORMAL OPERATION
To display the FIS pages, press the WX Function Select Key. Each press will cycle through the FIS Graphics Page, FIS Text Page and Stormscope?? (if installed).
Datalink Wx
Graphical
Products
Datalink Wx
Textual
Products
Stormscope?? *Only if Stormscope?? is installed
2 Section
Operation FIS
In the graphical weather products, each option can be selected in one of two ways. The first is using the menu as shown in the following steps:
1.Press the MENU Key to display Figure
2.Press the CHOOSE PRODUCT Softkey to display Figure
3.Using the Rotary Knob or
Joystick, scroll to the desired product and press the SELECT Softkey.
The second method of selecting options can be used for cycling through only the graphical products. If presently viewing a graphic product dis- play, simply turn the Rotary Knob. Each click will select the next graphic display.

Normal Operation
NOTE: The KMD 250 will only allow for selection and display of products for which data has been received. If a desired product is not available, it may be that the data has not yet been received or to which there is no subscription. Wx Watches and PIREPs are not available for XM WX and will not be listed
FIS Operation
Section 2
Figure
Figure

Normal Operation
NEXRAD PAGE
The following illustration describes the NEXRAD VDL display. The NEXRAD XM display is the same except the FIS Icon is different and Composite Reflectivity is shown instead of Base Reflectivity.
2
8
1
2 Section
11 10 9
1 Display Range - RNG:####.
2Function Status Icons - Displays icons representing data available and displayed.
3 North Pointer
4Aircraft Symbol - Indicates present position. Stylized airplane when heading/track input is present, a plus symbol with no heading/track.
5Range Rings - Outer ring radius is selected range, inner ring radius is one half the selected range.
6 RESET STICK Soft Label - Displayed when the Joystick is moved. 7 Precipitation - NEXRAD precipitation returns.
8 LEGEND Soft Label - Displayed when the Joystick is moved.
9Age of Data and Status Bar - The age of the data is displayed in minutes based on current time minus the NEXRAD issue time. The colored bar indicates percentage of age versus elapsed time before expiration. The bar will be green the first 50% then turn yellow. Also, note in this example that the maximum age allowed for the display of this data is 75 minutes.
10Rotary Knob Active - When displayed on the graphical weather products pages, rotating the knob will cycle through the products.
11Current Selection - Displays the name of the weather product currently being viewed.
Normal Operation
NEXRAD PAGE OPERATIONAL CONTROLS
FIS Operation
Section 2
CAUTION: NEXRAD data must only be used for strategic planning purposes. Due to inherent delays and relative age of the data that can be experienced, NEXRAD data cannot be used for tactical avoidance of weather.
WX Function Select Key - Cycles through Graphical Weather Products, Textual Weather Products and Stormscope??.
Rotary Knob - Turning the Rotary Knob cycles through the graphical NEXRAD, METAR, AIRMET, SIGMET, Convective SIGMET, Alert Weather Watches and FIS Network Status Pages.
Joystick - Moving the Joystick allows panning of the map and placement of the pointer over the desired weather activity to be viewed.
RNG???/RNG??? - Displays ZOOMING TO ### nm and advances the indicator to the next range. The upper button increases range, the lower button decreases it. The selected range is displayed in the lower left corner of the display with the outer range ring the displayed range and the inner range ring is half the displayed range.
USING THE NEXRAD PAGE
1. Press the WX Function Select Key until the FIS Graphics Page is displayed. If necessary, turn the Rotary Knob to obtain the NEXRAD Base Reflectivity display as shown in Figure
NEXRAD Base Reflectivity
(NEXRAD Composite
NOTE: If a notification such as that shown in Figure

Normal Operation
Always make note of the age of the data displayed in the bottom right corner (see Figure
If no data update has been received for 75 minutes the NEXRAD image is discarded and no longer displayed.
2. Press the RNG??? /RNG??? Key to zoom in or out on the display. The map is centered on the present position indi- cated by the symbolic aircraft.
3. To view a specific area of weather, move the joystick in the desired direction. A pointer will appear on the display (see Figure
the display the map will pan to keep up with pointer movement. Release the joystick to stop moving the pointer. Press the RNG???/RNG??? keys to zoom in or out on the pointer position.
2 Section
Operation FIS

Normal Operation
Press the RESET STICK Softkey to return to the present position dis- play. If no actions are taken for a period of 30 seconds, the display will return to the present position.
GRAPHICAL METARS PAGE
The following illustration describes the Graphical METARs display. The only difference between VDL and XM is the FIS function status icon.
FIS Operation
Section 2
2
1
6
7
8
9
12 11 10
1 Display Range - RNG:####.
2Function Status Icons - Displays icons representing data available and displayed.
3 North Pointer
4Aircraft Symbol - Indicates present position. Stylized airplane when heading/track input is present, a plus symbol with no heading/track.
5Range Rings - Outer ring radius is selected range, inner ring radius is one half the selected range.
6 RESET STICK Soft Label - Displayed when the Joystick is moved.
7Graphical METAR Icon - Ceiling indicated in top box, visibiliy in bottom box and ICAO identifier of issuing airport. Note that ICAO identifiers are not displayed on all range settings.
8MORE INFO Soft Label - Displayed when the Joystick Pointer is positioned over a METAR Icon. Pressing this Softkey will display more information.
9 LEGEND Soft Label - Displayed when the Joystick is moved.
10METAR Color Key - Colors indicating flight rules pertaining to ceiling and visibility.
11Rotary Knob Active - When displayed on the graphical weather products pages, rotating the knob will cycle through the products.
12Current Selection - Displays the name of the weather product currently being viewed.

Normal Operation
GRAPHICAL METARS PAGE OPERATIONAL CONTROLS
WX Function Select Key - Cycles through Graphical Weather Products, Textual Weather Products and Stormscope??.
Rotary Knob - Turning the Rotary Knob cycles through the graphical NEXRAD, METAR, AIRMET, SIGMET, Convective SIGMET, Alert Weather Watches and FIS Network Status Pages.
Joystick - Moving the Joystick allows panning of the map and placement of the pointer over the desired weather activity to be viewed.
RNG???/RNG??? - Displays ZOOMING TO ### nm and advances the indicator to the next range. The upper button increases range, the lower button decreases it. The selected range is displayed in the lower left corner of the display with the outer range ring the displayed range and the inner range ring is half the displayed range.
2 Section
Operation FIS
USING THE GRAPHICAL METARS PAGE
1. Press the WX Function Select Key until the FIS Graphics Page is displayed. If necessary, turn the Rotary Knob to obtain the Graphical METAR display similar to Figure
NOTE: This page will not be
accessible until a valid FIS
signal has been acquired andFigure
2.Press the RNG???/RNG??? Key to zoom in on the display. The map is centered on the present position indicated by the symbolic aircraft.
3.To view a specific METAR, move the joystick in the desired direction. A pointer will appear on the display. The distance and bearing between present position and the pointer is shown at the bottom center of the dis- play (see Figure
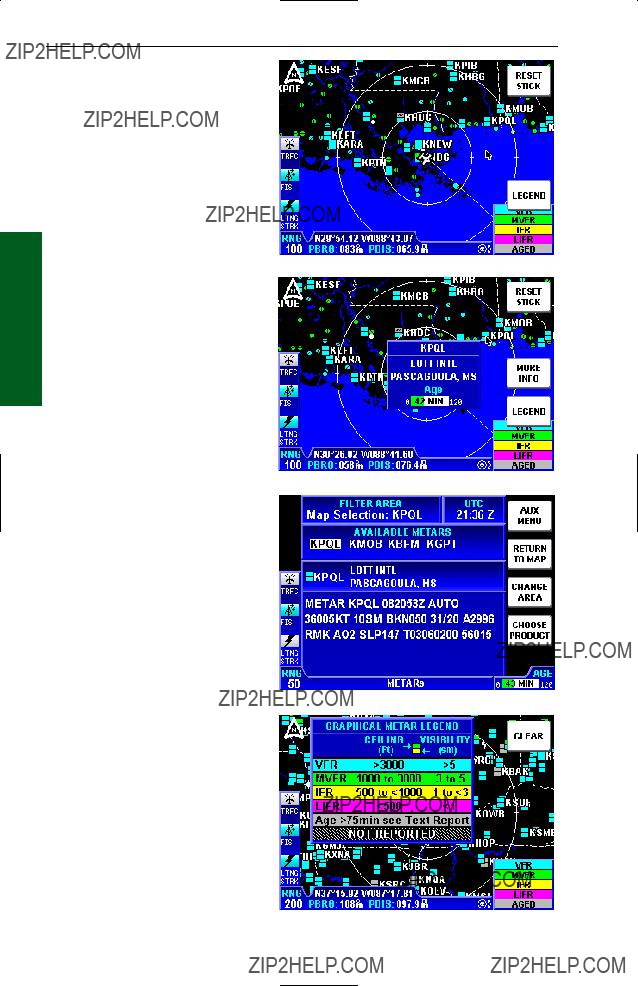
Normal Operation
FIS Operation
Section 2
pertaining to the location and the AGE of the report (see Figure
4.Press the RNG??? /RNG??? keys to zoom in or out on the pointer position.
5.Press the MORE INFO Softkey to display the Text METAR Page for the displayed location as in Figure
6.Press the RETURN TO MAP Softkey to return to the previous display.
7.Press the RESET STICK
Softkey to return to the present position display. If no actions are taken for a period of 30 seconds, the display will return to the aircraft present position display.
8.To view the GRAPHICAL METAR LEGEND, move the joystick pointer to an area with no icons and press the LEGEND Softkey. The legend will be displayed as in Figure 2-
34.Press the CLEAR Softkey to remove the legend from the display.
Figure
Figure
Figure
Figure
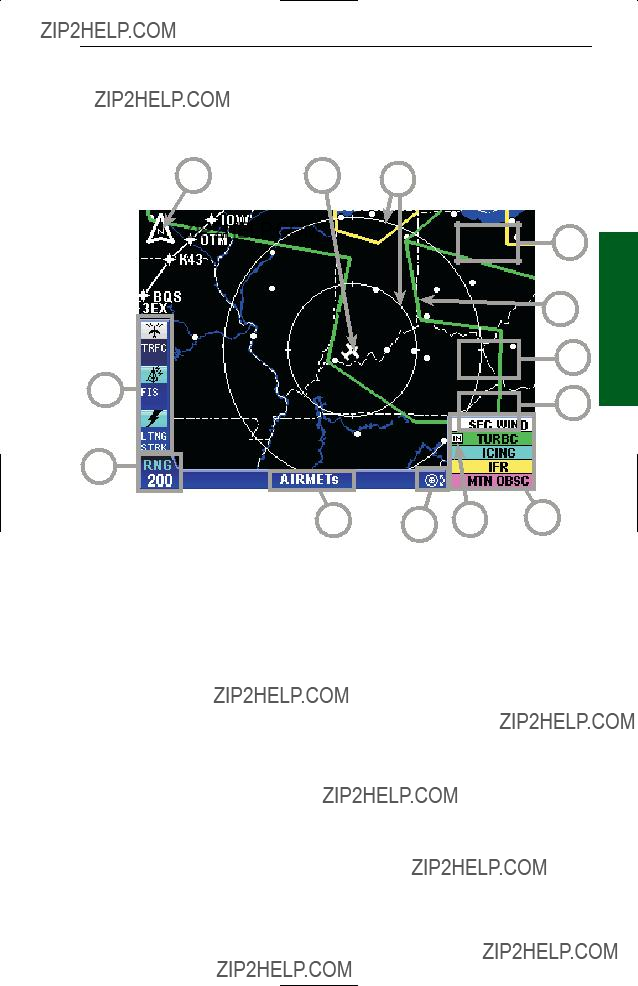
Normal Operation
GRAPHICAL AIRMETS PAGE
The following illustration describes the Graphical AIRMETs display. The only difference between VDL and XM is the FIS function status icon.
6
1
2 Section
Operation FIS
1 Display Range - RNG:####.
2Function Status Icons - Displays icons representing data available and displayed.
3 North Pointer
4Aircraft Symbol - Indicates present position. Stylized airplane when heading/track input is present, a plus symbol with no heading/track.
5Range Rings - Outer ring radius is selected range, inner ring radius is one half the selected range.
6 RESET STICK Soft Label - Displayed when the Joystick is moved.
7 AIRMET Boundary - Color coded line indicating the boundaries of an AIRMET.
8MORE INFO Soft Label - Displayed when the Joystick Pointer is positioned over an AIRMET boundary line. Pressing this Softkey will display more information.
9 LEGEND Soft Label - Displayed when the Joystick is moved.
10Boundary Color Key - Colors indicate the type of weather phenomenon.
11IN - Indicates the current aircraft position is ???IN??? a turbulence AIRMET.
12Rotary Knob Active - When displayed on the graphical weather products pages, rotating the knob will cycle through the products.
13Current Selection - Displays the name of the weather product currently being viewed.

Normal Operation
GRAPHICAL AIRMETS PAGE OPERATIONAL CONTROLS
FIS Operation
Section 2
WX Function Select Key - Cycles through Graphical Weather Products, Textual Weather Products and Stormscope??.
Rotary Knob - Turning the Rotary Knob cycles through the graphical NEXRAD, METAR, AIRMET, SIGMET, Convective SIGMET, Alert Weather Watches and FIS Network Status Pages.
Joystick - Moving the Joystick allows panning of the map and placement of the pointer over the desired weather activity to be viewed.
RNG???/RNG??? - Displays ZOOMING TO ### nm and advances the indicator to the next range. The upper button increases range, the lower button decreases it. The selected range is displayed in the lower left corner of the display with the outer range ring the displayed range and the inner range ring is half the displayed range.
USING THE GRAPHICAL AIRMETS PAGE
1. Press the WX Function Select Key until the FIS Graphics Page is displayed. If necessary, turn the Rotary Knob to obtain the Graphical AIRMETs display similar to Figure
NOTE: This page will not be accessible until a valid FIS
signal has been acquired andFigure
2.Press the RNG???/RNG??? Key to zoom in on the display. The map is centered on the present position indicated by the symbolic aircraft.
3.To view a specific AIRMET, move the joystick in the desired direction and place the pointer on the desired AIRMET border (see Figure
4.Press the RNG???/RNG??? keys to zoom in or out on the pointer posi- tion.

Normal Operation
5.Press the MORE INFO Softkey to display the Text AIRMET Page for the displayed location as in Figure
6.Press the RETURN TO MAP Softkey to return to the previous display.
7.Press the RESET STICK
Softkey to return to the present position display. If no actions are taken for a period of 30 sec- onds, the display will return to the aircraft present position dis- play.
8.To view the AIRMET LEGEND, move the joystick to display the LEGEND Softkey. Press the LEGEND Softkey and the legend will be dis- played as in Figure
Figure
Figure
2 Section
Operation FIS
Figure

Normal Operation
GRAPHICAL SIGMETS PAGE
The following illustration describes the Graphical SIGMETs display. The only difference between VDL and XM is the FIS function status icon.
FIS Operation
Section 2
3
2
1
7
8
9
1 Display Range - RNG:####.
2Function Status Icons - Displays icons representing data available and displayed.
3 SIGMET Boundary - Color coded line indicating the boundaries of a SIGMET.
4 North Pointer
5Aircraft Symbol - Indicates present position. Stylized airplane when heading/track input is present, a plus symbol with no heading/track.
6Range Rings - Outer ring radius is selected range, inner ring radius is one half the selected range.
7 RESET STICK Soft Label - Displayed when the Joystick is moved.
8 MORE INFO Soft Label - Displayed when the Joystick Pointer is positioned over a SIGMET boundary line. Pressing this Softkey will display more information.
9 LEGEND Soft Label - Displayed when the Joystick is moved.
10Boundary Color Key - Colors indicate the type of weather phenomenon.
11Rotary Knob Active - When displayed on the graphical weather products pages, rotating the knob will cycle through the products.
12Current Selection - Displays the name of the weather product currently being viewed.

Normal Operation
GRAPHICAL SIGMETS PAGE OPERATIONAL CONTROLS
WX Function Select Key - Cycles through Graphical Weather Products, Textual Weather Products and Stormscope??.
Rotary Knob - Turning the Rotary Knob cycles through the graphical NEXRAD, METAR, AIRMET, SIGMET, Convective SIGMET, Alert Weather Watches and FIS Network Status Pages.
Joystick - Moving the Joystick allows panning of the map and placement of the pointer over the desired weather activity to be viewed.
RNG??? /RNG??? - Displays ZOOMING TO ### nm and advances the indicator to the next range. The upper button increases range, the lower button decreases it. The selected range is displayed in the lower left corner of the display with the outer range ring the displayed range and the inner range ring is half the displayed range.
2 Section
Operation FIS
USING THE GRAPHICAL SIGMETS PAGE
1. Press the WX Function Select Key until the FIS Graphics Page is displayed. If necessary, turn the Rotary Knob to obtain the Graphical SIGMETs display similar to Figure
NOTE: This page will not be accessible until a valid FIS
signal has been acquired andFigure
2.Press the RNG???/RNG??? Key to zoom in on the display. The map is centered on the present position indicated by the symbolic aircraft.
3.To view a specific SIGMET, move the joystick in the desired direction and place the pointer on the desired SIGMET border (see Figure
FIS Operation
Section 2
Normal Operation
4.Press the RNG??? /RNG??? keys to zoom in or out on the pointer position.
5.Press the MORE INFO Softkey to display the Text SIGMET Page for the dis- played location as in Figure 2-
6.Press the RETURN TO MAP Softkey to return to the previous display.
7.Press the RESET STICK
Softkey to return to the present position display. If no actions are taken for a period of 30 sec- onds, the display will return to the aircraft present position dis- play.
8.To view the SIGMET LEGEND, move the joystick to display the LEGEND Softkey. Press the LEGEND Softkey and the legend will be displayed as in Figure
Figure
Figure
Figure

Normal Operation
GRAPHICAL CONVECTIVE SIGMETS PAGE
The following illustration describes the Graphical Convective SIGMETs display. The only difference between VDL and XM is the FIS function status icon.
3
2
1
7
8
9
2 Section
Operation FIS
1 Display Range - RNG:####.
2Function Status Icons - Displays icons representing data available and displayed.
3Convective SIGMET Boundary - Yellow line indicates the boundaries of a Convective SIGMET.
4 North Pointer
5Aircraft Symbol - Indicates present position. Stylized airplane when heading/track input is present, a plus symbol with no heading/track.
6Range Rings - Outer ring radius is selected range, inner ring radius is one half the selected range.
7 RESET STICK Soft Label - Displayed when the Joystick is moved.
8MORE INFO Soft Label - Displayed when the Joystick Pointer is positioned over a boundary line. Pressing this Softkey will display more information.
9 LEGEND Soft Label - Displayed when the Joystick is moved.
10Boundary Color Key - Colors indicating type of weather phenomenon.
11Rotary Knob Active - When displayed on the graphical weather products pages, rotating the knob will cycle through the products.
12Current Selection - Displays the name of the weather product currently being viewed.

Normal Operation
GRAPHICAL CONVECTIVE SIGMETS PAGE OPERATIONAL
CONTROLS
FIS Operation
Section 2
WX Function Select Key - Cycles through Stormscope??, Graphical Weather Products and Textual Weather Products.
Rotary Knob - Turning the Rotary Knob cycles through the graphical NEXRAD, METAR, AIRMET, SIGMET, Convective SIGMET, Alert Weather Watches and FIS Network Status Pages.
Joystick - Moving the Joystick allows panning of the map and placement of the pointer over the desired weather activity to be viewed.
RNG???/RNG??? - Displays ZOOMING TO ### nm and advances the indicator to the next range. The upper button increases range, the lower button decreases it. The selected range is displayed in the lower left corner of the display with the outer range ring the displayed range and the inner range ring is half the displayed range.
USING THE GRAPHICAL CONVECTIVE SIGMETS PAGE
1. Press the WX Function Select Key until the FIS Graphics Page is displayed. If necessary, turn the Rotary Knob to obtain the Graphical Convective SIGMETs display similar to Figure
Convective SIGMETs will be displayed at the bottom of the display.
NOTE: This page will not be
accessible until a valid FISFigure
processed by the system.
2.Press the RNG???/RNG??? Key to zoom in on the display. The map is centered on the present position indicated by the symbolic aircraft.
3.To view a specific Convective SIGMET, move the joystick in the desired direction and place the pointer on the desired Convective SIGMET border (see Figure

Normal Operation
4.Press the RNG??? /RNG??? keys to zoom in or out on the pointer position.
5.Press the MORE INFO Softkey to display the Text Convective SIGMET Page for the displayed location as in Figure
6.Press the RETURN TO MAP Softkey to return to the previous display.
7.Press the RESET STICK
Softkey to return to the present position display. If no actions are taken for a period of 30 seconds, the display will return to the aircraft present position display.
8.To view the CONV SIGMET LEGEND, move the joystick to display the LEGEND Softkey. Press the LEGEND Softkey and the legend will be displayed as in Figure
Figure
Figure
2 Section
Operation FIS
Figure

Normal Operation
GRAPHICAL ALERT WEATHER WATCHES PAGE (AWW) (VDL ONLY)
The following illustration describes the Graphical Alert Weather Watches (AWW) display.
FIS Operation
Section 2
7
3
1
1 Display Range - RNG:####.
2Function Status Icons - Displays icons representing data available and displayed.
3Weather Watch Boundary - Color coded line indicates the boundaries and type of Weather Watch.
4 North Pointer
5Aircraft Symbol - Indicates present position. Stylized airplane when heading/track input is present, a plus symbol with no heading/track.
6 Range Rings - Outer ring radius is selected range, inner ring radius is one half the selected range.
7 RESET STICK Soft Label - Displayed when the Joystick is moved.
8MORE INFO Soft Label - Displayed when the Joystick Pointer is positioned over a boundary line. Pressing this Softkey will display more information.
9 LEGEND Soft Label - Displayed when the Joystick is moved.
10Boundary Color Key - Colors indicating type of weather phenomenon.
11Rotary Knob Active - When displayed on the graphical weather products pages, rotating the knob will cycle through the products.
12Current Selection - Displays the name of the weather product currently being viewed.

Normal Operation
GRAPHICAL WEATHER WATCHES PAGE OPERATIONAL
CONTROLS
WX Function Select Key - Cycles through Graphical Weather Products, Textual Weather Products and Stormscope??.
Rotary Knob - Turning the Rotary Knob cycles through the graphical NEXRAD, METAR, AIRMET, SIGMET, Convective SIGMET, Alert Weather Watches and FIS Network Status Pages.
Joystick - Moving the Joystick allows panning of the map and placement of the pointer over the desired weather activity to be viewed.
RNG???/RNG??? - Displays ZOOMING TO ### nm and advances the indicator to the next range. The upper button increases range, the lower button decreases it. The selected range is displayed in the lower left corner of the display with the outer range ring the displayed range and the inner range ring is half the displayed range.
2 Section
Operation FIS
USING THE GRAPHICAL WEATHER WATCHES PAGE
1. Press the WX Function Select Key until the FIS Graphics Page is displayed. If necessary, turn the Rotary Knob to obtain the Graphical Weather Watches display sim- ilar to Figure
NOTE: This page will not be
accessible until a valid FISFigure
processed by the system.
2.Press the RNG???/RNG??? Key to zoom in on the display. The map is centered on the present position indicated by the symbolic aircraft.
3.To view a specific Weather Watch, move the joystick in the desired direction and place the pointer on the desired Weather Watch border (see Figure
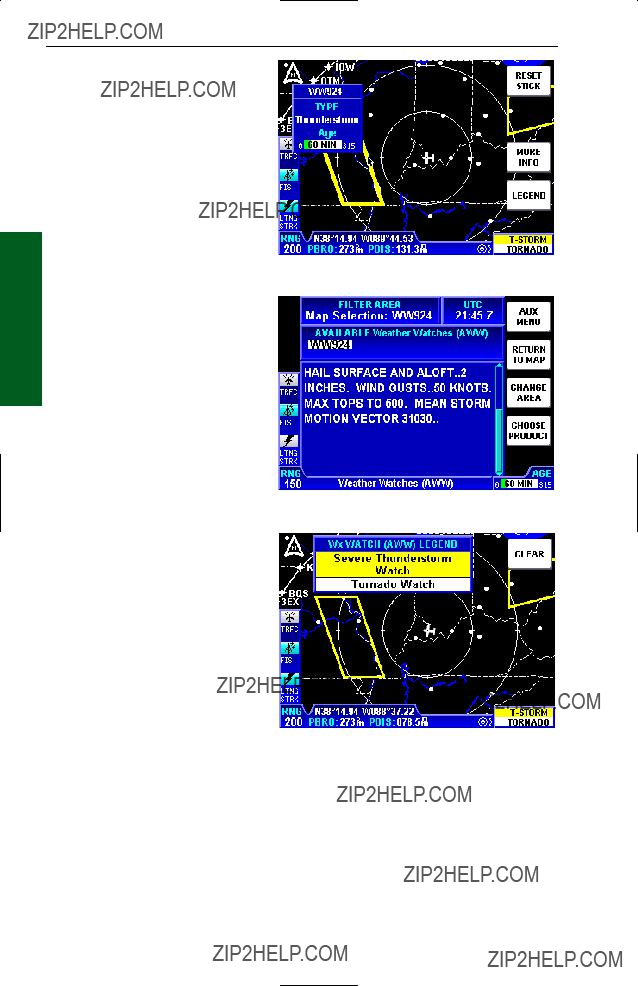
FIS Operation
Section 2
Normal Operation
4.Press the RNG??? /RNG??? keys to zoom in or out on the pointer position.
5.Press the MORE INFO Softkey to display the Text Weather Watch Page for the displayed location as in Figure
6.Press the RETURN TO MAP Softkey to return to the previous display.
7.Press the RESET STICK
Softkey to return to the present position display. If no actions are taken for a period of 30 seconds, the display will return to the aircraft present position display.
8.To view the Wx WATCH (AWW) LEGEND, move the joystick to display the LEGEND Softkey. Press the LEGEND Softkey and the legend will be displayed as in Figure
Figure
Figure
Figure

Normal Operation
FIS NETWORK STATUS PAGE (VDL ONLY)
The FIS Network Status Page displays the location and identifier of installed ground stations. This page can also be used to determine which stations are being received and the status of each station.
The following illustration describes the FIS Network Status Page display.
2
1
2Function Status Icons - Displays icons representing data available and displayed.
3 North Pointer
4Aircraft Symbol - Indicates present position. Stylized airplane when heading/track input is present, a plus symbol with no heading/track.
5Range Rings - Outer ring radius is selected range, inner ring radius is one half the selected range.
6 RESET STICK Soft Label - Displayed when the Joystick is moved.
7FIS Station Icon - Color coded icon indicates station location and status. The ???starburst??? indicates station currently being received.
8Color Key - Ground station status legend.
UNKNOWN indicates the station status is unknown. If network status information has not been recently received, all sites will be shown as UNKNOWN in white at their last known location.
OK indicates the station is broadcasting current information.
CHECK AGE indicates the station is operating, but may not be broadcasting
the most recent information. Check the age of the data before using. OFFLINE indicates the station is known to be offline.
9Rotary Knob Active - When displayed on the graphical weather products pages, rotating the knob will cycle through the products.
10Current Selection - Displays the name of the weather product currently being viewed.

Normal Operation
FIS NETWORK STATUS PAGE OPERATIONAL CONTROLS
FIS Operation
Section 2
WX Function Select Key - Cycles through Graphical Weather Products, Textual Weather Products and Stormscope??.
Rotary Knob - Turning the Rotary Knob cycles through the graphical NEXRAD, METAR, AIRMET, SIGMET, Convective SIGMET, Alert Weather Watches and FIS Network Status Pages.
Joystick - Moving the Joystick allows panning of the map and placement of the pointer over the desired weather activity to be viewed.
RNG???/RNG??? - Displays ZOOMING TO ### nm and advances the indicator to the next range. The upper button increases range, the lower button decreases it. The selected range is displayed in the lower left corner of the display with the outer range ring the displayed range and the inner range ring is half the displayed range.
USING THE FIS NET-
WORK STATUS PAGE
1. Press the WX Function Select Key until the FIS Graphics Page is displayed. If necessary, turn the Rotary Knob to obtain the FIS Network Status display similar to Figure
Status will be displayed at theFigure
2.Press the RNG??? /RNG??? Key to zoom in on the display. The map is centered on the present position indicated by the symbolic aircraft.
3.To view a specific FIS Network station move the joy- stick in the desired direction and place the pointer on the

Normal Operation
4. Press the RESET STICK Softkey to return to the present position dis- play. If no actions are taken for a period of 30 seconds, the display will return to the aircraft present position display.
NOTE: At any given moment the FIS receiver may not be receiving the closest transmitting site. This is not a problem since all stations transmit the same data.
Visit Wingman Services at www.bendixking.com to view the latest infor- mation about network transmitter locations and to
2 Section
Operation FIS
Normal Operation
FIS TEXTUAL WEATHER PRODUCTS
FIS Operation
Section 2
The following illustration describes the FIS Textual Products display. The only difference between VDL and XM is the FIS function status icon.
11
2  12
12
13
1
14
1Report Range - RNG:####. Pressing the RNG???/RNG??? Key will change the distance radius from the selected FILTER AREA in which available reports will be listed. In this case all available METARs with a 50 mile radius of KJHW will be listed in the AVAILABLE METARS field.
2Function Status Icons - Displays icons representing data available (black) and displayed (color).
3 Selected Report Info - Displays identifier, name, city and state of selected
report. This field is only displayed for METARs, TAFs and PIREPs when available.
4Available Reports - Shows available reports based on the selection in the FILTER AREA field. Special, urgent or amended reports are
highlighted in yellow. Horizontal movement of the joystick will move the cursor over the next report in the field. The presence of a scroll bar indicates more reports are available, but not displayed.
5Filter Area Selection - Pressing the CHANGE AREA Softkey cycles between Destination, Flightplan WPT, Nearest and User Defined.
6Knob Active - When displayed, the Rotary Knob can be used to select an identifier from the database or Flightplan. This is only available when
10Change Area Softlabel - Cycles the FILTER AREA field between Destination, Flightplan Waypoint (FPL WPT), Nearest and User Defined.
11Text Field - The encoded weather report is displayed in this field.
12CHOOSE PRODUCT Softlabel - Pressing this softkey will display the SELECT WX PRODUCT window. Use the Rotary Knob or Joystick to highlight the desired product and press SELECT.
13Current Selected - Indicates the currently selected weather product.
14Age of Report- Age of report based on UTC time minus time of report. The colored bar indicates percentage of age versus elapsed time before expiration. The bar will be green the first 50% then turn yellow.
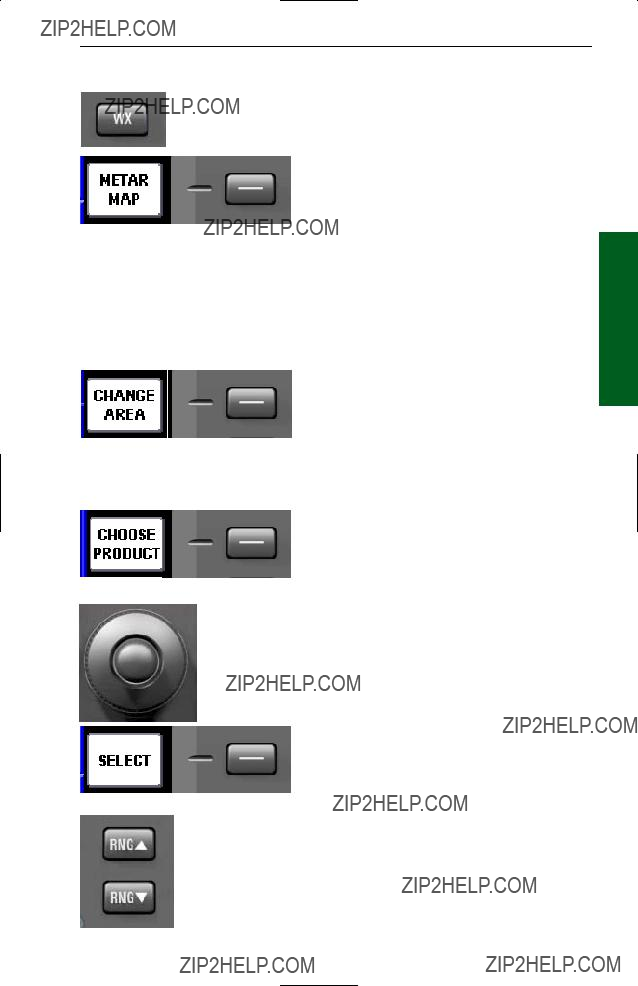
Normal Operation
FIS TEXTUAL PRODUCTS OPERATIONAL CONTROLS
WX Function Select Key - Cycles through Graphical Weather Products, Textual Weather Products and Stormscope??.
MAP Softkey - Depending on which tex- tual product is currently being viewed, this softkey will be labeled for corresponding graphical product page. For example, if
viewing the textual METAR page this softkey will be labeled METAR MAP as shown here. If viewing the textual AIRMETs page this softkey will be labeled AIRMET MAP and so on.
NOTE: If no location description is provided in the textual AIRMET the AIRMET cannot be depicted graphically. These AIRMETs are denoted by displaying the AIRMET identifier in green within the textual AIRMET. Also, the AIRMET MAP Softkey will not be available.
CHANGE AREA Softkey - Pressing the
CHANGE AREA softkey will cycle through the four options available for the FILTER AREA field in the upper part of the display. Available selections are
Destination, Nearest, FPL WPT and User Defined. The closest avail- able weather reports for the selected FILTER AREA will be displayed in
the AVAILABLE reports field.
CHOOSE PRODUCT Softkey - Pressing the CHOOSE PRODUCT softkey will dis- play the SELECT WX PRODUCT window. Use the Rotary Knob or Joystick to highlight the desired weather product.
Rotary Knob/Joystick - These may be used to high- light the desired weather product in the SELECT WX PRODUCT window. The Rotary Knob may also be used to scroll through flightplan waypoints and enter air- port identifiers.
SELECT Softkey - After highlighting the desired weather product in the SELECT WX PRODUCT window, pressing the SELECT Softkey will display the chosen weather product.
RNG???/RNG??? Keys - The KMD 250 displays all textual weather product reports available within a specified radius of the selection made in the FILTER AREA. This specified radius can be changed by pressing the RNG???/RNG??? Keys.
2 Section
Operation FIS

Normal Operation
FIS Operation
Section 2
USING THE FIS TEXT
PAGE
Press the WX Function Select Key until the FIS Textual Page is displayed as shown in Figure
NOTE: If a notification such as that shown in Figure
If no METAR is available in the selected area, a notification such as that shown in Figure 2- 55 will be displayed.
The example displayed in Figure
Press the METAR MAP Softkey to display the graphical METAR for the KIXD as shown in Figure
The METAR MAP Softkey will change depending on the selected weather product. In this case a METAR is being viewed so the label displays METAR MAP. If viewing an AIRMET, the label would show AIRMET MAP and so on. In short, pressing this softkey will display the graphical weather product for the appropriate tex- tual weather product selected.
NOTE: See Appendix B for a list of common weather abbre- viations.
Figure
Figure
Figure
Figure

Normal Operation
CHANGING WEATHER
PRODUCTS
1.Press the CHOOSE PRODUCT Softkey to display the SELECT WX PRODUCT window as shown in Figure 2-
2.Turn the Rotary Knob or move the Joystick up or down
to highlight the desired weather product.
3.Press the SELECT Softkey. If a Graphical Weather Product is selected, refer to that partic- ular Graphical Weather Products section for operation.
4.If desired, press the RNG???/RNG??? Keys to change the reporting radius for the selected FILTER AREA. The
default distance for METARs is 50nm and TAFs is 100nm. All others are 150nm. The user selected distance can be from 50 to 300nm.
Note that in Figure
played. Move the Joystick to the right to select the different reports.
In Figure
The AVAILABLE METARS field (or TAFS, PIREPS, etc.) lists closest first, furthest last. For instance, the display shown in Figure
2 Section
Operation FIS

Normal Operation
KJHW is also a reporting station which is listed first in the AVAILABLE METARS field. Use the joystick to scroll through the AVAILABLE METARS. Urgent, special or amended reports will be highlighted in yellow.
Note that the displayed report in Figure
CHANGING FILTER AREA
FIS Operation
Section 2
1. Press the CHANGE AREA Softkey to view either Nearest to present position, a User Defined location, the Destination (last waypoint in a flightplan) or FPLN WPT (any waypoint in an active flightplan). The softkey cycles through the FILTER AREAs as shown in Figure
Figure
These four selectable areas are used to make it easier to find all the reports near a specific location without having to know the exact identifier of the reporting station.
Scanning Flightplan
Waypoints
If FPLN WPT is selected in the FILTER AREA field (as shown in Figure
Turn the Rotary Knob clockwise
to sequence forward through the waypoints. Turn the Rotary Knob

Normal Operation
Finding User Defined Areas by Identifier
If User Defined has been selected, as in Figure
1. Turn the Rotary Knob to dis- play the USER DEFINED AREA ENTRY window as shown in Figure
2. Move the Joystick to the right to highlight the next char- acter as seen in Figure
3. After entering the desired the identifier, press the OK Softkey. The selected weather product will now be displayed for the new User Defined area.
Finding User Defined Areas by Name or City
When the identifier of the desired location is known, the method previously described
can be used to select it. However, if the identifier is not known, the name of the location can be entered. The system will also allow entry of just the first few characters of the location name to help find it in the data- base. If neither the identifier nor the location name is known, the city/state can be scanned.
2 Section
Operation FIS

FIS Operation
Section 2
Normal Operation
To Enter Location Name:
The following example shows entering MONTROSE REGL as a location.
1.Turn the Rotary Knob to dis- play the USER DEFINED AREA ENTRY window as shown in Figure
2.Move the Joystick down to highlight the first character of the location name as shown in Figure
3.Turn the Rotary Knob coun- terclockwise until an M is selected as shown in Figure 2-
4.Move the Joystick to the right to highlight the next char- acter as seen in Figure
5.Turn Rotary Knob clockwise until an O is selected. Continue moving the cursor and entering characters until MONTROSE is displayed.
Figure
Figure
Figure

Normal Operation
6.Press the KNOB SCAN Softkey and Figure
7.Turn the Rotary Knob one click clockwise. The first occur- ance of names starting with Montrose in the database is now displayed as in Figure 2-
8.Turn the Rotary Knob to scan through the database until the desired name is displayed as in Figure
9.Press the OK Softkey to view the selected weather product for MONTROSE REGL.
To Enter Location by City:
A location may be selected by first entering the city using the same method as entering the location name.
1.After entering the city, press the KNOB SCAN Softkey.
2.Turning the Rotary Knob will scan through the database dis- playing each entry for the city of Montrose.
3.Press the OK Softkey when the desired location is dis- played.
Figure
Figure
2 Section
Operation FIS
Figure
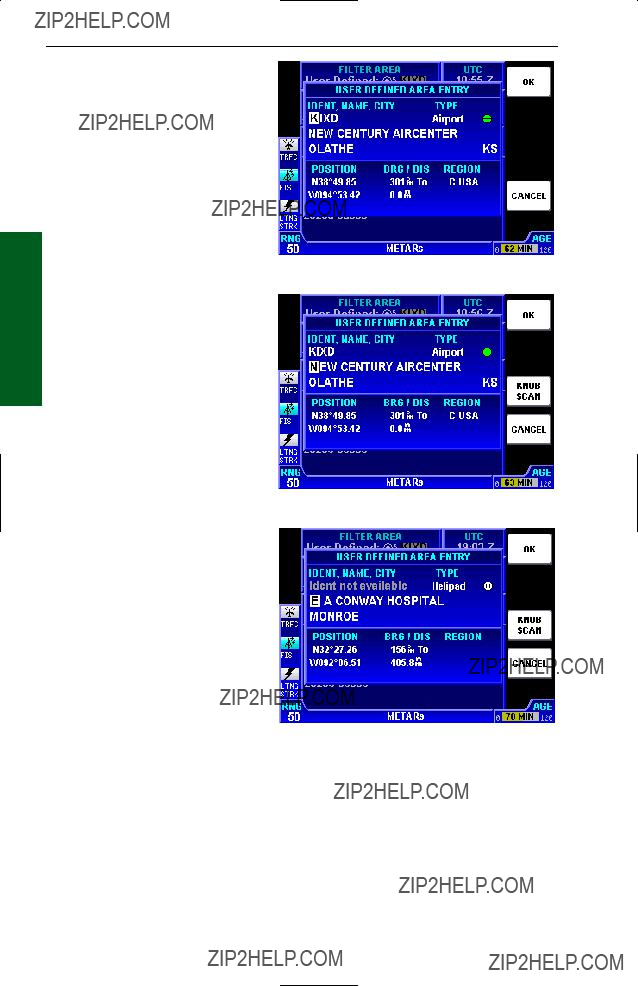
FIS Operation
Section 2
Normal Operation
To Scan for Location Name:
Sometimes, only a portion of the airport name may come to mind. The following example shows scanning for EAGLE GROVE MUN when EAGLE is the only portion of the name remembered.
1.If necessary press the
CHANGE AREA Softkey to select User Defined in the
FILTER AREA.
2.Turn the Rotary Knob to dis- play the USER DEFINED AREA ENTRY window as shown in Figure
3.Move the Joystick down to highlight the first the character of the location name as shown in Figure
4.Turn the Rotary Knob coun- terclockwise until an E is selected as shown in Figure 2-
Figure
Figure
Figure

Normal Operation
5.Move the Joystick to the right to highlight the next char- acter space as seen in Figure
6.Turn Rotary Knob clockwise until an A is selected as in Figure
7.Press the KNOB SCAN Softkey and Figure
8.Turn the Rotary Knob to sequence through all the loca- tion names in the database beginning with EAGLE. stop- ping at the desired name as in Figure
9.Press the OK Softkey to select EAGLE GROVE MUN as the User Defined area.
NOTE: This same method may be used with the name of the city where the airport is located.
This method is also used to choose the desired airport among those of identical names, but located in different cities.
Figure
Figure
2 Section
Operation FIS
Figure
Normal Operation
FIS Operation
Section 2
Intentionally left blank

FIS Notifications
FIS NOTIFICATIONS
The following are descriptions of FIS notifications that may be displayed.
(GRAPHICAL PRODUCT) DATA HAS NOT BEEN
RECEIVED
If no valid graphical product data is received (in this case NEXRAD) a notification such as that shown in Figure
This notification usually means that the system is not in FIS VDL coverage or there is no subscription set up for the Value Added Product selected. For XM WX, the notification usually means that the XM WX signal strength is poor.
The notification can also occur while in coverage if not all of the data for a weather product has been received.
NO METARS AVAIL-
ABLE IN SELECTED
AREA
A notification such as that shown in Figure
Figure
Figure
2 Section
Operation FIS
This notification means that the
FIS system is working properly, there are simply no reports of the selected mode within the area.

FIS Operation
Section 2
FIS Notifications
NO METARS AVAILABLE, DATA NOT RECEIVED
This notification will be dis- played (Figure
This notification means the FIS system has not received any METAR data. This may be due to not being in FIS cov- erage or to poor signal strength.
Figure
INVALID SUBSCRIPTION CODE. PLEASE CHECK AND
This notification will be dis- played (Figure
Figure

Understanding Weather Reports
UNDERSTANDING TEXTUAL AVIATION
WEATHER REPORTS
UNDERSTANDING METARS
Refer to the numbers on the following diagram to find the appropriate descriptions.
METAR
 KPIT
KPIT
 201955Z
 AUTO
AUTO
 22015G25KT
 3/4SM R28R/2600FT
 TSRA
TSRA
 OVC010CB 18/16
 A2992
A2992
 RMK SLPO13 T01760158 PK WND 22030/15
1.Type of Report: METAR (SPECI will be seen here if this is a Special Weather Report)
2.ICAO Station Identifier: KPIT
This is the location for which the METAR pertains.
3.Date and Time of Issue: 201955Z
The 20th day of the month at 1955Zulu or UTC.
4.AUTO indicates the reporting station is an automated station. If the reporting station is a manned station this element will be omitted. Also, if a report from an automated station is modified by a person this element will be omitted. ???COR??? indicates a corrected report.
5.Wind: 22015G25KT
220 is the 3 digit true direction to the nearest 10??. Airport advisory service, ATIS and ATC towers report wind direction as magnetic. ???VRB??? in this place indicates variable winds less than or equal to 6 knots. If wind direction is varying more than 60?? with speeds over 6 knots, an entry similar to ???180V260??? will be displayed in this place. This example actually shows wind direction varying by 80??.
15 is the 2 or 3 digit wind speed (in knots).
25 is the 2 or 3 digit wind gust speed in knots (KT) because it follows a G (Gust).
6.Visibility: 3/4SM R28R/2600FT
3/4 indicates 3/4 statute mile (SM) visibility.
Runway Visual Range (RVR) for R28R (runway 28 right) is 2600 feet (2600FT). An ???M??? in this distance number indicates visibility is less than the lowest reportable sensor value. A ???P??? indicates visibility is greater than the highest reportable sensor value.
2 Section
Operation FIS

FIS Operation
Section 2
Understanding Weather Reports
NOTE: Only reported at those locations with certified RVR reporting capability.
7. Significant Present Weather: TSRA
TS is a two letter designation for thunderstorm. Other possible des- ignations could be as follows:
The second two letter designator, RA, indicates moderate rain. Moderate is indicated by the absence of a ???+???,
+Heavy
-Light
VC In the vicinity
Other possible designations could be as follows:

Understanding Weather Reports
8. Sky Condition: OVC010CB
OVC indicates the sky is overcast. Cloud cover is based on the sky being divided into eighths or octas. Overcast means the sky is 8 octas covered. The cloud cover designators are as follows:
SKC Sky Clear
CLR Clear below 12,000 ft. (automated observing systems) FEW
SCT
BKN
???VV??? may also be encountered here indicating an indefinite ceiling. For example, VV004 would indicate a vertical visibility of 400 feet.
010 indicates clouds are at 1000 feet.
CB denotes cloud type is cumulonimbus. ???TCU??? is another possible designator meaning towering cumulus. CI is cirrus.
9.Temperature/Dew Point: 18/16
18 indicated the temperature is 18?? Celsius. An ???M??? preceding the temperature means the temperature is below 0?? Celsius.
16 indicated the dew point is 16?? Celsius. An ???M??? preceding the dew point means the dew point is below 0?? Celsius.
10. Altimeter Setting: A2992
A indicates the setting is in inches of mercury.
2992 is the altimeter setting. The first two digits are inches and the second two are hundredths.
11.Remarks: RMK SLP013 T01760158 PK WND 22030/15
RMK designates the beginning of the remarks. Remarks can con- tain anything, but often include the following:
SLP indicates sea level pressure in millibars from selected stations.
013 indicates pressure is 1001.3 millibars.
T01760158. Selected stations may also include a 9 place code indi- cating temperature and dewpoint to the nearest 1/10 degree. T denotes temperature. 0 indicates temperature is above 0?? Celsius. A ???1??? in this position indicates a temperature below 0?? Celsius. 176 indicates a temperature of 17.6?? Celsius. The next 0 indicates the dew point is above 0?? Celsius. A ???1??? in this position indicates a dew point below 0?? Celsius. 158 indicates a dewpoint of 15.8?? Celsius.
PK WND 22030/15. Selected stations may include peak wind observations which will appear in the remarks element.
2 Section
Operation FIS

Understanding Weather Reports
PK WND denotes peak wind.
200 indicates wind direction from 200??.
30/15 indicates a maximum instantaneous wind of 30 knots occurred at 15 minutes past the hour.
FIS Operation
Section 2
UNDERSTANDING TAFS
Refer to the numbers on the following diagram to find the appropriate descriptions.
TAF 
 KPIT
KPIT
 091730Z
 091818
 22020KT
 3SM
3SM
 -SHRA
-SHRA
 BKN020
FM2030 30015G25KT 3SM SHRA OVC015 WS015/30045KT 20 19
20 19  TEMPO 2022 1/2SM TSRA OVC008CB
FM0100 27008KT 5SM  21
21
00000KT 1SM
10
 FM1000
 22010KT
 5SM
5SM
 -SHRA
-SHRA
 OVC020
 BECMG
BECMG
 20010KT
P6SM
 NSW
NSW
 SKC
SKC
1.Type of Report: TAF
TAF indicates a Terminal Area Forecast. TAF AMD indicates an amended forecast.
2.ICAO Station Identifier: KPIT
This is the airport for which the TAF pertains.
3.Date and Time of Issue: 091730Z
The 9th day of the month at 1730Zulu or UTC.
4.Date and Time Valid: 091818
The 9th day of the month, valid for 24 hours from 091800Z to 101800Z. An amended forecast (TAF AMD) will be valid for only the time interval remaining, usually less than 24 hours.
5.Forecast Wind: 22020KT
See #5 in the UNDERSTANDING METARs section for details.
6.Forecast Visibility: 3SM
See #6 in the UNDERSTANDING METARs section for details, except RVR is not included in a TAF

Understanding Weather Reports
7.Forecast Weather Phenomenon:
See #7 in the UNDERSTANDING METARs section for details.
8.Sky Conditions: BKN020
See #8 in the UNDERSTANDING METARs section for details.
9.Beginning of Changed Forecast Conditions: FM1000
FM denotes ???from??? and 1000 indicates 1000Z. ???From??? means a sig- nificant change in prevailing conditions is expected. The described conditions follow this element and supercede all previous forecast conditions.
10.Forecast Wind: 22010KT
See #5 in the UNDERSTANDING METARs section for details.
11.Forecast Visibility: 5SM
See #6 in the UNDERSTANDING METARs section for details.
12.Forecast Weather Phenomenon:
See #7 in the UNDERSTANDING METARs section for details.
13.Forecast Sky Conditions: OVC020
See #8 in the UNDERSTANDING METARs section for details.
14.Change in Conditions: BECMG 1315
BECMG indicates ???becoming??? over the time interval between 1300Z (13) and 1500Z (15). ???Becoming??? describes a gradual change in forecast conditions. The described conditions follow this element and supercede previously reported like elements.
15.Wind Becoming: 20010KT
See #5 in the UNDERSTANDING METARs section for details. This element may be omitted if no change is expected.
16.Visibility Becoming: P6SM
See #6 in the UNDERSTANDING METARs section for details. This element may be omitted if no change is expected.
17.Weather Phenomenon Becoming: NSW
NSW indicates ???No Significant Weather???. See #7 in the UNDER- STANDING METARs section for details.
18.Sky Conditions Becoming: SKC
See #8 in the UNDERSTANDING METARs section for details. This element may be omitted if no change is expected.
19.Change in Conditions: TEMPO 2022
TEMPO indicates ???temporary??? changes expected as described between 2000Z (20)and 2200Z (22). ???Temporary??? indicates a tem- porary fluctuation in conditions, usually lasting less than one hour.
2 Section
Operation FIS

FIS Operation
Section 2
Understanding Weather Reports
The described conditions follow this element.
20.Low Level Windshear: WS015/30045KT
WS indicates ???windshear??? not associated with convective activity. 015 indicates the windshear is expected at 1500 feet. AGL Wind is expected from 300?? (300) at 45 knots (45KT).
21.Change in Conditions: PROB40 0407
PROB40 indicates a 40% ???probability??? of described conditions occur- ring between 0400Z (04)and 0700Z (07). The described conditions follow this element.
UNDERSTANDING PIREPS
The following is an example of a typical PIREP with an explanation of the elements.
KCRW
 UA/OV KBKW
1.Station Identifier: KCRW
This is the station identifier of the nearest weather reporting location to the reported conditions.
2.Report Type: UA
Reports will be routine (UA) or urgent (UUA).
3.Location: OV KBKW
OV indicates the report is in relation to a VOR. KBKW is the VOR identifier, in this case Beckley VOR.
The next series of elements contain data that is read much like that in METARs and TAFs. Each element starts with a
/TM: Time as Coordinated Universal Time
/FL: Altitude as Flight Level
/TP: Aircraft Type
/SK: Sky Cover (may include cloud height and coverage)

Understanding Weather Reports
/WX: Weather Phenomenon (can include flight visibility, precipitation and restrictions to visibility.
/TA: Outside air temperature at altitude in degrees Celsius.
/WV: Wind (direction in degrees magnetic north and speed in knots)
/TB: Turbulence (refer to the Airman???s Information Manual) CAT - Clear Air Turbulence
CHOP - Choppy Turbulence OCNL - Occasional
NEG - No Turbulence ABV - Above
BLO - Below
LGT - Light - Momentarily causes slight, erratic changes in altitude and/or attitude.
MOD - Moderate - Greater intensity changes in altitude and/or attitude, but aircraft remains in positive control at all times. Usually causes changes in indicated airspeed.
SEV - Severe - Causes large and abrupt changes to aircraft altitude and/or attitude. Large variations in indicated airspeed and momentary loss of control.
EXTRM - Extreme - Aircraft is violently tossed about and is nearly impossible to control. May cause structural damage.
/IC: Icing (refer to the Airman???s Information Manual) CLR - Clear
MX - Mixed (combination of rime and clear icing) NEG - No Icing
ABV - Above
BLO - Below
Trace - Ice becomes perceptible. Rate of evaporation is almost equal to the rate of accumulation.
LGT - Light - Rate of accumulation may be a problem if flight is prolonged for longer than 1 hour without
MOD - Moderate - The rate of accumulation is such that even short encounters become potentially hazardous. Use of
SEV - Severe - Flight diversion is necessary. Deicing/anti- icing equipment is not effective.
2 Section
Operation FIS
Understanding Weather Reports
/RM: Remarks (for reporting elements not included or to clarify pre- viously reported items). Remarks can include anything. The example translates to ???moderate (MDT) mixed (MXD) icing during climb (DURGC) from Roanoke, VA (KROA) northwestbound (NWBND) between Flight Level 080 and 100 (FL080100) at
1750Z???.
FIS Operation
Section 2
UNDERSTANDING AIRMETS
The following is an example of a typical AIRMET with an explanation of the elements.
1 2 3 4
CHIT
 WA
WA
 151900
 AMD
AMD
5  AIRMET TANGO UPDT 2 FOR TURB
6 
 VALID UNTIL 160100
7
 AIRMET TURB...KS MO
8
 FROM MCI TO STL TO SGF TO ICT TO MCI
9
 MOD TURB BLW 100 EXPCD
10
 CONDS IPVG AFT 160000Z
1.Forecast Area: CHIT
This is the forecast area identifier of the issuing Weather Service Forecast Office.
BOS Boston CHI Chicago
DFW Dallas/Ft. Worth MIA Miami
SFO San Francisco SLC Salt Lake City
The T denotes the reason for the AIRMET. This could be one of the following:
AIRMET items are considered widespread. Widespread is consid- ered an area ??? 3,000 square miles.

Understanding Weather Reports
2.Report Type: WA
WA identifies an AIRMET.
3.Date and Time Issued: 151900
15 indicates the 15th day of the month. 1900 indicates UTC.
NOTE: AIRMETs may be issued up to 15 minutes prior to the start of the validity period. The FIS system will display the data age as zero until the start of the validity period.
4.AMD indicates an amended report. Reports can be amended due to changing weather conditions or issuance/cancelation of a SIGMET. COR in this field would indicate a corrected AIRMET. RTD indicates a delayed AIRMET.
5.This line indicates that there is a second (2) update (UPDT) to this AIRMET issued for turbulence (FOR TURB). More than one meteo- rological condition may be addressed as shown in the following:
FOR IFR AND MTN (mountain) OBSCN (obscuration)
FOR ICE AND FRZLVL (freezing level)
FOR STG (strong) SFC (surface) WINDS AND LLWS (low
level wind shear)
6.This updated AIRMET is valid until 0100 UTC on the 16th day (16) of the month. An AIRMET does not contain an explicit validity start time.
7.This AIRMET forecasts turbulence (TURB) for the states of KS (Kansas) and MO (Missouri). Geographic areas are also covered such as CSTL WTRS (coastal waters). Other geographic abbrevia- tions are used as well (see Appendix A).
8.The affected area is defined by lines FROM MCI (Kansas City) TO STL (St. Louis) TO SGF (Springfield) TO ICT (Wichita) and back TO MCI. Areas can be defined by lines between points which are air- port or navaid identifiers.
9.Moderate (MOD) turbulence (TURB) below (BLW) 10,000 feet expected (EXPCD).
10.Conditions (CONDS) improving (IPVG) after (AFT) the 16th day (16) of the month 0000 UTC.
If conditions end more than one hour prior to the indicated expiration time, an amended AIRMET will be issued stating it???s cancellation. If con- ditions end within one hour of the indicated expiration time, the AIRMET will be allowed to expire without cancellation. Once the report is can- celled or expires, the FIS system no longer broadcasts the report.
2 Section
Operation FIS

FIS Operation
Section 2
Understanding Weather Reports
UNDERSTANDING SIGMETS
The following is an example of a typical SIGMET issued for turbulence with an explanation of the elements.
1 2 3
CHIR
 UWS
UWS
 041430
4  SIGMET ROMEO 1 VALID UNTIL 041830
5
 KY TN WV VA OH
6
 FROM CVG TO EKN TO PSK TO VXV TO CVG
OCNL SEV TURB BTN 300 AND 360. RPRTD BY AIRCRAFT.
7CONDS CONTG BYD 1830Z.
8
 SLM/GTB
1.Forecast Area: CHIR
This is the forecast area identifier of the issuing Weather Service Forecast Office.
BOS Boston CHI Chicago
DFW Dallas/Ft. Worth MIA Miami
SFO San Francisco SLC Salt Lake City
The R denotes report ROMEO. A new alphabetic designator is given each time a SIGMET is issued for a new weather phenom- enon. The order of issuance is as follows:
N NOVEMBER
O OSCAR
P PAPA
Q QUEBEC
R ROMEO
U UNIFORM
V VICTOR
W WHISKEY
X XRAY
Y YANKEE
SIGMETs are issued for:
Severe icing not associated with thunderstorms
Severe or extreme turbulence or clear air turbulence (CAT) Dust storms or sandstorms lowering visibilities to < 3 miles Volcanic ash
2.Report Type: UWS

Understanding Weather Reports
UWS indicates this is the first issuance of report ROMEO. Subsequent reports for ROMEO would display WS.
3.Date and Time Issued: 041430.
04 indicates the 4th day of the month. 1430 indicates UTC.
4.This line indicates that SIGMET ROMEO 1 is VALID UNTIL the 4th day (04) of the month at 1830 UTC.
Each subsequent report issued for this same weather phenomenon designated ROMEO would increment the number. For example, ROMEO 2, ROMEO 3 and so on.
5. Area of coverage by state or geographic area. In addition to state abbreviations, other area abbreviations may be seen here, such as, TX CSTL WTRS (Texas Coastal Waters).
6. Location of weather phenomenon. Three letter designators for navaids or airports are used to describe boundaries of coverage. If the weather phenomenon extends across multiple forecast areas, the location is described as if no boundaries exist.
7. Details of weather phenomenon. The example is typical of a syn- opsis for turbulence:
OCNL (occasional) SEV (severe) TURB (turbulence) BTN (between) 300 (30,000 feet) AND 360 (36,000 feet). RPRTD (reported) BY AIRCRAFT. CONDS (conditions) CONTG (contin- uing) BYD (beyond 1830Z.
More typical examples of descriptors used in other SIGMET weather phenomenon are as follows:
MOD (moderate) TO
STG (strong) UDDFS (updrafts and downdrafts) UPDFTS (updrafts)
DWNDFTS (downdrafts)
INVOF (in vicinity of) MTNS (mountains) BLO (below) 360
BTWN (between) FRZLVL (freezing level) AND 360 ABV (above) 360
RPRTD (reported) BY ACFT (aircraft) IN VCNTY (vicinity) RPRTD BY SVRL (several) ACFT
8. Issuers initials.
If conditions end more than one half hour prior to the indicated expiration time, and the report does not state that conditions will continue, a cancel- lation will be issued with CNCL SIGMET as the report designator. If con- ditions are expected to continue, a new SIGMET will be issued. If condi- tions end within one half hour of the indicated expiration time, the SIGMET will be allowed to expire without cancellation. Once the report is cancelled or expires, the FIS system no longer broadcasts the report.
2 Section
Operation FIS

FIS Operation
Section 2
Understanding Weather Reports
UNDERSTANDING CONVECTIVE SIGMETS
The following is an example of a typical Convective SIGMET with an explanation of the elements.
1 2 3
MKCC
 WST
WST
 221855
4  CONVECTIVE SIGMET 20C
5 
 VALID UNTIL 2055Z
6
 ND SD
ND SD
7
 FROM 60W
INTSFYG AREA SVR TSTMS MOVG FROM 2445. TOPS ABV FL450.
8WIND GUSTS TO 60KT RPRTD. TORNADOES???HAIL TO 2 IN???WIND
GUSTS TO 65KT PSBL ND PTN.
1.Station Identifier: MKCC
MKC is the station identifier of the Aviation Weather Center (AWC) in Kansas City.
The C denotes the report is for the Central portion of the continental United States. The choices are as follows:
C Central E East W West
Convective SIGMETs are issued for:
Severe weather including: (a)Surface winds ??? 50 knots,
(b) Surface hail ??? 3/4 inch in diameter or (c) Tornadoes
Embedded thunderstorms (obscured by haze or other phenomena)
Line of thunderstorms
Thunderstorms ??? VIP level 4 affecting ??? 40% of an area ??? 3000 sq. mi.
2.Report Type: WST
WST indicates this is a convective SIGMET.
3.Date and Time Issued: 221855.
22 indicates the 22nd day of the month. 1855 indicates UTC.
4.This line is the identifying number of the Convective SIGMET. Numbering begins daily at 0000 UTC. The C denotes the Central portion of the country.

Understanding Weather Reports
5.This line indicates that CONVECTIVE SIGMET 20C is VALID UNTIL 2055Z time. Expiration time is two hours after issuance, but Convective SIGMETs are issued hourly and replace the previous hour???s product.
Each subsequent report issued for this same weather phenomenon would increment the number. For example, 21C, 22C and so on.
6. Area of coverage by state ND (North Dakota) and SD (South Dakota) or geographic area. In addition to state abbreviations, other area abbreviations may be seen here, such as FL CSTL WTRS (Florida Coastal Waters).
7. Location of weather phenomenon (may be an area, single cell or line). Three letter designators for navaids or airports are used to describe boundaries of coverage.
The starting and ending point are identical for an area of thunder- storms, like this: FROM 90W
A Single Cell thunderstorm 35 nm west of Kansas City would look like this: 35WMKC
A Line of severe thunderstorms would look like this: FROM 90SE
8. Details of weather phenomenon. Convective SIGMET details are mostly in plain language with some abbreviations. This example is typical for an area of severe thunderstorms:
INTSFYG (intensifying) AREA (of) SVR TSTMS (severe thunder- storms) MOVG (moving) FROM 2445 (240 degrees at 45 knots). Storm TOPS ABV (above) FL450 (flight level
(inches in diameter)???WIND GUSTS TO 65 KT (knots) PSBL (pos- sible) in the ND PTN (North Dakota portion).
For a single cell thunderstorm:
ISOLD (isolated) SVR TSTM (severe thunderstorm) D30 (30 nm in diameter) MOVG (moving) FROM 2520 (250 degrees at 20 knots). Storm TOPS ABV (above) FL450 (flight level
For a line of thunderstorms 25 nm wide:
LINE (line of) SVR TSTMS (severe thunderstorms) 25 MI WIDE MOVG (moving) FROM 2745 (270 degrees at 45 knots). Storm
2 Section
Operation FIS

Understanding Weather Reports
TOPS ABV (above) FL450 (flight level
(inches in diameter)???WIND GUSTS TO 65 KT (knots) PSBL (pos- sible).
UNDERSTANDING ALERT WEATHER WATCHES (AWW)
The following is an example of a typical Alert Weather Watch with an explanation of the elements.
2
1 2 3
SPC
 AWW
AWW
 162236
5
FIS Operation
Section
4  WW 1162
 SEVERE TSTM MS AL FL AND ADJ CSTL WTRS
6 
 162300Z - 170400Z
AXIS..75 STATUTE MILES NORTH AND SOUTH OF LINE..
7
45SW MOB/MOBILE AL/ - 30SSE DHN/DOTHAN AL/
8
 ..AVIATION COORDS.. 65NM N/S /37SW MOB - 51WNW TLH/
9HAIL SURFACE AND ALOFT..1 1/4 INCHES. WIND GUSTS..60 KNOTS. MAX TOPS TO 400. MEAN WIND VECTOR 23035.
1.Station Identifier: SPC
SPC is the station identifier for the Storm Prediction Center in Norman, Oklahoma.
AWWs are issued for:
Tornado
Damaging winds or winds > 58 knots
Hail ??? 3/4 inch in diameter.
2.Report Type: AWW
AWW indicates this is an Alert Weather Watch.
3.Date and Time Issued: 162236.
16 indicates the 16th day of the month. 2236 indicates UTC.
4.WW 1162 is the identifying number of the Alert Weather Watch. Numbering begins yearly at 0000.
5.This line indicates the type of weather and the affected areas. SEVERE TSTM (severe thunderstorm) for MS (Mississippi) AL (Alabama) FL (Florida) AND ADJ CSTL WTRS (adjacent coastal waters).
6.This line indicates that the watch is valid from 162300Z - 170400Z

Understanding Weather Reports
(the 16th at 2300 Zulu to the 17th at 0400 Zulu).
7. Coordinates of the watch box area. Draw a line 75 STATUTE MILES NORTH AND SOUTH OF A LINE.. The endpoints of the line are 45SSW MOB/MOBILE
EITHER SIDE OF A LINE..
8. Aviation coordinates of the watch box area. Draw a line 65NM N/S / (65 nautical miles north and south) of a line). The endpoints of the line are 37SW MOB - 51WNW TLH/ (37 nautical miles southwest of Mobile, Alabama and 51 nautical miles
9. Details of the forecast weather. AWW details are mostly in plain lan- guage with some abbreviations. This is an example of a typical product.
HAIL SURFACE AND ALOFT..1 1/4 INCHES (hail diameter poten- tial of one and one quarter inches) WIND GUSTS..60 KNOTS (wind gust potential of 60 knots) MAX TOPS TO 400 (maximum tops of the storms is 40,000 feet). MEAN WIND VECTOR 23035 (motion of storm is 230 degrees at 35 knots).
2 Section
Operation FIS

Understanding Weather Reports
FIS Operation
Section 2
Intentionally left blank

Introduction
SECTION 3
TRAFFIC AVOIDANCE OPERATION
INTRODUCTION
The Traffic Function of the Bendix/King KMD 250 Multi Function Display allows for the display and control of one of several models of traffic avoidance systems. Some examples are TCAS I (Traffic Collision Avoidance System), TCAS II, TAS (Traffic Avoidance System) and TIS (Traffic Information Service).
This section describes the operation of the KMD 250 display for control- ling the display of traffic. For detailed information on the proper use and interpretation of the displayed traffic data when using TCAS I, TCAS II and TAS systems, please reference the pilot???s guide that is provided with the traffic avoidance system.
An active traffic avoidance system (TCAS I, TCAS II or TAS) is used for detecting and tracking aircraft near your own aircraft. Aircraft detected, tracked, and displayed are referred to as Intruders. Intruders are shown as symbols on the traffic display. The system identifies the relative threat of each Intruder by using various symbols and colors. The intruder???s altitude, relative to your own aircraft???s altitude, is annunciated if the Intruder is reporting altitude. A trend arrow is used to indicate if the Intruder is climbing or descending more than 500 feet per minute.
The passive Traffic Information Service (TIS) is a data link service that provides information similar to VFR radar traffic advisories normally received over voice radio. The data is received from the terminal Mode S radar system through a TIS capable Mode S transponder to the KMD display once per radar scan (approximately every 5 seconds).
TIS provides the relative position, relative altitude, altitude trend, and estimated ground track angle for as many as 8 intruders that are within 7 NM horizontally and
ATC procedures and the ???see and avoid concept??? will continue to be the primary means of ensuring aircraft separation. However, if communica- tion is lost with ATC, TCAS/TAS/TIS adds a significant backup for colli- sion avoidance.
Introduction
The Bendix/King KMD 250 is shown below with the Traffic Page for TAS/TCAS selected.
The Bendix/King KMD 250 is shown below with the Traffic Page for TIS selected.
TRAFFIC FUNCTION STATUS ICONS
The Traffic Function Status Icons are located in the lower left of the dis- play. They are used to indicate whether or not the KMD 250 is currently receiving and/or displaying traffic information. The following table shows the various traffic icons and their meanings:

TAS/TCAS
TAS/TCAS
This section applies to TAS, TCAS I and TCAS II systems.
TAS/TCAS NORMAL OPERATION
To display the TCAS/TAS traffic page press the TRFC function select key.
The following illustration defines the data that appears on the TAS/TCAS Traffic Display Page:
3
2
1
8
9
1 Display Range - RNG:####.
2Function Status Icons - Displays icons representing data available and displayed.
3 Current Flight Level - FL ###
4 Altitude Volume - Current Altitude Volume selection is displayed in this field.
5Range Rings - Outer ring radius is selected range, inner ring radius is always 2 nm.
6 Active Flight Plan
7 Aircraft Symbol - Indicates present position.
8Altitude Volume Softkey - When the ALTITUDE VOLUME softkey is pressed, the display will step through NORMAL, ABOVE, BELOW and UNRESTRICTED.
9Flight Level Softkey - Pressing FLIGHT LEVEL toggles the Flight Level display on or off.
10Traffic Intruder Symbols - Indicates type of traffic, altitude of traffic, vertical trend of traffic and ground track of traffic.
11
12System ON/SBY/TST - Rotary Knob selects system ON,SBY (standby) or TST (test).
13Page Display Name
14System Operating Mode - If using a TAS system, TAS TST, TAS SBY, TA ONLY or TAS FAIL will be displayed. If using a TCAS system, TCAS TST,
TCAS SBY, TA ONLY, TA/RA, or TCAS FAIL will be displayed.

Traffic Avoidance
TAS/TCAS
OPERATIONAL CONTROLS FOR TAS/TCAS
ALTITUDE VOLUME - Toggles between altitude volume views of NORMAL,
ABOVE, BELOW or UNRESTRICTED.
This key may be enabled or disabled in system configuration.
FLIGHT LEVEL - Pressing the MENU Key will display the FLIGHT LEVEL Softkey. Pressing this key toggles the alti- tude tag between relative or absolute alti-
tude as shown in Figures
This feature may be enabled or disabled in system configuration. See note below.
NOTE: If FLIGHT LEVEL or ALTITUDE VOLUME Soft Keys or the
Rotary Knob are not active, these controls will be found on the separate TAS/TCAS controller.
DISABLE
able in these circumstances. This key may be enabled or disabled in system configuration.
RNG???/RNG??? - Advances the indicator to the next range. The upper button increases range, the lower button decreases it. The selected range is displayed in the lower left corner of the display with the inner range ring always 2 nm. The RNG button labels will not be displayed when their respective range limits are reached.
Rotary Knob - Selects between Test (TST), Standby (SBY) and On mode of operation. This control may be enabled or disabled in system configuration. If the KMD 250 is used with a TCAS II or

TAS/TCAS
TAS/TCAS SYMBOLOGY
An open white diamond indicates that an intruder is not yet considered a threat. For specifics on relative distance and altitude that defines this symbol, please refer to the pilot???s
guide that is provided with the traffic avoidance system. This one is 200 feet above your own altitude, climbing at 500 feet per minute or greater.
PROXIMITY INTRUDER TRAFFIC
A filled white diamond indicates that the intruding aircraft has reached the next proximity threshold defined by the traffic avoidance system, but is still not considered a threat. For specifics on relative distance and altitude that defines this symbol, please refer to the pilot???s guide that is provided with the traffic avoidance system.This intruder is now 400 feet below your aircraft and climbing at
500 feet per minute or greater.
TRAFFIC ADVISORY (TA)
A symbol change to a filled yellow circle indicates that the intruding aircraft is considered to be potentially hazardous. Depending on your own altitude the system will display a TA when time to Closest Point of Approach (CPA) is reached as defined by
traffic avoidance system. For specifics on CPA as defined by the system, please refer to the pilot???s guide that is provided with the traffic avoidance system. Here the intruder is 100 feet above your aircraft, descending at 500 feet per minute or greater.
RESOLUTION ADVISORY (RA)
This symbol will only be displayed when the KMD 250 is inter- faced with a TCAS II system. A solid red square indicates that the intruding aircraft is projected to be a collision threat. TCAS

TAS/TCAS
II calculates that the intruder has reached a point where a Resolution Advisory is necessary. The time to CPA with the intruder, depending on your altitude, has been reached as defined by the traffic avoidance system. For specifics on CPA as defined by the system, please refer to the pilot???s guide that is provided with the traffic avoidance system. The symbol appears together with an appropriate audio warning and a vertical maneuver indication on the RA/VSI. This aircraft is now 100 feet below your altitude and still descending at 500 feet per minute or greater.
NOTE: An intruder must be reporting altitude in order to generate an RA. Therefore, the RA symbol will always have an altitude tag.
TA or RA traffic that is beyond the selected range will be displayed as half the appropriate symbol at the edge of the display matching the bearing of the traffic.
TRAFFIC
If the bearing of TA or RA traffic cannot be determined by the traffic avoidance system, no traffic symbol will be dis- played on the TRFC display. The traffic information will instead be displayed in the lower center of the display as shown in Figure
and/or RA intruders can be displayed. If the intruder is not reporting alti- tude, the altitude and trend arrow fields will be blank.
NOTE:
TA/RA WHILE IN MAP
OR WEATHER DISPLAY
If a Traffic Advisory presents itself while in the Map or Weather Display the traffic function icon in the Functions Legend will flash yellow along
with ALERT as represented in Figure

If
To enable
1. While viewing the Traffic Display, press the MENU Key to display the ENABLE POP- UP Softkey as shown in Figure
ABLE
VIEWING TRAFFIC IN A
DATA FIELD
Traffic may be selected for viewing in a Data Field as shown in Figure
Traffic will not be available in the Data Field if the Map Orientation is set to North Up. If the Map Display is in North Up mode, the Traffic Data Field will appear as shown in Figure
Figure
Figure
Figure
TAS/TCAS
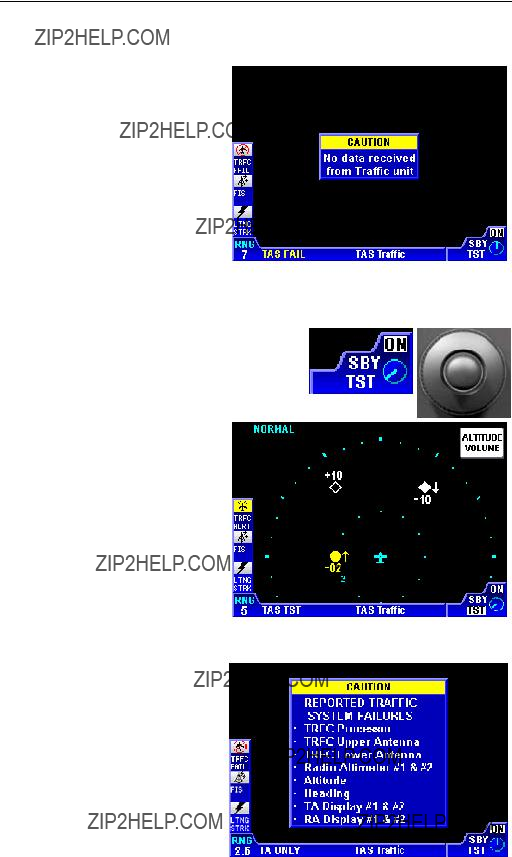
TAS/TCAS
Figure
Figure
KMD 250 Pilot???s Guide

Traffic Information Service
TRAFFIC INFORMATION SERVICE (TIS)
This section applies only to TIS systems.
TIS is an alerting system that provides visibility to nearby traffic enhancing ???see and avoid??? collision avoidance. It???s purpose is to increase situational awareness by supplying information to assist in visu- ally acquiring nearby aircraft. TIS does not relieve the pilot of ???see and avoid??? responsibility. No avoidance maneuvers are provided or recom- mended by TIS.
The service is offered through the Federal Aviation Administration???s Mode S terminal sensors and uses the same surveillance information provided to ATC. Estimated bearing, distance, altitude and heading information for aircraft within 7 NM and
TIS
ALGORITHMS
KT 73 Mode S
Target aircraft are displayed only if operating a Mode A, C or S transponder. TIS operation is transparent to ATC and requires no con- troller intervention.
When the onboard TIS system makes a request for TIS, the request is sent via the Mode S transponder through the datalink. The first available Mode S sensor capable of supporting TIS for your aircraft responds by sending data back through the datalink on every scan of the sensor (approximately every 5 seconds). TIS will be provided by the sensor as long as the aircraft is within coverage range of that sensor. When entering the coverage range of another sensor, TIS will continue pro- vided the next sensor is TIS capable. The transfer of service is auto- matic. In addition to traffic data, the aircraft receives status messages that advise the pilot when TIS service has been initiated, is continuing, or has been terminated.
While coverage varies with terrain and local site parameters,

Traffic Information Service
TIS LIMITATIONS
Traffic may not be displayed for one or more of the following reasons:
1.Radar site is out of service. If a TIS capable Mode S sensor is not in service for any reason, TIS is not available. See Figure
2.Your aircraft is beyond maximum range of a TIS capable Mode S site. Maximum range can extend beyond 55 NM up to 100 NM. However, expect TIS service to 55 NM. See Figure
Figure
Radar Coverage
Dead Zones
Range
RadarVaries
Figure
3. Your aircraft is inside the ???Cone of Silence. When near or above (depending on altitude) the TIS radar site, and out of range of another TIS radar site, TIS data cannot be received. See Figure

Traffic Information Service
4.The other aircraft is within the ???Cone of Silence???. So, remember, there may be aircraft within your alert area, but if they are not seen by the radar site they will not show on your display.
5.Your aircraft is below radar coverage. With no obstructions and flat terrain, the coverage floor is about
???Cone of Silence???
Radar Coverage
Dead Zones
Figure
6.The other traffic is below radar coverage. The other aircraft may be in situations mentioned in number 5 and therefore not seen by radar. Again, there may be aircraft within your alert area, but if they are not seen by the radar site they will not show on your display.
7.The other aircraft is without an operating a Mode A, C or S transponder.
8.Bearing error increases as the distance from the radar site increases. However, distance and relative altitude will remain accurate.
9.Due to the way the radar sites check for transponder faults, a reply can be interpreted as two different aircraft. This causes a ???self alert???. This is shown as a
NOTE: It is important to understand that no display or aural warning of traffic information shows the location of all traffic in the vicinity. Whenever in VMC conditions, continue to visually scan for traffic.
NOTE: Pilots should report TIS outages to Flight Service which will report them to the Airway Facilities Operations Control Centers for reso- lution, similar to a report of any other system outage.
Traffic Information Service
TIS NORMAL OPERATION
NOTE: TIS availability may be intermittent during turns or other maneu- vering where the aircraft structure can block the line of sight between the Mode S radar and the Mode S transponder antenna.
To display the TIS traffic page press the TRFC Function Select Key.
The following illustration defines the data that appears on the TIS Traffic Display Page:
2 Function Status Icons - Displays icons representing data available and displayed.
3Range Rings - Outer ring radius is selected range, inner ring radius is always 2 nm.
4 Current Flight Level - FL:###
5Audio Muting - When audio muting is turned on by pressing the ENABLE MUTE Softkey, TIS Mute ON will be displayed in this field.
6Heading - Current aircraft magnetic heading (HDG) or ground track (TRK). If no heading or track information is available, the the field displays NO HDG/TRK.
7 Active Flight Plan
8Traffic Intruder Symbols - Indicates type of traffic, altitude of traffic, vertical trend of traffic and ground track of traffic.
9Flight Level Softkey - Pressing FLIGHT LEVEL toggles the Flight Level display on or off.
10Aircraft Symbol - Indicates present position.
11Audio Mute Softkey - Pressing the MENU Key will display the muting softkey. Pressing this softkey will toggle between DISABLE MUTE and ENABLE MUTE.
12
13System ON/OFF - Rotary Knob selects TIS ON or OFF.
14Page Display Name
15TIS Operating Mode - Displays TIS ON, TIS OFF or TIS FAIL.

Traffic Information Service
TIS OPERATIONAL CONTROLS
FLIGHT LEVEL - Pressing the MENU Key will display the FLIGHT LEVEL Softkey. Pressing this key toggles the alti- tude tag between relative or absolute alti-
tude as shown in Figures
AUDIO MUTE - The ???TIS Unavailable??? audio notification may be muted by pressing the ENABLE MUTE Softkey.
When enabled TIS Mute ON will be dis- played in the upper left of the screen. The DISABLE MUTE Softkey will then be available to disable the audio muting. The audio traffic alerts are not affected.
DISABLE
may be enabled or disabled in system configuration.
RNG???/RNG??? - Advances the indicator to the next range. The upper button increases range, the lower button decreases it. The selected range is displayed in the lower left corner of the display with the inner range ring always 2 nm. The RNG button labels will not be displayed when
their respective range limits are reached.
Rotary Knob - Turns the TIS system On or OFF.

Traffic Information Service
TIS SYMBOLOGY
TIS symbols have a track pointer which are not on TCAS/TAS symbols. The track pointer shows the estimated ground track direction the traffic is moving (in 45?? increments) relative to your own aircraft.
PROXIMITY INTRUDER TRAFFIC
A filled white diamond indicates that the intruding aircraft has reached the proximity traffic threshold as defined by the TIS system, but is still not considered a threat. This intruder is now 100 feet below your aircraft and flying level. The track pointer on the diamond indicates the direction of the intruder???s
ground track. Here the intruder is moving approximately 45?? to your cur- rent track or heading.
PROXIMITY INTRUDER
(NAR)TRAFFIC
An open white diamond indicates proximity traffic that is non- altitude reporting. The symbol indicates that the intruder???s ground track is approximately 90?? to your current track or heading.
TRAFFIC ADVISORY (TA)
A symbol change to a filled yellow circle indicates that the intruding aircraft is considered to be potentially hazardous. Depending on your own altitude the system will display a TA when time to Closest Point of Approach (CPA) is reached as defined by the TIS system. Here the intruder is 100 feet
above your aircraft. The arrow indicates the intruder is descending at 500 feet per minute or greater. The intruder is moving at approximately 180?? to your current track or heading
TRAFFIC ADVISORY
An open yellow circle indicates that the intruding aircraft is considered to be potentially hazardous and is not reporting altitude. Here the intruder is moving at approximately 225?? to your current track or heading.
TA traffic that is beyond the selected range will be displayed as half the appropriate symbol at the edge of the display matching the bearing of the traffic.

Traffic Information Service
TRAFFIC ADVISORY
WHILE IN MAP DISPLAY
If a Traffic Advisory presents itself while in the Map or Weather Display the traffic function icon in the Functions Legend will flash yellow along with ALERT as represented in Figure
If
To enable
1. While viewing the Traffic Display, press the MENU Key to display the ENABLE POP- UP Softkey as shown in Figure
ABLE
VIEWING TRAFFIC IN A
DATA FIELD

Traffic Information Service
Traffic will not be available in the Data Field if the Map Orientation is set to North Up. It the Map Display is in North Up mode, the Traffic Data Field will appear as shown in Figure
COAST MODE
Figure
Figure
Figure
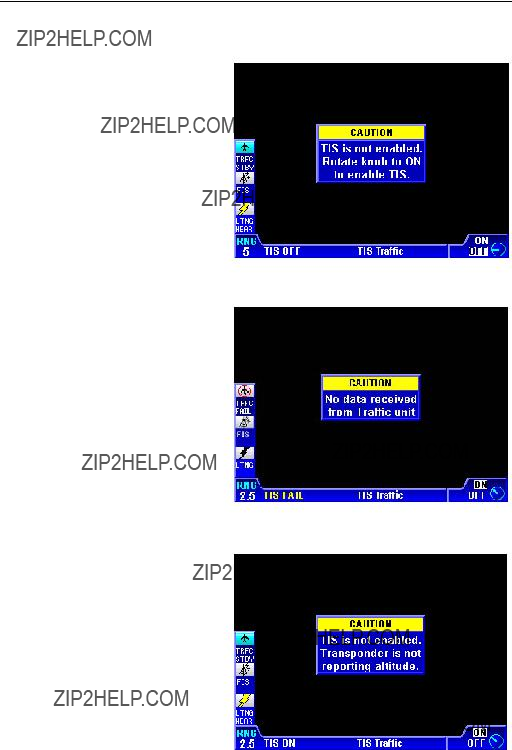
Traffic Information Service
TIS SYSTEM FAULTS
SYSTEM OFF
If the TIS system is set to the OFF position, Figure
Figure
NO DATA RECEIVED
If the KMD 250 is not receiving data from the TIS receiver then Figure
Figure
TRANSPONDER NOT
REPORTING ALTITUDE
If the transponder???s altitude source has failed or the transponder is put into a non- altitude reporting mode, Figure
Figure


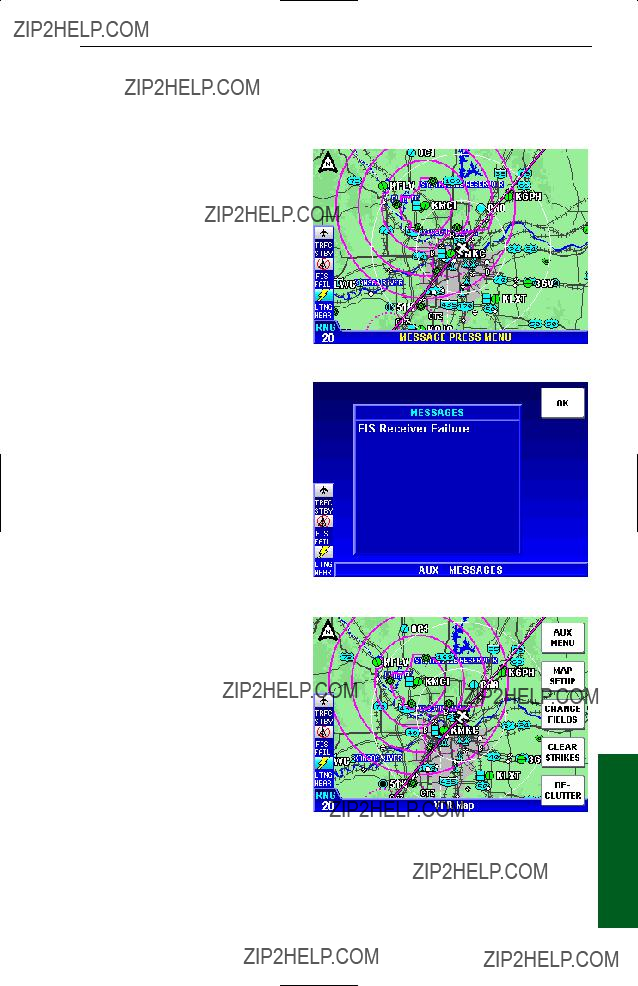

System Messages
2.Press the AUX MENU Softkey to display the AUX- MAIN MENU Page as shown in Figure
3.Use the Joystick to select Messages as shown in Figure
4.Press the SELECT Softkey to display to display the
Figure


System Messages
Unit History Data Cleared To A problem was detected in the memory used to store unit history informa- Defaultstion. The memory has effect on operation, it simply means less informa-
tion will be available to the service center if the unit requires service.


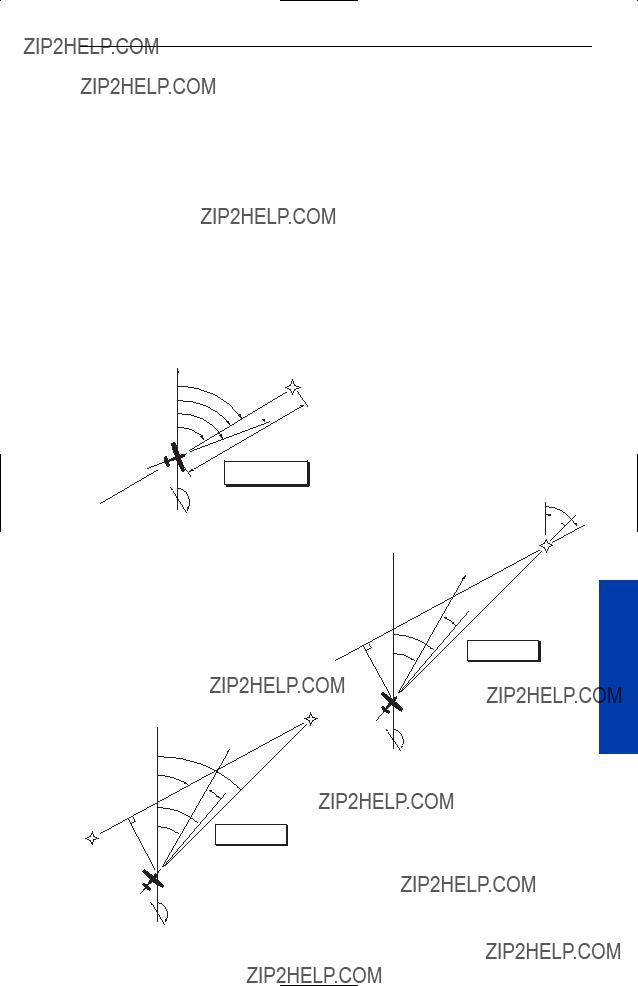


 WPT 1
WPT 1 DA
DA