Training Guide
Publication Number
First Edition, November 1997
For Safety information, Warranties, and Regulatory information, see the pages behind the Index.
??? Copyright
Training Kit for
HP 1660/70 Series Logic Analyzers
Training Guide
Publication Number
First Edition, November 1997
For Safety information, Warranties, and Regulatory information, see the pages behind the Index.
??? Copyright
Training Kit for
HP 1660/70 Series Logic Analyzers
Ready, Set, Run:
Easy Steps to Logic Analysis with the HP 1660/70 Series
Start Here
READY With the power off, connect Pod 1 of the analyzer to J1 on the Training Board. For the HP 1660s, Pod 1 is the top cable in the
SET Turn on the analyzer by pressing the power switch near the bottom of the front panel.
The analyzer will take about 15 seconds to boot up.
ii

Introduction
RUN Press the Run key, near the upper right corner of the front panel. You will see the output of an
Output of the
iii
Logic Analysis made easy: a
This training kit will quickly teach you how to use the HP 1660 and HP 1670 Series Logic Analyzers to get your work done. The exercises in this book will teach you how to perform basic timing and state analysis measurements and how to make more complex measurements, such as comparing two state listings, setting up complex state triggers, and making state and timing measurements simultaneously. You will also learn oscilloscope measurements if you are using a logic analyzer that has a
The exercises in this training guide are designed to work with any of the HP 1660 or HP 1670 Series analyzers with some exceptions: the exercise in chapter 5, "Mixed Mode - Correlation of State and Timing Data," will not work with an HP 1663 or HP 1664. Also, you need an analyzer with an internal oscilloscope for chapters 7 and 8. If your analyzer has an oscilloscope, you will see a "CS" after the model number. To do the exercises in chapter 9, you will need an analyzer with an internal pattern generator. If your analzyer has a pattern generator, you will see a "CP" after the model number.
Materials needed
You need the following materials to complete the exercises in this training kit:
???One HP 1660 or HP 1670 Series Logic Analyzer
???This training kit (part number HP
???Probe assembly (part number HP
???One HP 10461A TTL Data Pod
iv

Introduction
Using a Mouse
You can perform all of the exercises in this training kit using a mouse. When an instruction tells you to highlight an item and press the Select key, you can simply point to that item with the mouse pointer and press the left mouse button. When you want to scroll up or down a list, you can press and hold down the right mouse button and move the mouse forward and backward. Remember, to scroll a field, the field must be highlighted and have the knob icon at the top of the field.
With a mouse, some of the
Configuration Disk
This kit includes a disk containing configuration files for the analyzer. The files for each chapter of the training guide set up the analyzer so you can perform an exercise. This allows you to perform the exercises in any order. You do not need to use the configuration files to do the exercises if you are working straight through this training guide, chapter by chapter.
Getting Unexpected Results
If you get lost or the results of an exercise seem to be different than this guide indicates, the system may have a previously set configuration that prevents the exercise steps from working properly. To remedy this, you can cycle the power on the analyzer and restart the exercise, or load the configuration files for the exercises you want to do.
v
In This Book
This book will teach you how to set up and make measurements with the HP 1660 Series and HP 1670 Series Logic Analyzers.
You can use this book in two ways: you can start at the beginning and progress chapter by chapter in a building block approach, or you can randomly access the exercises you want to do with minimum setup.
Chapter 1 contains an overview of how to use the analyzer and how to make a measurement.
Chapters 2 through 9 contain measurement exercises designed to be completed quickly and to teach you the skills you need to start making successful measurements in your work environment.
Chapter 10 contains an introduction to inverse assembly.
Chapter 11 contains information about setting the jumpers on the training board and loading the configuration files.
Chapter 12 is a reference chapter describing the training board. It includes a schematic diagram of the training board circuitry.
If you need additional details on the operation of your logic analyzer, refer to the User???s Guide supplied with your system.
vi
Contents
1Using the Analyzer and Understanding the Measurement Process
Using the Analyzer
Understanding the Measurement Process
2Introduction to Timing Analysis
Before You Begin
Put the Analyzer into Timing Mode
Change a Label Name
Modify Channel Assignments
Define a Term for the Timing Trigger
Set Up the Trigger Specification
Trigger on the Term and Examine the Waveform
3 Introduction to State Analysis
Run the State Analyzer and View and Change the State Listing
Create Additional Symbols
Select and View Symbols in the State Listing
4 Comparing State Traces
Before You Begin
Set Up the State Trigger Specification
Run the Analyzer and View the State Listing
Copy the State Listing to the Compare Reference Listing
vii

Contents
Change the Jumper to Acquire a Different State Listing
5Mixed Mode - Correlation of State and Timing Data
Before You Begin
Connect the Timing Analyzer
Put the Analyzer into State and Timing Modes
Change a Label Name and Modify Channel Assignments
Set Up the State Trigger Specification
Enable Time Correlation between the Timing and State Analyzers
View the
6 Advanced State Triggering
7 Using the Oscilloscope
Before You Begin
Connect the Channel 1 Oscilloscope Probe
Zoom and Scroll Through the Clock Waveform
viii

Contents
Measure the Clock Period Manually
Measure the Clock Period with Auto Measure
Read Voltage with the Markers
8Triggering the Oscilloscope with the Timing Analyzer
Before You Begin
Capture the Glitch with the Timing Analyzer and Oscilloscope
9 Using the Pattern Generator
ix

Contents
10 Introduction to Inverse Assembly
Load the Inverse Assembler and Sample Listing
Filter the Captured Data
11 Setting the Jumpers and Loading the Configurations
To Set the Jumpers
To Load a Configuration File
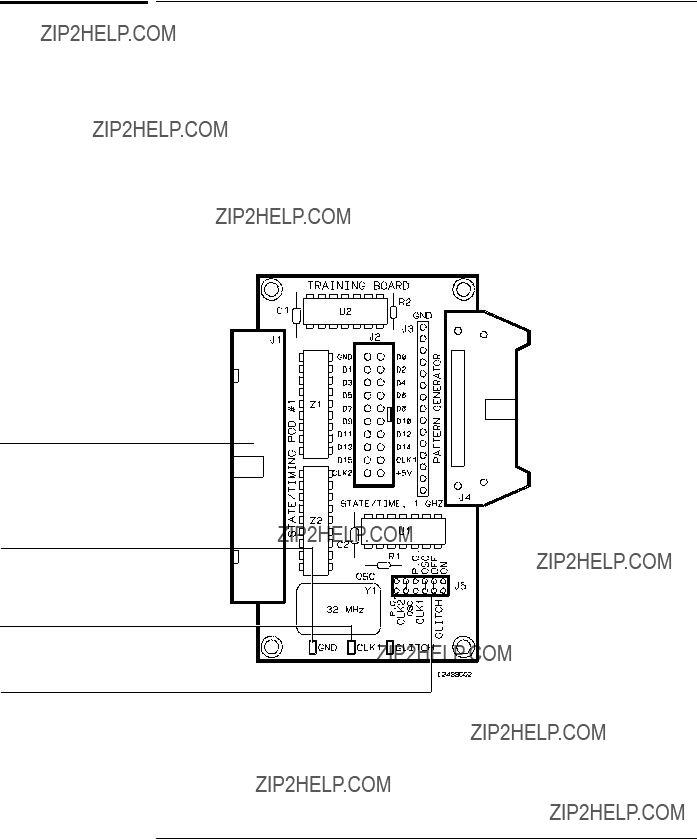
12All About the Logic Analyzer Training Board
Power Source
x
1
Using the Analyzer and
Understanding the
Measurement Process
Using the Analyzer and Understanding the
Measurement Process
This chapter teaches you how to use the HP benchtop analyzer to complete the exercises in this training kit. You will also learn the general process of making a measurement.
You can refer back to this chapter whenever you have problems moving around in the interface or following the measurement process.
In this chapter you will learn how to:
???Highlight a field
???Select a field
???Scroll through lists and menus
???Understand the measurement process
Using the Analyzer and Understanding the Measurement Process
Using the Analyzer
Using the Analyzer
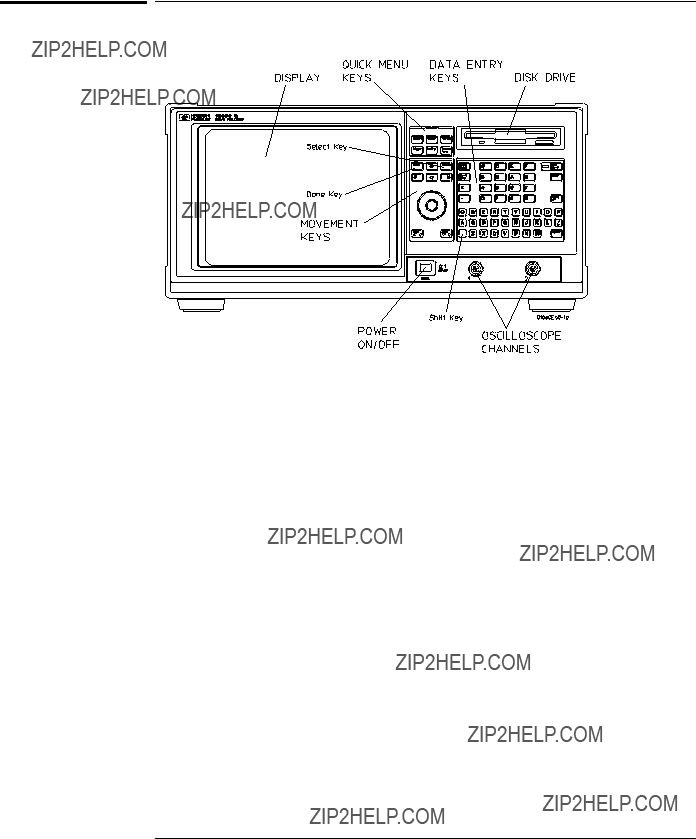
Front Panel
To Highlight a Field
Use the movement keys (???, ???, ???, ???) to move the cursor within and between fields on the display. When the cursor is in a field, the field becomes highlighted.
To Select a Field
Use the the movement keys (???, ???, ???, ???) to highlight the field you want to select, then press the Select key. The type of field highlighted will determine what will happen when the Select key is pressed. If the field is an option field, the Select key brings up an option menu, or if there are only two possible values, the Select key toggles the value in the field. If the highlighted field performs a function, the Select key starts the function. If the highlighted field is a menu choice, the Select key selects the menu choice.
To Scroll Through Lists and Menus
Use the knob to change the value in a field, to scroll the display, and to move the cursor in

Using the Analyzer and Understanding the Measurement Process
Understanding the Measurement Process
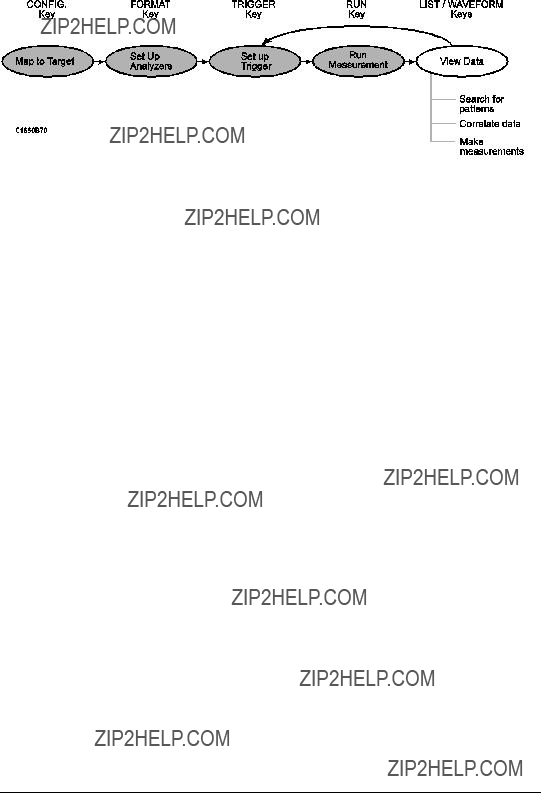
Understanding the Measurement Process
Whenever you make a basic measurement, there is a sequence of events that you will go through. Referring back to this measurement process will help you to better understand the exercises as you complete them.
1 Map to target
Connect probes Connect probes from the target system to the logic analyzer to physically map the target system to the channels in the logic analyzer. Attach probes to a pod in a way that keeps
Set type The analyzer has three modes: the timing analyzer mode, the state analyzer mode, and the system performance (SPA) mode. The exercises in this training kit will teach you about the first two modes, timing and state. The timing mode uses the clock within the analyzer and the state mode uses the clock supplied by the target system. When the logic analyzer is turned on, Analyzer 1 is named Machine 1 and is set to timing mode, and Analyzer 2 is off. To use state analysis, you must set the analyzer mode to state. You can use state and timing modes together, but you can???t set both analyzer modes to timing.
Assign pods In the Analyzer Configuration menu, assign the connected pods to the analyzer you want to use. The number of pods on your logic analyzer depends on the model. Pods are paired and are always assigned as a pair to a particular analyzer.

Using the Analyzer and Understanding the Measurement Process
Understanding the Measurement Process
2 Set up analyzers
Set modes and clocks Set the state and timing analyzer modes using the Analyzer Format menu. In general, these modes trade channel count for speed or storage. If your state clock is set incorrectly, the data gathered by the logic analyzer might indicate an error where none exists.
Group bits under labels The Analyzer Format menu indicates active pod bits. You can create groups of bits across pods or subgroups within pods and name the groups or subgroups using labels.

Using the Analyzer and Understanding the Measurement Process
Understanding the Measurement Process
3 Set up trigger
Define terms In the Analyzer Trigger menu, define trigger variables called terms to match specific conditions in your target system. Terms can match patterns, ranges, or edges across multiple labels.
Configure Arming Control Use Arming Control if:
???you want to correlate the triggers and data of both analyzers
???you want to use the analyzer to trigger an external instrument or the
???you want to use an external instrument or the
Set up trigger sequence Create a sequence of steps that control what the analyzer captures. For common tasks, you can use a trigger macro to simplify the process or use the

Using the Analyzer and Understanding the Measurement Process
Understanding the Measurement Process
4 Run Measurement
Select single or repetitive From any Analyzer or Scope menu, select the field labeled Run in the upper right corner to start the measurement, or press the Run key. A "single" run will run once, until memory is full; a "repetitive run" will run until you select Stop or until a stop measurement condition is fulfilled, which you set in the markers menu.
Using the Analyzer and Understanding the Measurement Process
Understanding the Measurement Process
5 View data
Search for patterns In both the Waveform and Listing menus you can use symbols and markers to search for patterns in your data. In the Analyzer Waveform or Analyzer Listing menu, toggle the Markers field to turn the pattern markers on and then specify the pattern. When you switch views, the markers keep their settings.
Correlate data You can correlate data by setting Count Time in your state analyzer???s Trigger menu and then using interleaving and mixed display. Interleaving correlates the listings of two state analyzers. Mixed display correlates a timing analyzer waveform and a state analyzer listing, or a state analyzer and an oscilloscope waveform, or a state analyzer and both timing and oscilloscope waveforms. To correlate oscilloscope data, the oscilloscope arm mode must be set to Immediate. The System Performance Analysis (SPA) Software does not save a record of actual activity, so it cannot be correlated with either timing or state mode.
Make measurements The markers can count occurrences of events, measure durations, and collect statistics, and SPA provides

2
Introduction to Timing Analysis
Introduction to Timing Analysis
Timing analysis in its simplest form means acquiring and storing data at equal time intervals. When doing timing analysis you must put the logic analyzer into timing mode. An analyzer in timing mode is referred to as a timing analyzer. The timing analyzer???s time interval is controlled by a clock inside the analyzer, just like the clock in a digitizing oscilloscope. However, there are key differences between a timing analyzer and a digitizing oscilloscope. These key differences are channel count and voltage resolution. A logic analyzer typically has a large number of channels, and it displays signals at only two voltage levels, a logic high or a logic low. A digitizing oscilloscope typically has fewer channels, but it can display signals with much finer voltage resolution.
To determine whether a given sample of data should be stored and displayed as a logic high or a logic low, the timing analyzer compares the data to a threshold voltage. The threshold voltage works just like the threshold voltage in logic circuits. If the voltage level of the sampled data is above the threshold, the analyzer stores a logic high (a "1"). If the voltage level of the data is below the threshold, the analyzer stores a logic low (a "0").
The exercises in this chapter step you through the process of making a timing measurement.
In this chapter, you will:
???Put the analyzer into timing mode
???Change a label name
???Modify channel assignments
???Define a term for the timing trigger
???Set up the trigger specification
???Trigger on the term and examine the waveform
Introduction to Timing Analysis
Before You Begin
Before You Begin
1Decide what to do next.
If you have just completed "Ready, Set, Run", go to "Change a Label Name" on page
If you have not just completed "Ready, Set, Run" go to step 2.
2Turn off the analyzer by pressing the power switch. Wait at least five seconds, then press the power switch again to turn on the logic analyzer.
Cycling the power defaults all system settings. This sets up the analyzer so you can perform the remaining exercises.
3Connect Pod 1.
Connect Pod 1 of the analyzer to J1 on the Training Board. For the HP 1660s analyzer, Pod 1 is the top cable in the
4Set the jumpers as shown below.
The jumper settings of J5 on the training board for this chapter are the same as the default settings.
J1
Introduction to Timing Analysis
Put the Analyzer into Timing Mode
If the analyzer is not in timing mode, put it in timing mode now by following the steps below.
1If you are not already in the Configuration menu, press the Config MENU key.
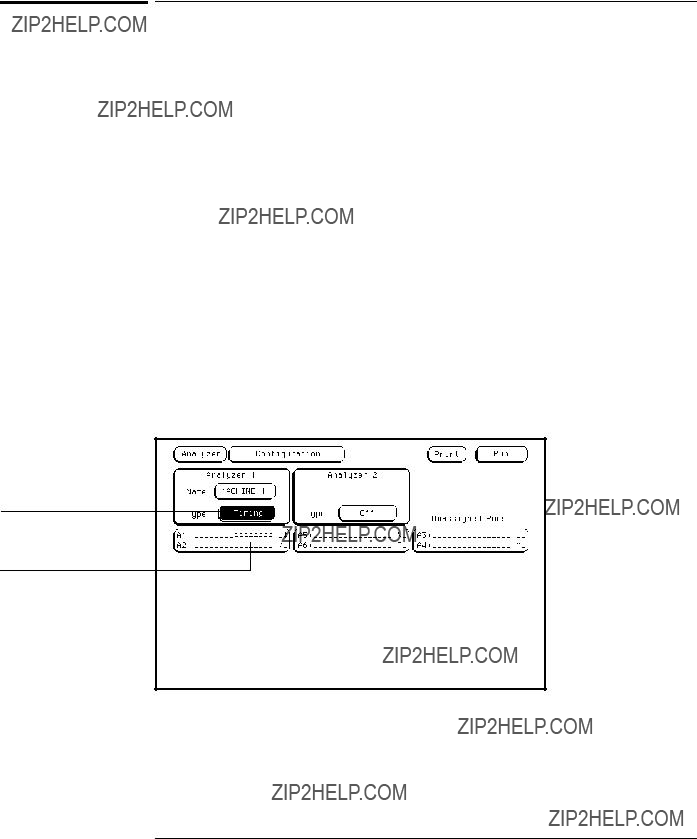
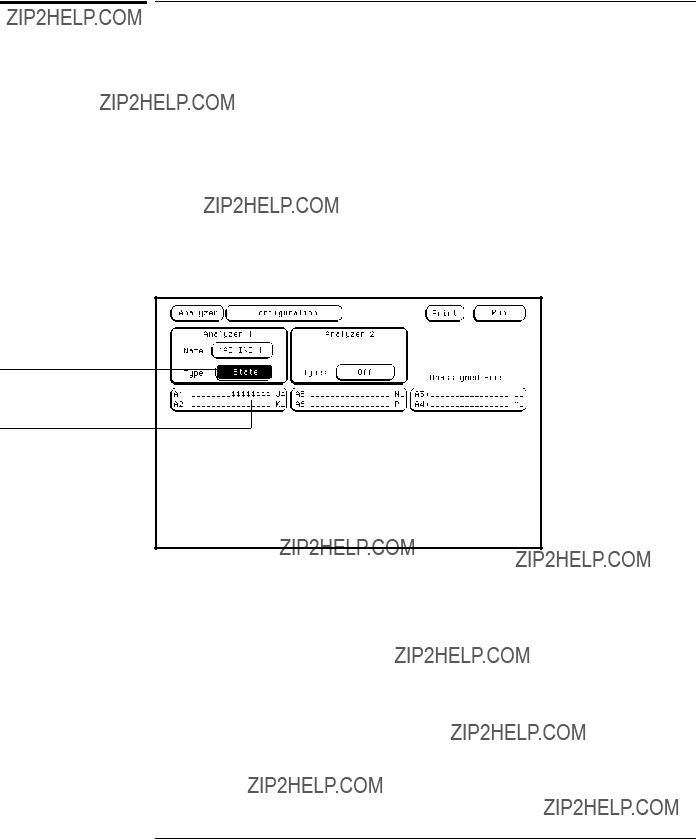
2In the Analyzer 1 box, highlight the field to the right of Type, and press the Select key.
3Highlight Timing in the
Unless your analyzer is an HP 1661 or an HP 1671, your Configuration Menu will look different than the one shown below because your analyzer has a different number of data pods.
The analyzer is in
Timing mode.
Pod A1 has arrows on the lower eight channels and the
Introduction to Timing Analysis
Change a Label Name
Change a Label Name
Labels group channels together. You can rename a label to make it more meaningful. For example, you could use the label name DATA for all of the channels that are connected to the data bus of a microprocessor.
In this exercise, you will change a label name to TCOUNT to represent the timing count data captured from the
1Press the Format MENU key.
2Use the arrow keys (??? ??? ??? ???) to highlight Lab1.
3Type TCOUNT using the keypad on the front panel of the analyzer.
You can use the knob or the left and right arrow keys to backspace the cursor if you need to correct a typing error.
4Press the Done key.

Introduction to Timing Analysis
Modify Channel Assignments
Modify Channel Assignments
In this exercise, you will assign the active bits of pod A1 to the label TCOUNT.
1Using the arrow keys, highlight the field showing the 16 channels of Pod A1, to the far right of the TCOUNT label. Press the Select key.
2Press the Clear Entry key to clear the default bit assignments.
3Use the knob to move the cursor to channel 7 in the
4Press the ???
5Press the Done key.
Pod A1 has 16 channels and is connected to the training board.
An asterisk (*) assigns a channel to a label. In this exercise, the lower eight channels are assigned to TCOUNT.
Modifying Channel Assignments

Introduction to Timing Analysis
Define a Term for the Timing Trigger
Define a Term for the Timing Trigger
For the analyzer to capture the data you want, you need to tell it what to trigger on by defining a term. Trigger terms are variables that you can use to tell the analyzer when to start recording data, what to store, and when to stop.
In this exercise, you will set up the analyzer to trigger when the counter on the training board reaches its maximum value of 255, or FF (hex). To do this, you will assign the hex value FF to term "a" of TCOUNT.
1Press the Trigger MENU key.
2Highlight the base field under TCOUNT and press the Select key.
3Highlight Hex in the
Hex is the default setting. Notice the other display options other than hex.
4Under TCOUNT, highlight the field to the right of term a, enter FF, and press the Done key.
The base field specifies the type of values entered. In this exercise you selected Hex and entered the hex value FF.
A term is a variable that stores a value.

Introduction to Timing Analysis
Set Up the Trigger Specification
Set Up the Trigger Specification
Using the pattern term FF that you set in the previous exercise, you will now set up the analyzer to record the data after FF occurs on the eight channel bus.
1Highlight the 1 field in the Timing Sequence Levels box of the Trigger menu, and press the Select key.
2Highlight the field to the right of Trigger On, and press the Select key.
3Highlight term a and press the Done key.
4Highlight the field to the right of >, and turn the knob to select 16 ns for the pattern duration.
Setting the duration to 16 ns ensures that the analyzer will trigger when the counter on the training board is in a stable state. A shorter duration might cause the analyzer to trigger when the counter is transitioning.
5Press the Done key to close the Timing Sequence Level 1
The trigger term "a" has the hex value FF that you assigned to it.
The pattern duration is set to 16 ns. The value FF must be present for 16 ns before triggering.
Introduction to Timing Analysis
Trigger on the Term and Examine the Waveform
Trigger on the Term and Examine the Waveform
When you press the Run key, the analyzer triggers on the term you set up in the previous exercise, captures the data, and then switches to the Waveform menu where the data is displayed.
1Press the Run key.
2Use the table below to examine the waveform.
To Do This:
To scale the waveform
To scroll through the waveform
To measure a time interval
Do This:
Highlight the sec/Div field, then turn the knob clockwise to zoom in and counter clockwise to zoom out. If you zoom out enough you can view the entire acquisition buffer.
Highlight the Delay field, then turn the knob in either direction to scroll through the data.
Highlight the Markers Off field, then press the Select key. Choose Time from the
Triggering on the Term and Examining the Waveform
As you move the
3 Highlight the Markers Time field. Press the Select key, then select Off.

3
Introduction to State Analysis

Introduction to State Analysis
State analysis in its simplest form means acquiring data and storing it when it is valid for a system under test. When doing state analysis, you must put the analyzer into state mode. The differences between state mode and timing mode are the source of the sample clock and the way the data is displayed. In state analysis, the source of the sample clock is the system under test, rather than the analyzer, and the default display is a sequential listing of logical states, rather than a waveform.
Each time the analyzer receives a state clock pulse, it samples and stores the logic state of the system under test. Just as in the timing analyzer, the state analyzer compares sampled data to a threshold voltage to determine whether it should be stored and displayed as a logic high or a logic low. The analyzer then displays the data as a sequential listing of logical states.
What makes the analyzer more than just a data acquisition instrument is its capability to acquire and store only the data that you specify. This is called data qualification. Examples of storing qualified data include storing only a certain subroutine in a program, storing all data being sent to a specified address in a system, or storing only data leading up to a system failure.
In this chapter, you will:
???Put the analyzer into state mode
???Set up the state clock
???Change a label name and modify channel assignments
???Define a term for the state trigger
???Set up the trigger specification
???Run the analyzer and view and change the state listing
???Create and view symbols
Introduction to State Analysis
Before You Begin
Before You Begin
1Decide what to do next.
If you have just completed the exercises in chapter 2, go to "Put the Analyzer Into State Mode" on the next page. Otherwise, continue to step 2.
2If you are using an HP 1660 series analyzer, load the Analyzer with the configuration file, CH03_60._A. If you are using an HP 1670 series analyzer, load the Analyzer with the configuration file, CH03_70._A.
For instructions on loading configuration files, see "To Load a Configuration File" in chapter 11.
The file defaults all system settings and sets up the analyzer as if you had just completed the exercises in chapter 2.
Unless you are using an HP 1661 or an HP 1671 analyzer, you may see an advisory message when you load the files. This is not an error. The message is displayed because these logic analyzers have a different number of data pods from the HP 1661, which was used to create the files.
3Connect Pod 1.
Connect Pod 1 of the analyzer to J1 on the Training Board. For the
HP 1660s, Pod 1 is the top cable in the
4Set the jumpers as shown below.
The jumper settings for this chapter are the same as the default settings.
CLK2  P. G.
P. G.
OSC
P. G. J1
CLK1 
 CLK2
CLK2
GLITCH
OFF
ON
Introduction to State Analysis
Put the Analyzer into State Mode
Put the Analyzer into State Mode
To make a state measurement, you must set the analyzer to state mode. The state mode uses the clock supplied by the system under test to control when data is sampled.
1Press the Config MENU key.
2In the Analyzer 1 box, highlight the field to the right of Type, and press the Select key.
3Highlight State in the
Unless you are using an HP 1661 or an HP 1671 analyzer, your Configuration Menu will look different than the one shown below because your analyzer has a different number of data pods than the HP 1661, which was used to create the figure.
The analyzer is in state mode.
Pod A1 has arrows on the lower eight channels and the
Putting the Analyzer into State Mode

Introduction to State Analysis
Set Up the State Clock
Set Up the State Clock
The state clock is a signal from the system under test that clocks the analyzer, causing the analyzer to sample and store data.
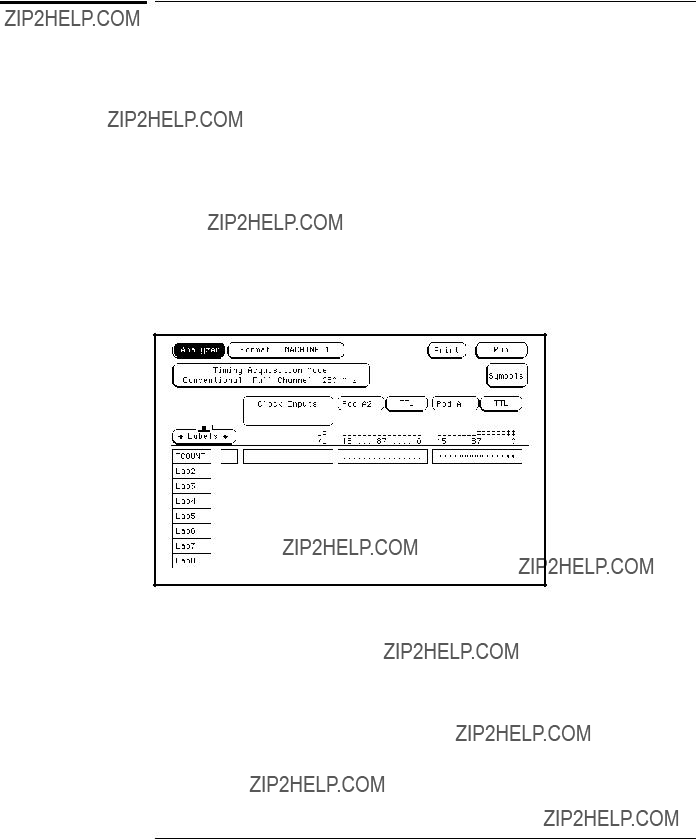
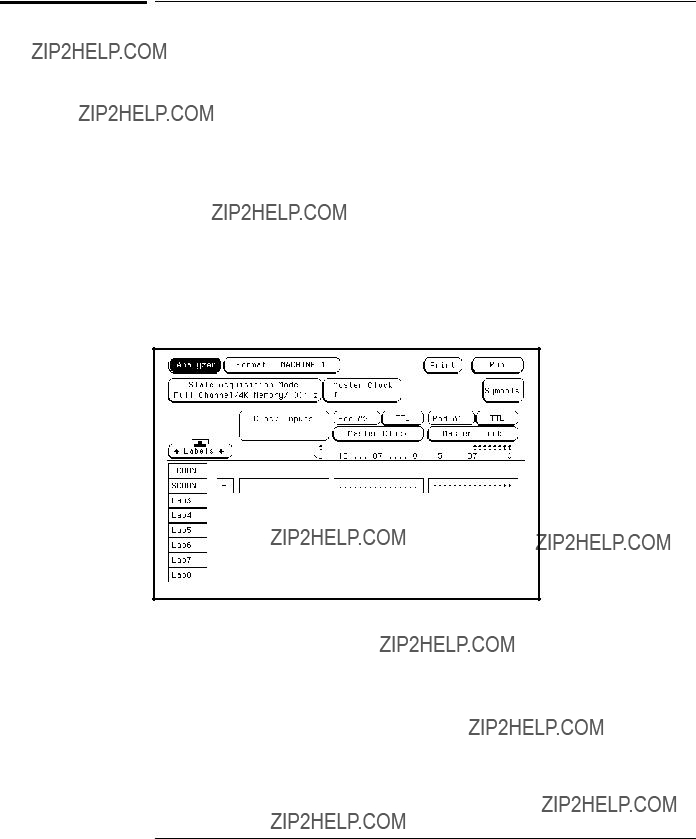
1Press the Format MENU key.
2Highlight the Master Clock field in the upper center of the display. Press the Select key.
Your display will look different from the one shown in the figure below if you are using an HP 1662, 1663, 1664, or an HP 1672 analyzer. There are fewer clock lines available on these analyzers than on an HP 1661, which was used to create the figure.
3Highlight the J field, and press the Select key. Highlight the ??? (down arrow) in the
4Press the Done key to close the Master Clock
The down arrow represents a negative edge. The negative edge of the clock is used to get the best results from the training board.
Introduction to State Analysis
Change a Label Name
Change a Label Name
Labels group channels together. You can rename a label to make it more meaningful. For example, you could use the label name DATA for all of the channels that are connected to the data bus of a microprocessor.
In this exercise, you will change Lab2 to SCOUNT to represent the state count data. The label is named SCOUNT so that you can keep track of the counter output acquired by the state analyzer.
1Highlight the label Lab2 below the Labels field.
2Type SCOUNT, then press the Done key.
3Highlight the field labeled TCOUNT, and press the Select key. Highlight Turn Label Off in the
If you have already performed the Introduction to Timing Analysis exercises in chapter 2, this field will be the TCOUNT label, which represents timing count. Turning the label off now saves it for later use.

Introduction to State Analysis
Modify Channel Assignments
Modify Channel Assignments
In this exercise, you will assign the lower eight channels of pod A1 to the label SCOUNT.
1Highlight the field showing the 16 channels of Pod A1 to the far right of the SCOUNT label. Press the Select key.
2Using the knob, move the cursor to channel 7 in the
3Press the Done key.
Pod A1 has 16 channels and is connected to the training board.
The asterisks (*) assign the lower 8 channel positions to the label SCOUNT.
Modify the Channel Assignments

Introduction to State Analysis
Define a Term for the State Trigger
Define a Term for the State Trigger
For the state analyzer to capture the data you want, you need to tell it what to trigger on by defining a term. Trigger terms are used in the trigger specification to tell the analyzer when to start recording data, what to store, and when to stop.
1Press the Trigger MENU key.
2Highlight the base field under SCOUNT, and press the Select key. Highlight Hex in the
Hex is the default setting. Notice that there are other display options other than hex.
3Under SCOUNT, highlight the field to the right of b, enter 00, and press the Done key.
The "b" term is a variable to which you can assign a value.
The base field is used to specify the type of values entered.
A term is a variable that stores a value. In this exercise, you selected Hex, and entered the hex value 00 for the "b" term.
Define a Term for the State Trigger

Introduction to State Analysis
Set Up Level 1 of the State Trigger Specification
Set Up Level 1 of the State Trigger Specification
In the next two exercises, you will set up the sequence of events that you want the logic analyzer to follow when triggering and storing data. In this exercise you will set Level 1 to store all data occurring before the trigger pattern is found.
1Highlight the 1 field in the State Sequence Levels box of the Trigger menu. Press the Select key.
2Highlight the field to the right of Trigger on, and press the Select key. Highlight b in the
3Press the Done key to close the Sequence Level 1
The b term holds the value 00.
Introduction to State Analysis
Set Up Level 2 of the State Trigger Specification
Set Up Level 2 of the State Trigger Specification
In sequence level 1 the analyzer stores data before the trigger point. For sequence level 2, you will tell the analyzer to store any data once the trigger pattern is found. This will fill the rest of the acquisition memory.
1Highlight the 2 field in the State Sequence Levels box. Press the Select key.
2Highlight the field to the right of Store, and press the Select key. Highlight anystate in the
3Press the Done key to close the Sequence Level 2
Once the trigger pattern is found, the logic analyzer will store any data that it samples.
If your trigger specification does not match this one, repeat the exercises, starting with "Modify Channel Assignments" on page
Introduction to State Analysis
Run the State Analyzer and View and Change the State Listing
Run the State Analyzer and View and Change the State Listing
1Press the Run key.
2Observe the State Listing.
The trigger pattern 00 is centered around the zero line number, which corresponds to the trigger point you specified in the Trigger menu. The negative line numbers indicate the states stored prior to the trigger point.
The line numbers show the locations of the data in the logic analyzer???s memory.
Trigger point 00
This is the state data you acquired from the ripple counter.
State Listing Menu
3 Use the table below to view and change the state listing.
To Do This:
To change the state listing display from hex to decimal
To scroll through the state listing
To page through the state listing one screen at a time
Do This:
Highlight the Hex field directly below the SCOUNT label, and press the Select key. Choose Decimal from the
On the
Press the Page keys below the knob.

Introduction to State Analysis
Create Symbols to Display State Data
Create Symbols to Display State Data
Symbols are used to display state data in easily understandable terms, which you define. This can make the state listing much easier to interpret. In the following exercises, you will define and display some symbols.
1Press the Format MENU key.
2Highlight the Symbols field, and press the Select key.
3Highlight the New Symbol field below Symbol. Type "ONE" using the keypad. Press the Done key when you are finished typing.
4Highlight the field below Pattern/Start. Enter 01 using the keypad. Press the Done key when you are finished typing.
The Symbols field.
The symbol ONE will appear in the state listing when the state analyzer records the hex value 01.
Introduction to State Analysis
Create Additional Symbols
Create Additional Symbols
You can create as many symbols as you want. In this exercise, you will create symbols TWO and THREE for the hex values 02 and 03.
1If the Symbol Table
2Highlight the ONE field below Symbol, and press the Select key. Highlight Add a Symbol in the
3Highlight the field to the right of the TWO under Pattern/Start. Enter 02 using the keypad. Press the Done key when you are finished typing.
4Highlight the TWO field. Repeat steps 2 and 3 to create a symbol, THREE, with a pattern value of 03.
5Press the Done key to close the Symbol Table
The symbol TWO represents the hex value 02.
The symbol THREE represents the hex value 03.
Introduction to State Analysis
Select and View Symbols in the State Listing
Select and View Symbols in the State Listing
Symbols are helpful when viewing more complex state listings. For example, you might monitor a microprocessor???s status lines which have specific patterns for read and write cycles. You can define symbols for these patterns. Then, wherever a read or write cycle occurs in the state listing, you will see "READ" or "WRITE," instead of a numerical representation of the patterns.
1Press the List MENU key.
2Highlight the base field under the SCOUNT label, and press the Select key. Highlight Symbol in the
The symbols ONE, TWO, and THREE are displayed in the state listing in place of the numeric counts 01, 02, and 03, respectively.
The base field is set to display the data in symbol form.
Symbols ONE, TWO, and THREE represent data 01, 02, 03.
State Listing with Symbols
3Select the Symbol field under SCOUNT label, and then choose Hex from the
Step 3 changes the base from decimal to hexadecimal for the rest of the exercises.

4
Comparing State Traces
Comparing State Traces
The State Compare feature allows you to compare two state listings. You can check if your system is executing correct states by acquiring a state listing from the system under test and comparing it to a listing that is known to be good. If there are differences between the two listings, you can use the Difference Listing feature to see where the differences occur.
In these exercises, you will run a test and store the state listing as the reference listing. Next, you will change the jumper settings and run a different test using the same trigger specification. You will then use the Difference Listing to see the differences between the two listings.
These exercises will step you through the process of using the Compare mode of the state analyzer. They are designed to use many of the same exercises as the State Analyzer Exercises in the previous chapter; therefore, the beginning exercises do not include figures or explanations. If you need this additional information on any of these common exercises, refer back to the same exercise in chapter 3, "Introduction to State Analysis."
In this chapter, you will:
???Put the analyzer into state mode
???Set up the state clock
???Change a label name and modify channel assignments
???Define a term for the state trigger
???Set up the state trigger specification
???Run the analyzer and view the state listing
???Copy the state listing to the compare reference listing
???Change the jumper to acquire a different state listing
???Run the analyzer and find the errors

Comparing State Traces
Before You Begin
Before You Begin
1Decide what to do next.
If you have just completed the exercises in chapters 2 and 3, go to "Check the Configuration" on the next page.
If you have not just completed the exercises in chapters 2 and 3, go to step 2.
2Load the Analyzer with the configuration file, CH04._A.
The file defaults all system settings and sets up the analyzer as if you just completed the exercises in chapters 2 and 3.
Unless you are using an HP 1661 or an HP 1671 analyzer, you may see an advisory message when you load the files. This is not an error. The message is displayed because these logic analyzers have a different number of data pods from the HP 1661, which was used to create the files.
3Connect Pod 1.
Connect Pod 1 of the analyzer to J1 on the Training Board. For the
HP 1660s, Pod 1 is the top cable in the
4Set the jumpers as shown below.
The jumper settings of J5 on the training board for this chapter are the same as the default settings.

Comparing State Traces
Check the Configuration
Check the Configuration
Either you have just completed chapter 3, "Introduction to State Analysis", or you have loaded the configuration file CH_04.
1If you are using an HP 1660 series analyzer go to step 2. If you are using an HP 1670 series analyzer, put the analyzer into State Compare mode before checking the configurations.
To do this, press the Config MENU key. In the Analyzer 1 box, highlight the field to the right of Type, press the Select key, and then choose State Compare from the
2Check the configuration.
???In the Config menu, Analyzer 1 is set to State mode for the HP 1660s and State Compare for the HP 1670s.
???In the Format menu, the Master Clock field is displaying J ???.
???In the Format menu, the SCOUNT label is turned on with the lower eight channels of pod A1 assigned to it.
???In the Trigger menu SCOUNT???s term "a" is assigned the value FF (hex).

Comparing State Traces
Set Up the State Trigger Specification
Set Up the State Trigger Specification
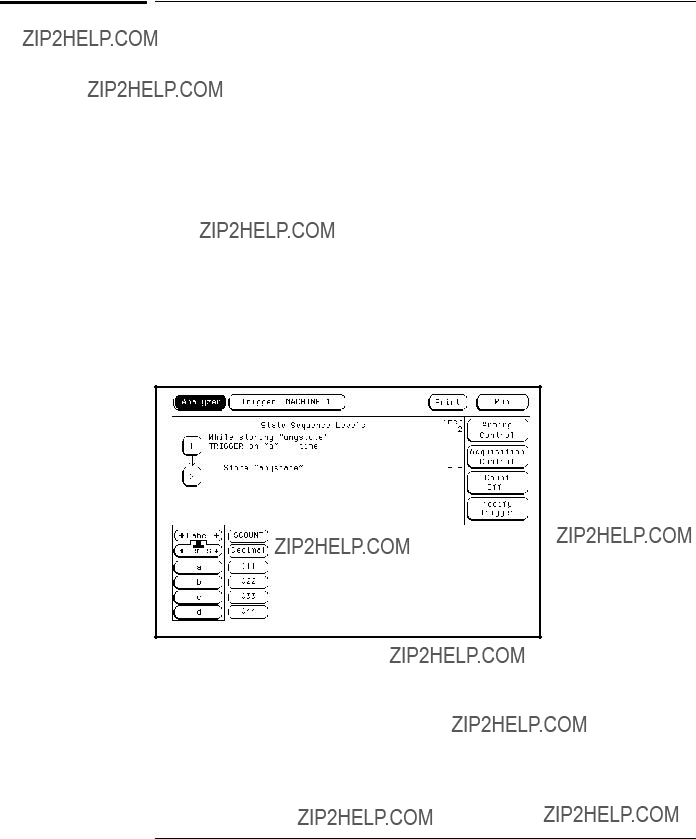
When comparing two state listings, it is best to only sample the data you are interested in comparing. This will ensure that the errors you find are errors in the data you are interested in, rather than in the pretrigger data. Setting the analyzer to store "no state" before the trigger, tells the analyzer to begin capturing data after the trigger is found.
1If the Trigger Menu is not already displayed, press the Trigger MENU key.
2Highlight the 1 field in the State Sequence Levels box, and press the
Select key.
3Highlight the field to the right of While storing, and press the Select key. Highlight no state in the
4Highlight the field to the right of Trigger on, and press the Select key. Highlight a in the
5Highlight the 2 field in the State Sequence Levels box, and press the
Select key.
6Highlight the field to the right of Store, and press the Select key. Highlight anystate in the

Comparing State Traces
Run the Analyzer and View the State Listing
Run the Analyzer and View the State Listing
1Press the Run key.
2Observe the listing.
The State Listing is now displaying the output of the ripple counter in hexadecimal with FF (hex) at the top of the listing under the SCOUNT label.
FF is at the beginning of the listing and to the right of a field in which 0 is displayed. The zero line number always displays the trigger point specified in the Trigger menu. There are no negative line numbers preceding the trigger point because the pretrigger specification was set to "While storing no state."
Trigger point (FF)
State Listing with no Pretrigger Data
Comparing State Traces
Copy the State Listing to the Compare Reference Listing
Copy the State Listing to the Compare Reference
Listing
In this exercise, you will copy the state listing you acquired in the previous exercise to the reference listing so you can compare it with other listings. This feature can be used in a test environment to check that your system is executing correctly. You can acquire a state listing from the system under test and compare it to a listing that is known to be good. Any differences between the two listings can be seen using the Difference Listing feature.
1Press the List MENU key, then choose Compare from the
2Highlight the Copy Listing to Reference field, and press the Select key.
3Highlight Execute in the
Compare allows you to compare two state acquisitions to find differences.
Selecting this field and choosing Execute copies the listing.
Copying the State Listing to the Compare Reference Listing
Comparing State Traces
Change the Jumper to Acquire a Different State Listing
Change the Jumper to Acquire a Different State Listing
Changing the glitch jumper changes channel 7 of the counter so that some of the acquired states will not match the original listing. After you change the jumper, you will acquire the data again in the next exercise, then compare it to the data you copied to the Reference Listing.
1Pull the glitch jumper from the pins labeled GLITCH OFF.
2Push the jumper onto the pins labeled GLITCH ON.
CLK2 
 P. G.
P. G.
OSC
P. G.
CLK1  CLK2
CLK2
GLITCH  OFF
OFF
ON
Comparing State Traces
Run the Analyzer and Find the Errors
Run the Analyzer and Find the Errors
Now that you have changed the jumper, you are ready to acquire a different state listing and compare it to the previous listing. In this exercise, you will switch to the Difference Listing, press the Run key to acquire the new state listing, and use the knob to scroll through the differences between the two listings.
1Highlight the Reference Listing field, and press the Select key to switch to the Difference Listing.
2Press the Run key.
The listing now shows the data that you just acquired. The analyzer compares this data to the data that you stored in the Reference Listing.
3Highlight the Find Error field.
4Use the knob to scroll through the listing. Observe the states where one of the hex numbers is white.
The white color indicates states in the new listing that do not match the reference listing. You can also type a number into the Find Error field. Find Error will jump you to that error if it exists in the listing.
6 Press the List MENU key. Choose Listing MACHINE 1 from the
Steps 5 and 6 reset the training board and the analyzer for the next exercises.


5
Mixed Mode - Correlation of
State and Timing Data

Mixed Mode - Correlation of State and
Timing Data
Mixed mode allows you to analyze a system in both state and timing modes simultaneously. A common example is using the state analyzer to capture a problem that occurs infrequently and then using the timing analyzer to analyze the problem in detail. The Mixed Mode exercises will show you how to use the mixed mode capabilities of the timing and state analyzers. These exercises are built on the timing and state exercises in chapters 2 and 3.
If your logic analyzer is an HP 1663 or HP 1664, you will not be able to perform these exercises. These analyzers have 32 data acquisition channels on two pods. All 32 channels may be assigned to either state or timing analysis, but they cannot be separated to perform mixed mode measurements.
In this chapter you will:
???Connect the timing analyzer
???Enable
???Arm the timing analyzer with the state analyzer
???Run the analyzers and view the mixed mode display with time correlated markers
Mixed Mode - Correlation of State and Timing Data
Before You Begin
1Set the jumpers as shown below.
The jumper settings of J5 on the training board for this chapter are the same as the default settings.
CLK2  P. G.
P. G.
OSC
P. G.
CLK1 
 CLK2
CLK2
GLITCH
OFF
ON
2Decide what to do next.
If you have just completed all of the exercises in chapters 2 through 4, go to "Connect the Timing Analyzer" on the next page.
If you have not just completed all of the exercises in chapters 2 through 4, go to step 3.
3Load the Analyzer with the configuration file, CH05._A.
The file will default all system settings and then set up the analyzer as if you had just completed all of the exercises in chapters 2 through 4.
Unless you are using an HP 1661 or an HP 1671 analyzer, you may see an advisory message when you load the files. This is not an error. The message is displayed because these logic analyzers have a different number of data pods from the HP 1661, which was used to create the files.
4Connect Pod 1.
Connect Pod 1 of the analyzer to J1 on the Training Board. For the
HP 1660s, Pod 1 is the top cable in the
Mixed Mode - Correlation of State and Timing Data
Connect the Timing Analyzer
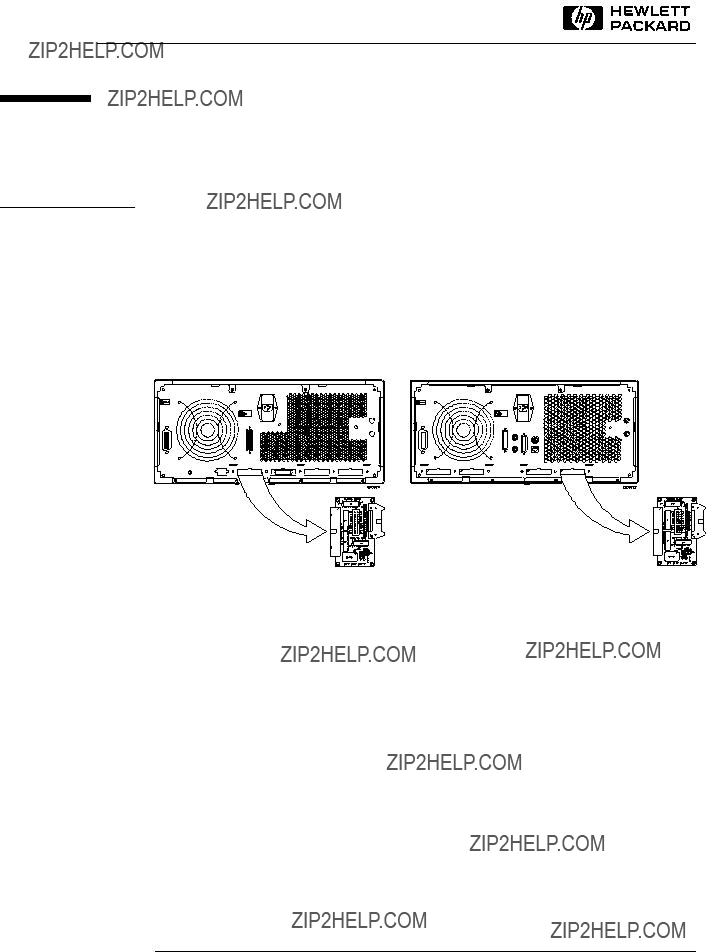
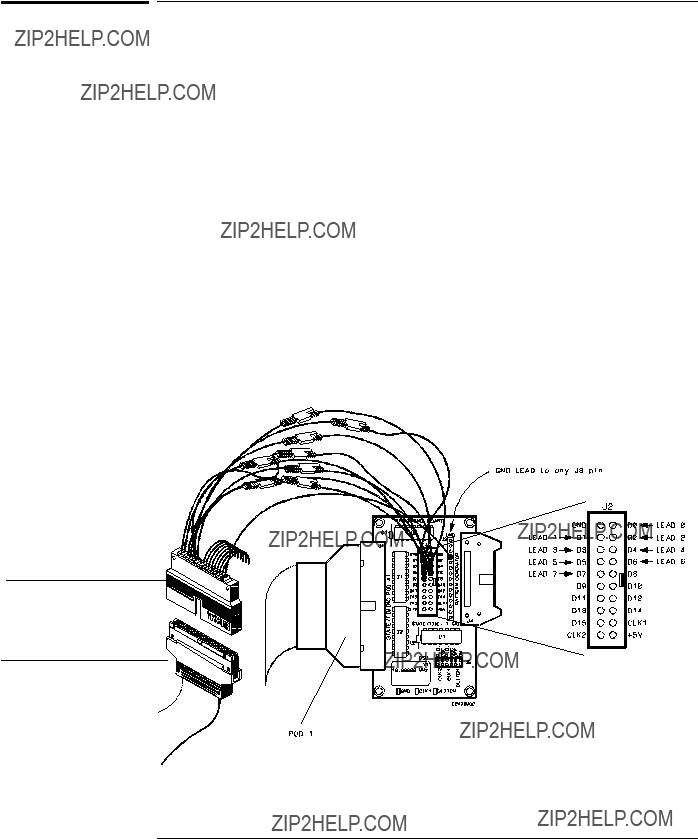
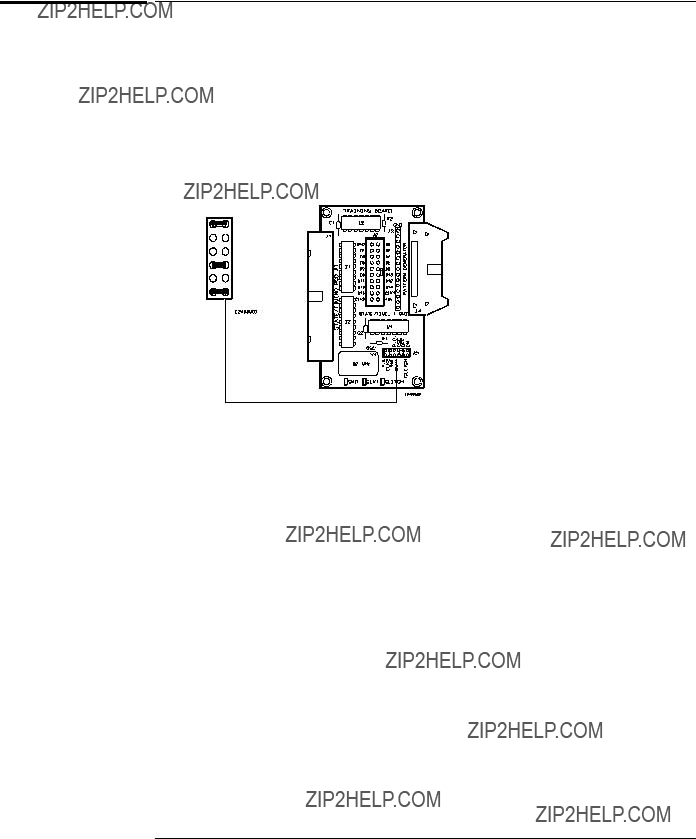
1Connect the Pod 3 connector to the probe assembly.
For the HP 1660s, Pod 3 is the top cable in the second connector from the left, as you are facing the back of the logic analyzer. For the HP 1670s, Pod 3 is the top cable in the second connector from the right, as you are facing the back of the logic analyzer.
2Connect the probe leads 0 through 7 to the pins D0 through D7 of J2.
3Connect the probe ground lead to any pin of J3.
Probe Assembly
Pod 3 Connector
Connecting the Pod 3 Cable to the Probe Assembly

Mixed Mode - Correlation of State and Timing Data
Put the Analyzer into State and Timing Modes
Put the Analyzer into State and Timing Modes
In this exercise you will use both the timing analyzer mode and the state analyzer mode to correlate the state and timing measurements. Pod 1 will be capturing the state measurement and Pod 3 will be capturing the timing measurement. All other pods will be unassigned.
1Press the Config MENU key.
2In the Analyzer 2 box, highlight the field to the right of Type, and press the Select key. Highlight Timing in the
Select key.
3Highlight the Pod A3/A4 field, and press the Select key. Highlight Machine 2 in the
4If you have any other pod pair fields other than A1/A2 and A3/A4, select each pair and choose Unassigned in the
Analyzer 1 is in state mode with the lower 8 bits of Pod A1 and the J clock are showing activity.
Analyzer 2 in timing mode. The lower 8 bits of Pod A3 and the L clock are showing activity.
If you are using a 1660, 1661, 1670, or a 1671 set Pod A5/A6 to "Unassigned".
If you are using an HP 1660 or an HP 1670, set Pod A7/A8 to "Unassigned".

Mixed Mode - Correlation of State and Timing Data
Change a Label Name and Modify Channel Assignments
Change a Label Name and Modify Channel
Assignments
1Press the Format MENU key twice.
2Highlight Format MACHINE 2 in the
3Highlight the top field under Labels, then type TCOUNT using the keypad. Press the Done key when you are finished typing.
4Highlight the field showing the 16 channels of Pod A3, to the far right of the TCOUNT label. Press the Select key.
4If there are asterisks in the
5Press the ???
Turn on the TCOUNT Label in the Waveform Menu
The timing data will be displayed in the waveform menu with the state data listed above. Turning the TCOUNT label on in the waveform menu tells the analyzer to display the timing data for TCOUNT.
1Press the Waveform MENU key to display Waveform Machine2.
2If the large vertical field on the left side of the display has TCOUNT 0 through TCOUNT 7 displayed, go to "Clear the Timing Analyzer Trigger" on the next page. Otherwise, continue to the next step.
3Highlight the large vertical field on the left side of the display, and press the Select key twice.
4Highlight Insert in the
5Press the Select key to choose TCOUNT.
6Choose Sequential from the next
Mixed Mode - Correlation of State and Timing Data
Clear the Timing Analyzer Trigger
Clear the Timing Analyzer Trigger
Clearing the timing analyzer trigger sets the specification to "don???t care". By doing this, the timing analyzer will trigger as soon as it is armed by the state analyzer.
1Press the Trigger MENU key.
2Highlight the Modify Trigger field on the right side of the screen, and press the Select key.
3Highlight the Clear Trigger field, press the Select key, and choose All from the
Set Up the State Trigger Specification
1Press the Trigger MENU key. Highlight Trigger MACHINE 1 in the
2Highlight the 1 field in the State Sequence Levels box of the Trigger menu. Press the Select key.
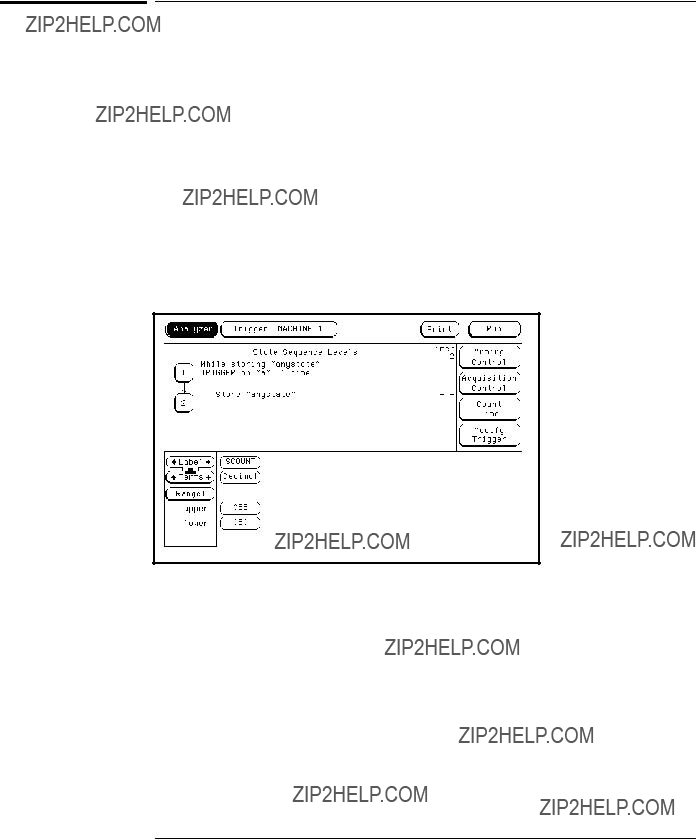
3Highlight the field to the right of While storing, and press the Select key. Highlight anystate in the
4Press the Done key to close the Sequence Level 1
The trigger term "a" is assigned the hex value FF.
Mixed Mode - Correlation of State and Timing Data
Enable Time Correlation between the Timing and State Analyzers
Enable Time Correlation between the Timing and
State Analyzers
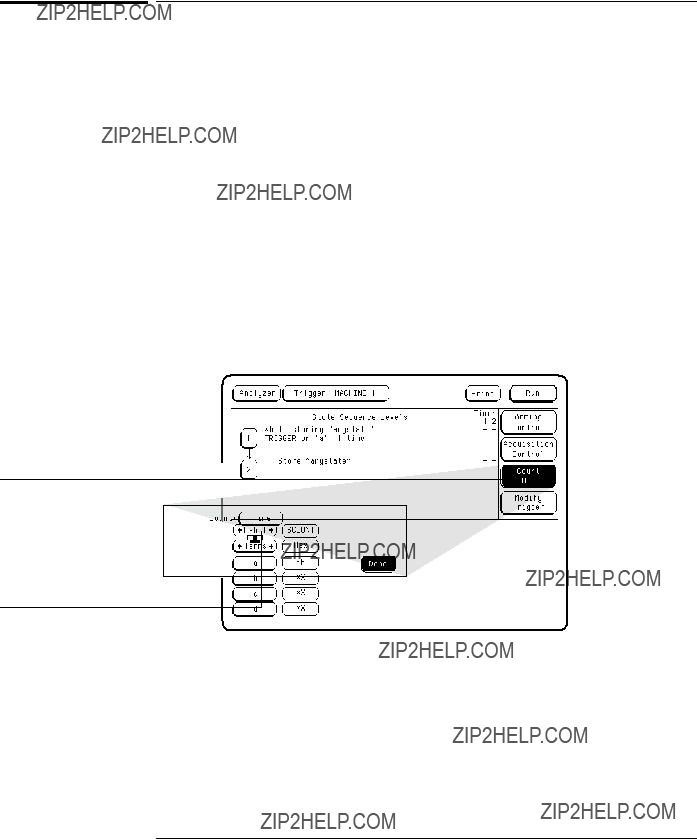
Setting the Count to Time causes the state analyzer to store a time value, called a time stamp, for each data point that is stored in memory. When the mixed display is selected, the time stamp information is used to display the data in both the timing and state displays with the proper time relationship (correlation).
1Highlight the Count Off field, and press the Select key.
2In the
3Highlight Time in the next
Data stored before triggering has negative time numbers, and data stored after triggering has positive time numbers.
The Count field accesses a selection menu which indicates whether acquisition data is stamped with a Time tag or a State Count tag.
Count Time places time tags on all displayed data.
Mixed Mode - Correlation of State and Timing Data
Arm the Timing Analyzer with the State Analyzer
Arm the Timing Analyzer with the State Analyzer
Arming control sets up the order of triggering for complicated measurements that involve more than one mode, such as state and timing. Although state and timing modes involve a single analyzer, they are often referred to as the timing analyzer and the state analyzer. Arming the timing analyzer with the state analyzer allows the two modes to run simultaneously so that the data captured by both analyzers can be
1Highlight the Arming Control field, and press the Select key.
If you are using an HP 1670 series logic analyzer, the Arming Control
2Highlight MACHINE 2 near the center of the screen, next to the Run field. Press the Select key.
3Highlight the field next to Run from, and press the Select key.
4Highlight MACHINE 1 in the
5Press the Done key to return to the Trigger Menu.
Machine 1 is the state analyzer.
Machine 2 is the timing analyzer.
The timing analyzer is armed by the state analyzer.
Mixed Mode - Correlation of State and Timing Data
View the
View the
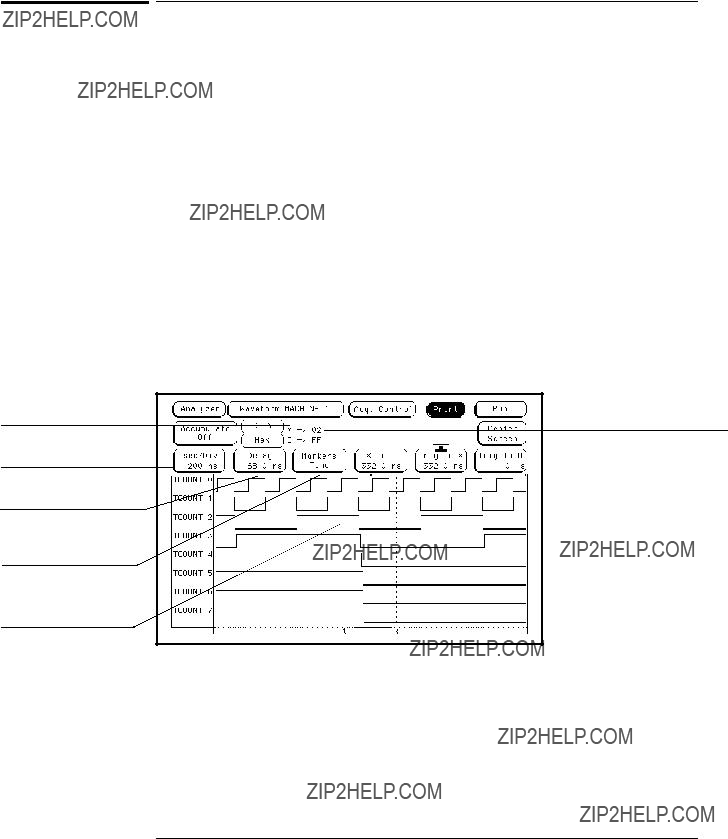
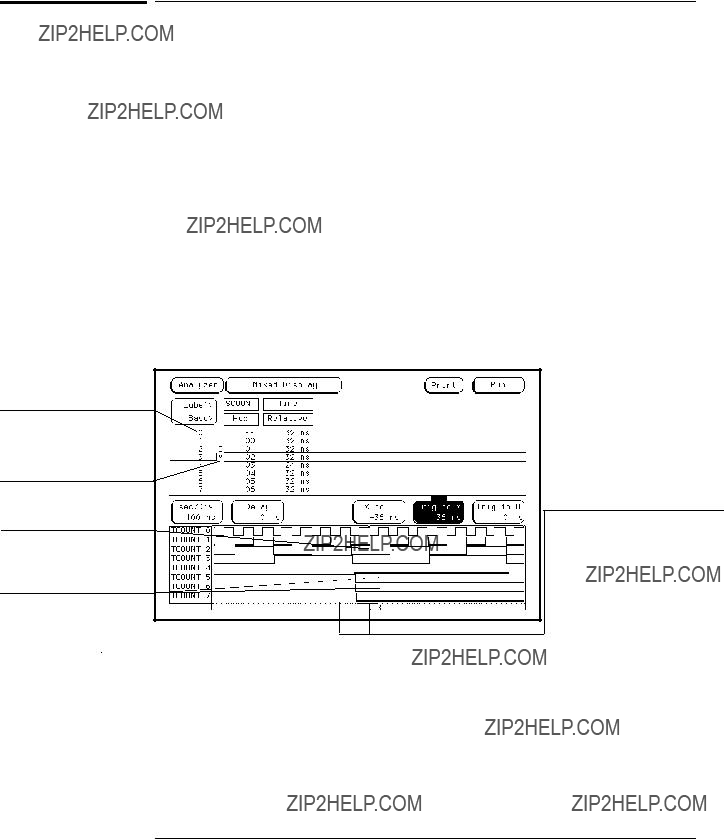
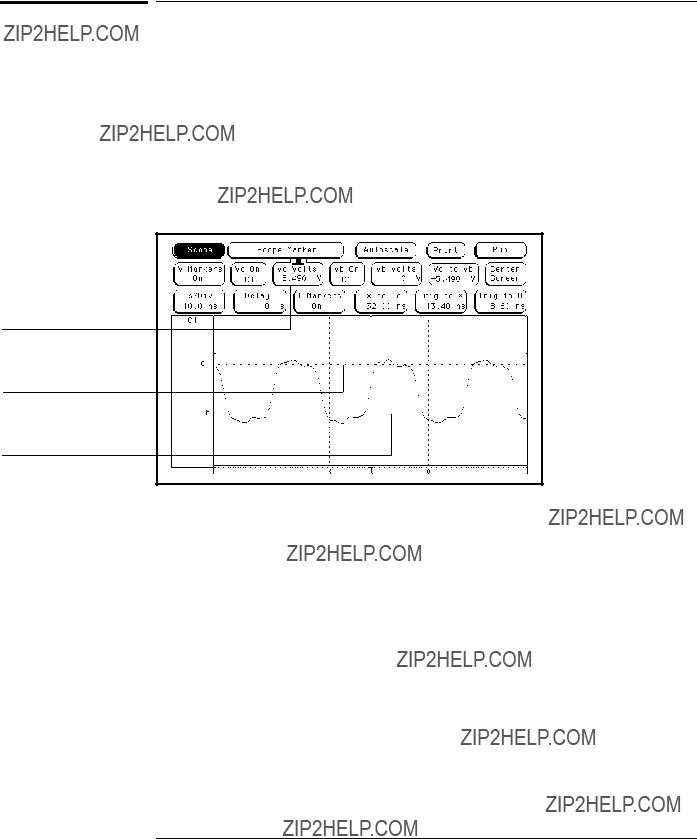
When you press the Run key, the state analyzer triggers on the pattern FF (when all eight lines are high) and arms the timing trigger. Mixed Display displays trigger points for both the timing analyzer and the state analyzer with the state data displayed in a state listing and the timing data displayed in a timing waveform.
1Press the Run key.
2Press the List MENU key. Choose Mixed Display from the
Notice the delay between the state trigger and the timing trigger, causing the timing trigger marker to appear to the right of the FF state. This is due to the time required for the state analyzer to arm the timing analyzer.
3Highlight the Trig to X field and rotate the knob to observe that the X markers move in both the state listing and the timing waveform displays.
The state analyzer trigger point (FF).
The
The timing analyzer trigger point to the right of the FF state.
The
The delay between the state trigger and the timing trigger. The FF state is where all eight lines are high.
Mixed Mode Display
4Press the Trigger MENU key twice.
5Highlight the Count Time field, and press the Select key twice. Highlight Off in the
Steps 4 and 5 turn off the Time Count function for the next exercise.

6
Advanced State Triggering

Advanced State Triggering
The power of the state analyzer is in its wide range of trigger capabilities. These exercises step you through the process of using the
In this chapter, you will:
???Put the analyzer into state mode
???Set up the state analyzer format
???Define individual trigger terms
???Define the range trigger term
???Add state trigger sequence levels
???Set up multiple state trigger levels
???Define a combination trigger term
???Check the trigger specification
???Run the state analyzer and view the data

Advanced State Triggering
Before You Begin
Before You Begin
1Decide what to do next.
If you have just completed all of the exercises in Chapters 2 through 5, go to "Put the Analyzer into State Mode" on the next page.
If you have not just completed all of the exercises in Chapters 2 through 5, go to step 2.
2Load the Analyzer with the configuration file, CH06._A.
The file defaults all system settings and sets up the analyzer as if you just completed all of the exercises in Chapters 2 through 5.
Unless you are using an HP 1661 or an HP 1671 analyzer, you may see an advisory message when you load the files. This is not an error. The message is displayed because these logic analyzers have a different number of data pods from the HP 1661, which was used to create the files.
3Connect Pod 1.
Connect Pod 1 of the analyzer to J1 on the Training Board. For the
HP 1660s, Pod 1 is the top cable in the
4Set the jumpers as shown below.
The jumper settings of J5 on the training board for this chapter are the same as the default settings.

Advanced State Triggering
Put the Analyzer into State Mode
Put the Analyzer into State Mode
1Press the Config MENU key.
2In the Analyzer 2 box, highlight the field to the right of Type, and press the Select key. Highlight Off in the
3In the Analyzer 1 box, highlight the field to the right of Type, and press the Select key. Highlight State in the
Advanced State Triggering
Define State Trigger Terms "a" through "d"
Define State Trigger Terms "a" through "d"
In the following exercises, you will set up the analyzer to check for and store a complex sequence of states before it triggers. While the analyzer checks for these states, it will store only selected states that you define. As in chapter 3, you will define your trigger terms first, then use these terms to define a sequence of events. In this case, the sequence will be made up of states of the ripple counter on the training board. You can use this same method to monitor any state sequence, such as subroutine calls or read and write cycles of a microprocessor.
1Press the Trigger MENU key.
2Highlight the base field below SCOUNT, and press the Select key. Highlight Decimal in the
3Under SCOUNT, highlight the field to the right of the a term.
4Enter 011 and then press the Done key.
5Repeat steps 3 and 4 to enter 022, 033, and 044 in terms b, c, and d, respectively.
Advanced State Triggering
Define State Trigger Term "e" and Range1
Define State Trigger Term "e" and Range1
The trigger term "e" stores one value. The Range1 term, however, can store a range of values. Storing a range of values is useful when you are looking to store the data of a subroutine or procedure.
1Turn the knob clockwise to display the e term in the bottom left corner of the display. Under SCOUNT, highlight the field to the right of e. Enter 059 using the keypad. Press the Done key.
2Turn the knob until the Range1 term is displayed. Highlight the field to the right of upper and enter 058 using the keypad. Press the Done key.
3Highlight the field to the right of lower and enter 050 using the keypad. Press the Done key.
Advanced State Triggering
Add State Trigger Sequence Levels
Add State Trigger Sequence Levels
You tell the analyzer what data to capture by setting the sequence specification. In this exercise, your sequence specification will have five sequence levels.
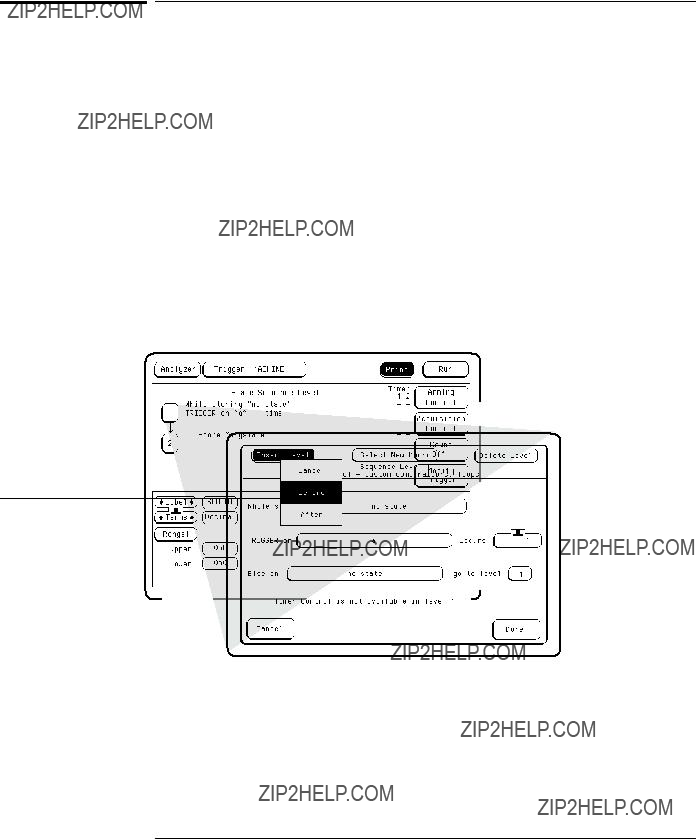
1Highlight the 1 field in the State Sequence Levels box of the Trigger menu. Press the Select key.
2Highlight the Insert Level field, and press the Select key. Highlight Before in the
3In the Trigger Macro Library, use the knob to highlight "1. User level - custom combinations, loops," then press the Done key.
Custom triggering is set up by selecting the user level. In the Trigger Macro library, trigger macros are also available for common trigger applications.
4Repeat step 2 and 3 two more times. After inserting these two levels, press the Done key to close the Sequence Level 1
Selecting "Before" inserts a new sequence level before the sequence level 1.

Advanced State Triggering
Set Up Level 1 of the State Trigger Specification
Set Up Level 1 of the State Trigger Specification
The first term you will look for and store before triggering is term "a", which stores the value 011. Because you are only interested in 011, you will set the "While Storing" field to "no state" so that no other data is stored.
1Highlight the 1 field in the State Sequence Levels box of the Trigger menu. Press the Select key.
2In the
3Highlight the field to the right of Find, and press the Select key. Highlight a in the
4Press the Done key to close the Sequence Level 1
The analyzer will not store any data before it finds term "a".
The "a" term holds the decimal value
Advanced State Triggering
Set Up Level 2 of the State Trigger Specification
Set Up Level 2 of the State Trigger Specification
The second term you will look for is the range of values 050 through 058, which you defined as "In range1". While you are storing these values, you also want to find and store term "e" with the value 059.
1Highlight the 2 field in the State Sequence Levels box of the Trigger menu. Press the Select key.
2Highlight the field to the right of While storing, and press the Select key. Highlight In_Range1 in the
3Highlight the field to the right of Then find, and press the Select key. Highlight e in the
4Press the Done key to close the Sequence Level 2
In_Range1 tells the analyzer to store the values 050 through 058.
While storing In_Range1, the analyzer looks for and stores "e" one time.
Advanced State Triggering
Set Up Level 3 of the State Trigger Specification
Set Up Level 3 of the State Trigger Specification
The third term you want to find and store is term "b" with the value 022. Because you only want to store this value, you set the "While Storing" field to "no state".
1Highlight the 3 field in the State Sequence Levels box of the Trigger menu. Press the Select key.
2Highlight the field to the right of While storing, and press the Select key. Highlight no state from the
3Highlight the field to the right of Then find, and press the Select key. Highlight b from the
4Press the Done key to close the Sequence Level 3
No data will be stored while the analyzer is looking for term "b".
The analyzer looks for and stores term "b" with the value 022.
Advanced State Triggering
Set Up Level 4 of the State Trigger Specification and Define a Combination Trigger Term
Set Up Level 4 of the State Trigger Specification and
Define a Combination Trigger Term
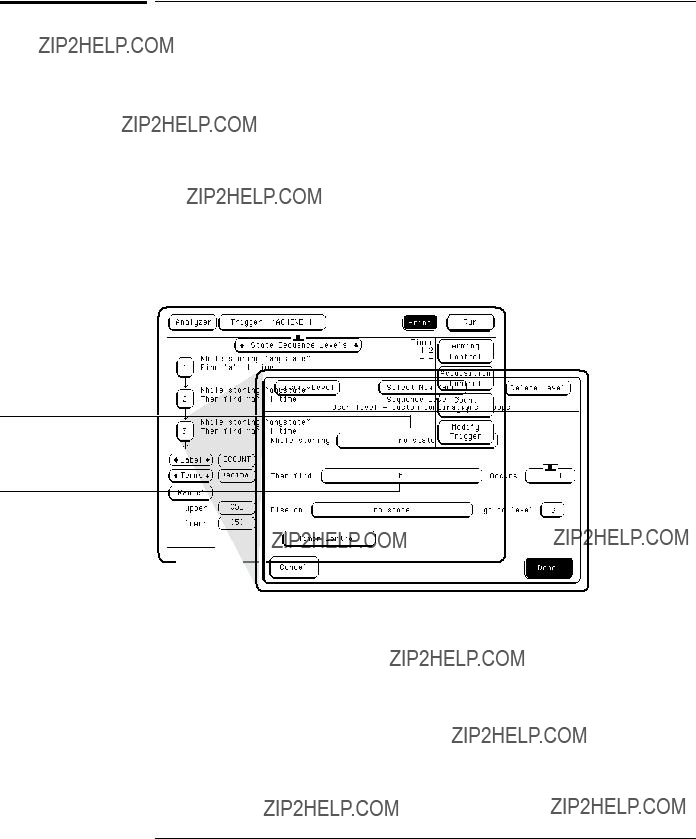
In Sequence Level 4 you will store a combination of values while looking for the trigger term "e". A combination term, is a logical combination of other terms, using boolean logic operators like AND and OR. In this exercise, you will define the combination of terms "c" or "In_Range1" or "d". These three terms are ORed together so that one, two, or all three of the terms could be stored.
1Turn the knob clockwise to display sequence levels 3, 4, and 5.
2Highlight the 4 field in the State Sequence Levels box of the Trigger menu. Press the Select key.
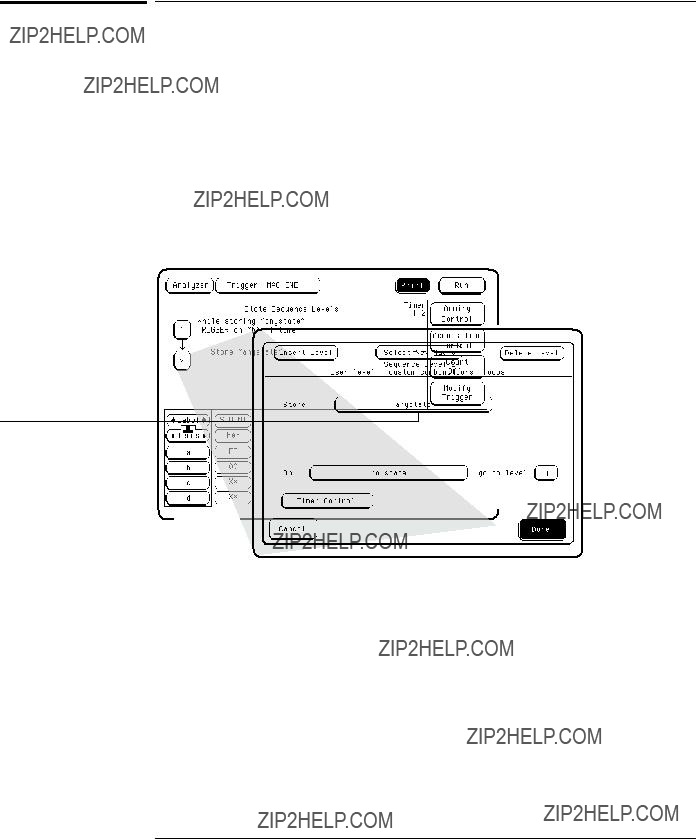
3Highlight the field to the right of While storing, and press the Select key. Highlight Combination in the
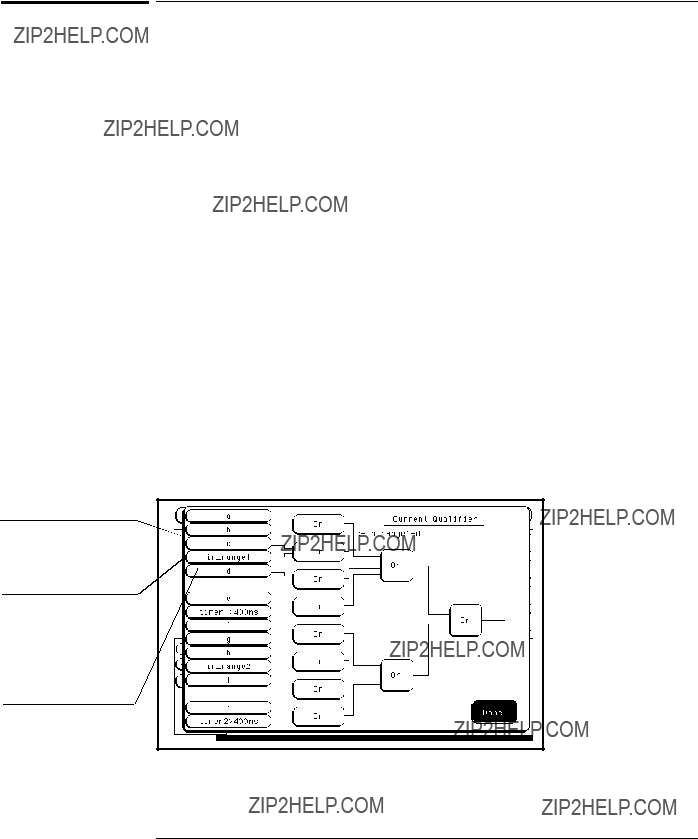
4In the combination
5Highlight In_Range1, and press the Select key. Highlight In in the
6Highlight d and press the Select key. Highlight ON in the
Note the "Current Qualifier" display in the top right corner of the screen. Your qualifier is now "c + in_range1 + d."
The "c" term is now turned on. See the
connection from "c" to one of the Or fields.
When you select "in_range1", the logic analyzer looks for values that are within the limits for the term Range1.
The "d" term is now turned on.
Defining a Combination Trigger Term
Advanced State Triggering
Set Up Level 4 of the State Trigger Specification and Define a Combination Trigger Term
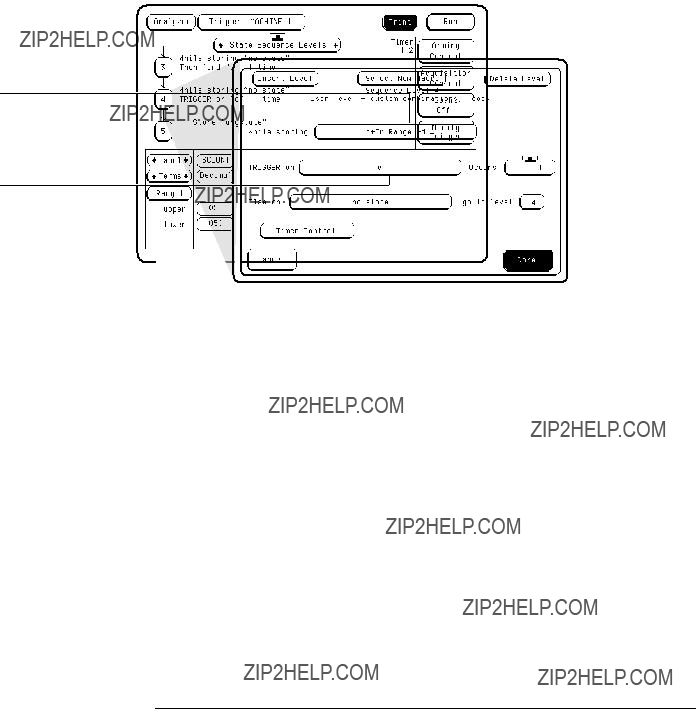
7Press the Done key once to close the Combination Term
8Highlight the field to the right of the TRIGGER on field, and press the Select key. Highlight e in the
9Press the Done key to close the Sequence Level 4
The analyzer stores one, two, or all three of these terms while looking for term "e".
The analyzer looks for and stores term "e" with the value 059.
Setting Up Level 4 of the State Trigger Specification

Advanced State Triggering
Check the Trigger Specification
Check the Trigger Specification
Now you can check the trigger specification by scrolling through the five sequence levels. You did not have to set up Level 5 because you want the analyzer to trigger and store "anystate". The last level of a trigger specification has this as the default.
1Highlight the "State Sequence Levels" field centered above the sequence specification.
2Turn the knob clockwise to scroll down through the sequence levels.
Your trigger specification should look like the one below:
???Level 1 - While storing "no state"; Find "a" 1 time
???Level 2 - While storing "In_Range1"; Then find "e" 1 time
???Level 3 - While storing "no state"; Then find "b" 1 time
???Level 4 - While storing "c + In_Range1 + d" ; TRIGGER on "e" 1 time
???Level 5 - Store "anystate"
If your trigger specification is not correct, repeat the appropriate exercises on the previous pages to correct the sequence levels that do not match.
Advanced State Triggering
Run the State Analyzer and View the Data
Run the State Analyzer and View the Data
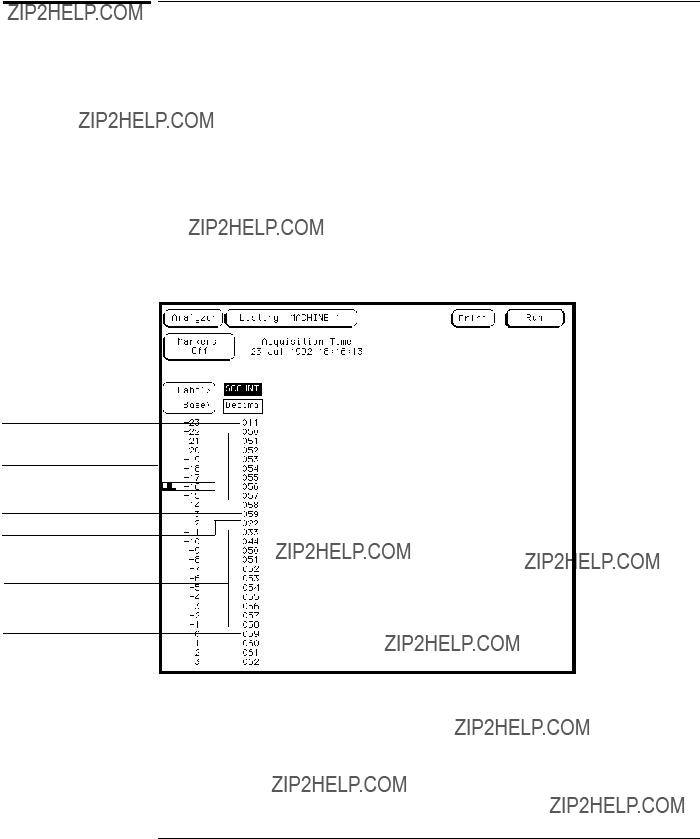
1Press the Run key.
2Highlight the base field below the SCOUNT label, and press the Select key. Highlight Decimal in the
3Highlight the line number field on the left side of the display. Scroll the listing to the beginning by turning the knob counter clockwise.
Term a
Range1 values
Term e
Term b
Combination term c + in_range1 + d
Trigger term e
State Listing Showing Your Defined Terms

Advanced State Triggering
Run the State Analyzer and View the Data
Counter Output
Logic analyzer storage sequence
Ripple Counter Output and Stored States
The figure above shows you the output of the ripple counter (the circle) and the sequence of qualification and storage that the state analyzer performed. The asterisks indicate when the state analyzer found and stored valid terms in this example. All states were initially excluded, using the "no state" term. First the "a" term was stored. Next, states that were within the specified Range1 term (50 - 58) were stored, while the analyzer searched for an occurrence of term "e." Once the remaining terms and range were found in the specified sequence, the state analyzer stored everything (anystate) until its acquisition memory was filled.
With


7
Using the Oscilloscope
Using the Oscilloscope
These exercises show you how to use the oscilloscope inside the analyzer. If you are using an HP 1660CS, HP 1661CS, HP 1662CS, or an HP 1663CS analyzer, you have a built in oscilloscope.
You will start by using the Autoscale feature to set up the oscilloscope. You will also use the Auto Measure feature to measure the period of the training board clock signal.
In this chapter, you will:
???Connect the channel 1 oscilloscope probe
???Get the waveform on the display with Autoscale
???Delete the unused channel from the display
???Zoom and scroll through the clock waveform
???Measure the clock period manually
???Measure the clock period with Auto Measure
???Read the pulse voltage with the markers
Using the Oscilloscope
Before You Begin
Before You Begin
1Decide what to do next.
If you have just completed the exercises in chapters 2 through 6, go to "Connect the Channel 1 Oscilloscope Probe" on the next page.
If you have not just completed the exercises in chapters 2 through 6, go to step 2.
2Load the configuration files CH07._A and CH07._B.
When loading these files, you must set the analyzer to load All, because you are loading two types of files for this exercise. Setting the analyzer to load Analyzer like you did in previous exercises, will only load CH07._A properly.
The files will default all system and oscilloscope settings. If you need instructions to load the configuration files, refer to chapter 11, "To Load a Configuration File."
3Connect Pod 1.
Connect Pod 1 of the analyzer to J1 on the Training Board. For the
HP 1660s, Pod 1 is the top cable in the
4Set the jumpers as shown below.
The jumper settings of J5 on the training board for this chapter are the same as the default settings. For more information about setting the jumpers, refer to chapter 11, "To Set the Jumpers."
Using the Oscilloscope
Connect the Channel 1 Oscilloscope Probe
Connect the Channel 1 Oscilloscope Probe
1Connect the oscilloscope probe to channel 1 on the front panel of the analyzer.
2Connect the probe tip to the test point labeled "CLK 1" on the Logic Analyzer Training Board.
3Connect the probe ground lead to the test point labeled "GND" on the Logic Analyzer Training Board.
supply the +5 V power for the training board.
J1 - Pod 1 of the analyzer connects here.
Using the Oscilloscope
Get the Waveform on the Display
Get the Waveform on the Display
The Autoscale feature automatically scales the vertical sensitivity and the horizontal time base of the oscilloscope to provide a display of the waveform. This simplifies the setup of the oscilloscope and is very helpful when the amplitude and period of a signal are unknown.
1Press the Config key.
2Highlight the field in the top, left corner of the display and press the Select key. Highlight Scope in the
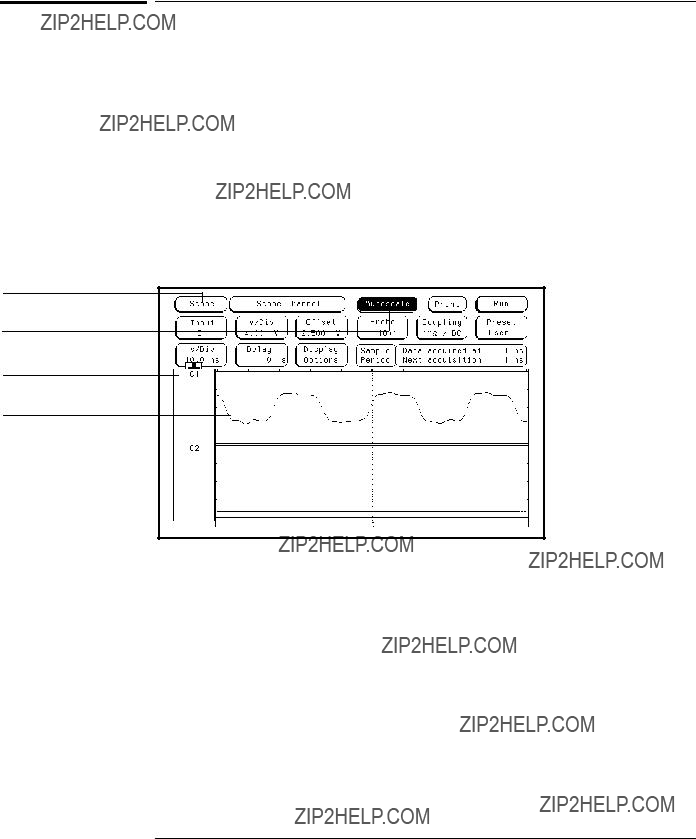
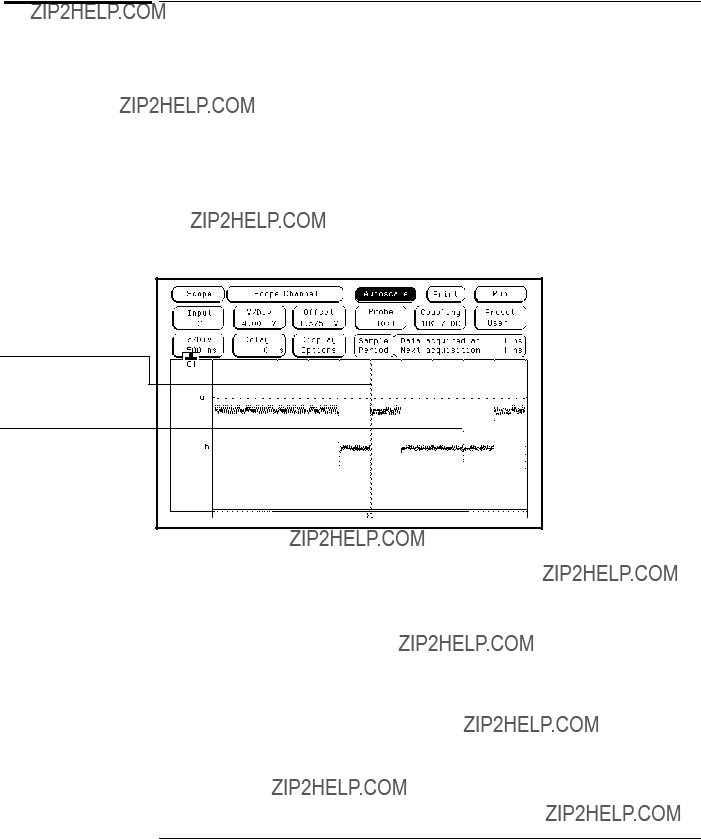
3Highlight the Autoscale field and press the Select key. Highlight Continue in the
The analyzer is in scope mode.
This field initiates the
Autoscale feature.
Channel designator
Training board clock signal

Using the Oscilloscope
Delete Channel 2 from the Display
Delete Channel 2 from the Display
You can delete the unused channels to get more display space.
1Highlight the bar on the left side of the waveform area.
2Using the knob, place the cursor on the channel 2 designator (C2), then press the Select key.
3Select Delete from the
This is channel 1 with the waveform of the training board clock signal displayed.

Using the Oscilloscope
Zoom and Scroll Through the Clock Waveform
Zoom and Scroll Through the Clock Waveform
You can use the s/Div field to set the time scale on the horizontal axis of the display from 1 ns/div to 5 s/div, and you can use the Delay field to scroll through the waveform.
1Highlight the s/Div field.
2Rotate the knob clockwise to expand the clock waveform. Rotate the knob counter clockwise to compress the waveform.
3Highlight the Delay field.
4Rotate the knob in both directions to scroll the clock waveform.
This field zooms the waveform in and out.
This field scrolls through the waveform.
Expanding and Scanning the Clock Waveform

Using the Oscilloscope
Measure the Clock Period Manually
Measure the Clock Period Manually
Time and voltage measurements can be made manually by turning the
T Markers field on.
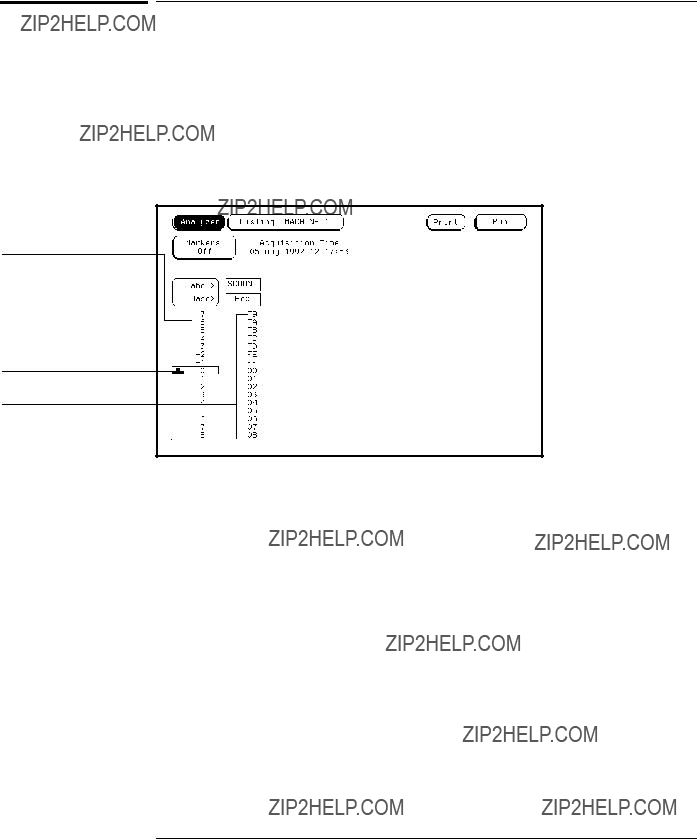
1Press the Marker MENU key. Marker is printed in white on the MENU key.
2Highlight the T Markers Off field and press the Select key. Highlight On in the
3Highlight the Trig to X field. Using the knob, move the X Marker to the lowest point on the negative pulse.
You may need to expand or compress the waveform, using the s/Div field to see a complete period of the waveform on the display.
4Highlight the Trig to O field. Using the knob move the O Marker to the same point on the next negative edge after the X Marker.
5Read the period of the clock in the Tx to To field.
Read the clock period in this field.
Highlight this field and select On.
Highlight this field and position the X Marker.
Highlight this field and position the O Marker.
Measuring the Clock Period Manually with the X and O Markers
Using the Oscilloscope
Measure the Clock Period with Auto Measure
Measure the Clock Period with Auto Measure
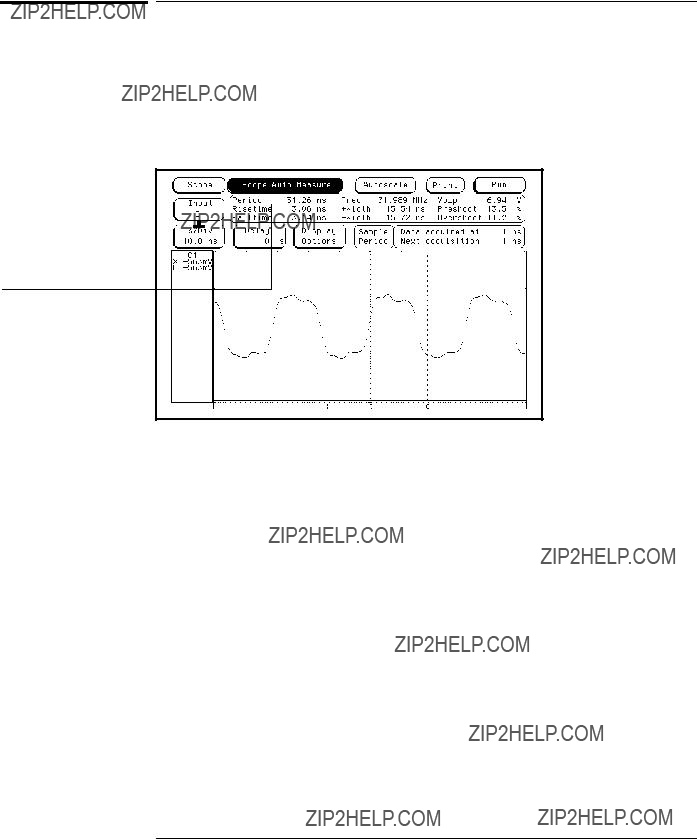
The Auto Measure function allows you to automatically measure many signal parameters.
1Press the Meas MENU key. Meas is printed in white on the MENU key.
2Read the clock period in the box below the top row of fields.
The clock period is displayed in this field.
Measuring the Clock Period with Auto Measure
Using the Oscilloscope
Read Voltage with the Markers
Read Voltage with the Markers
You can use the time and voltage markers to make time and voltage measurements at specific points on the waveform.
1Press the Marker MENU key.
2Highlight the V Markers Off field, and press the Select key.
3Highlight the Va Volts field. Rotate the knob and watch the Va marker scroll up and down the screen across the displayed waveform.
Notice the changing voltage value in the Va Volts field.
Use this field to position the Va Marker.
The Va Marker.
The Vb Marker.
Reading the Voltage at the Markers

8
Triggering the Oscilloscope with the Timing Analyzer
Triggering the Oscilloscope with the Timing Analyzer
You can use the oscilloscope and the timing analyzers together so that the data and trigger points can be
These exercises show you how to make the timing analyzer trigger the oscilloscope inside the analyzer to find a glitch on the training board.
To do these exercises you need an HP 1660CS, HP 1661CS,
HP 1662CS, or an HP 1663CS analyzer. The CS models have the built in oscilloscope.
In this chapter, you will:
???Set the jumpers
???Connect the oscilloscope probe
???Get the waveform on the display
???Change the oscilloscope trigger
???Turn on the timing analyzer
???Set up the timing format menu
???Define the timing trigger term
???Set up the timing trigger specification
???Arm the oscilloscope with the timing analyzer
???Add oscilloscope waveform to the timing waveforms
???Capture the glitch with the timing analyzer and oscilloscope
???Align the glitch displayed by the oscilloscope and analyzer
Triggering the Oscilloscope with the Timing Analyzer
Before You Begin
Before You Begin
1Decide what to do next.
If you have just completed all of the exercises in Chapters 2 through 7, go to the "Set the Jumpers" exercise, on the next page.
If you have not just completed all of the exercises in Chapters 2 through 7, go to step 2.
2Load the configuration files CH08._A, and CH08._B.
When loading these files, you must set the analyzer to load All, because you are loading two types of files for this exercise. Setting the analyzer to load Analyzer like you did in previous exercises, will only load CH07._A properly.
The files will default all system settings and then set up the analyzer and oscilloscope as if you had just completed all of the exercises in Chapters 2 through 7. If you need instructions to load the configuration files, refer to chapter 11, "To Load a Configuration File."
3Connect Pod 1.
Connect Pod 1 of the analyzer to J1 on the Training Board. For the
HP 1660s, Pod 1 is the top cable in the
Triggering the Oscilloscope with the Timing Analyzer
Set the Jumpers
Set the Jumpers
You will create the glitch on bit 7 of the counter on the training board by setting the glitch jumper to ON.
???Set the jumpers as shown below.
For more information about setting the jumpers, refer to chapter 11, "To Set the Jumpers."
Setting the Jumpers

Triggering the Oscilloscope with the Timing Analyzer
Connect the Oscilloscope Probe
Connect the Oscilloscope Probe
1Connect the oscilloscope probe to channel 1 on the front panel.
2Connect the probe tip to the test point labeled "Glitch" on the Logic Analyzer Training Board.
Note that this is a different test point than the "CLK 1" test point that was used in Chapter 7.
3Connect the probe ground lead to the test point labeled "Ground" on the training board.
J1 - Pod 1 of the analyzer connects here.
GND - Oscilloscope ground connects here.
GLITCH - Oscilloscope
probe tip connects here. Connecting the Oscilloscope Probe
Triggering the Oscilloscope with the Timing Analyzer
Get the Waveform on the Display
Get the Waveform on the Display
The first step when using an oscilloscope is to get the waveform on the display. Autoscale is an algorithm that automatically optimizes the display of one or more waveforms. The oscilloscope triggers at an arbitrary point until you set up the trigger conditions.
1Press the Config key.
2Highlight the field in the top, left corner of the display, and press the Select key. Highlight Scope in the
3Highlight the Autoscale field and press the Select key. Highlight Continue in the
The arbitrary trigger point happens to be on a rising edge.
The glitch you will capture with the timing analyzer and the oscilloscope.
Triggering the Oscilloscope with the Timing Analyzer
Change the Oscilloscope Trigger
Change the Oscilloscope Trigger
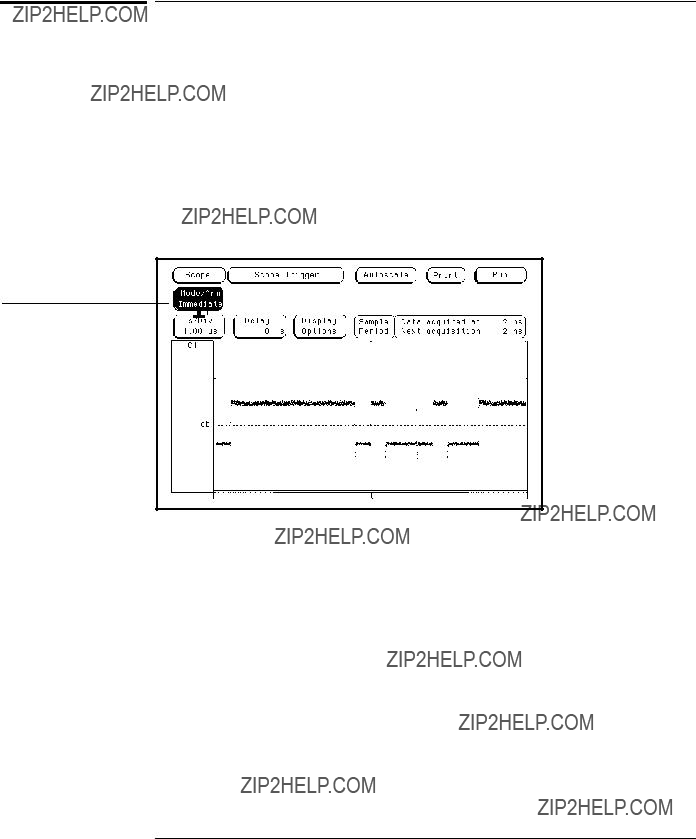
You will be using the timing analyzer to find the glitch and then the oscilloscope to display it. This correlation of timing and scope is done by arming the scope with the timing analyzer. To capture the glitch on the scope, you want it to capture data immediately after the glitch is captured by the timing analyzer.
1Press the Trigger MENU key.
2Highlight the Mode/Arm Edge field at the left side of the display, and press the Select key.
3Highlight Immediate in the
Setting this field to Immediate tells the oscilloscope to trigger immediately after the timing analyzer triggers.
Changing the Oscilloscope Trigger

Triggering the Oscilloscope with the Timing Analyzer
Turn On the Timing Analyzer
Turn On the Timing Analyzer
Now you will begin to set up the timing analyzer to capture the glitch.
1Highlight the Scope field and press the Select key. Highlight Analyzer in the
2Press the Config MENU key.
If the Configuration menu is already displayed when you press the Config key, then a
3Highlight the field to the right of Type in the Analyzer 1 box and press the Select key. Highlight Timing in the
Triggering the Oscilloscope with the Timing Analyzer
Set Up the Timing Format Menu
Set Up the Timing Format Menu
Because you will be making a timing measurement, you will use the TCOUNT label that represents timing count. You will also set the timing acquisition mode to capture the glitch.
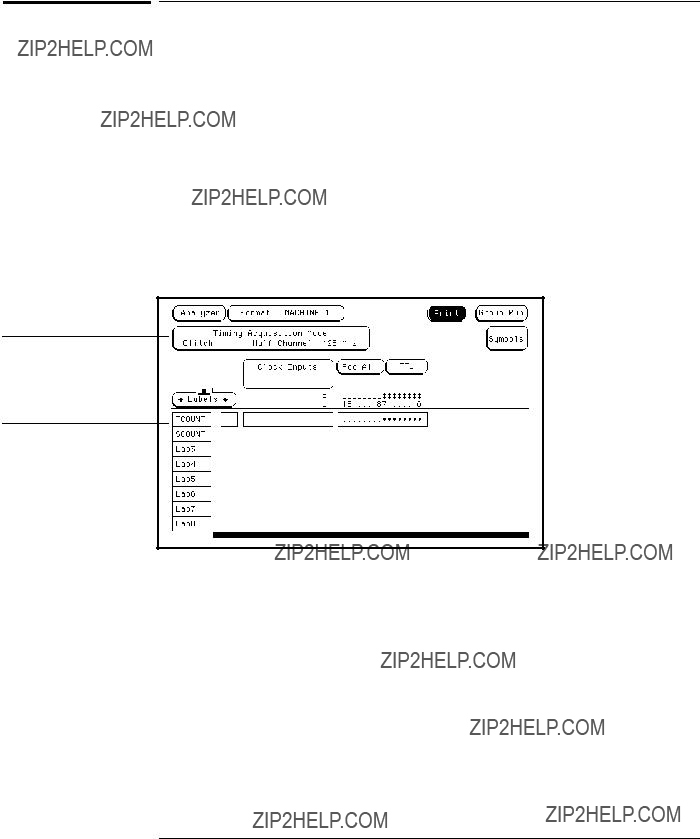
1Press the Format MENU key.
2Highlight the SCOUNT label, and press the Select key. Highlight Turn Label Off in the
3Highlight the TCOUNT label, and press the Select key. Highlight Turn Label On in the
4Highlight the Timing Acquisition Mode, and press the Select key. Highlight Glitch, Half Channel, 125 MHz in the
Select key.
The Timing Acquisition Mode set to capture the glitch.
The TCOUNT label that represents timing count.

Triggering the Oscilloscope with the Timing Analyzer
Define the Timing Trigger Term "Edge 1"
Define the Timing Trigger Term "Edge 1"
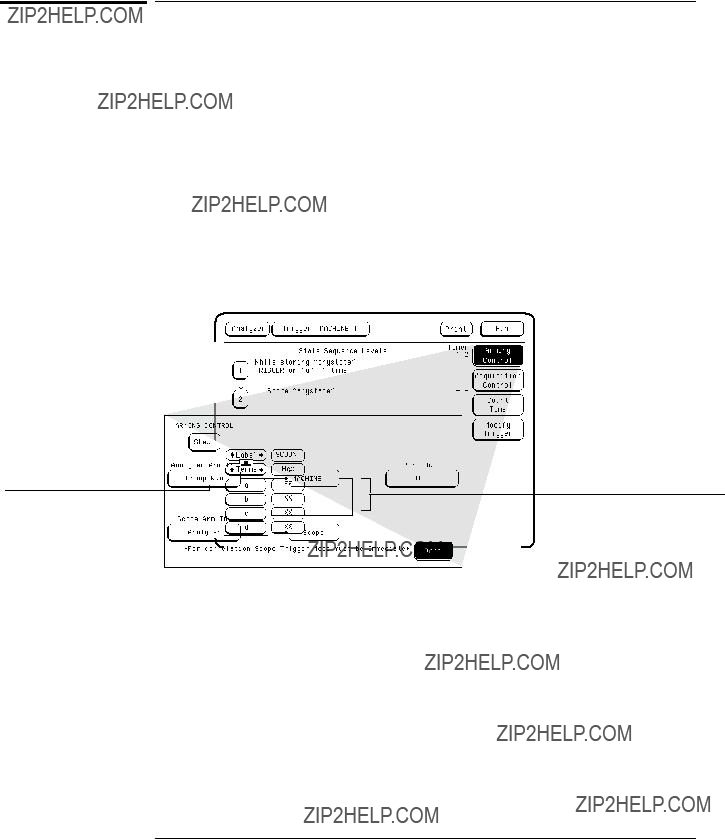
The timing analyzer can be configured to trigger on edges, or a glitch. In this exercise, you will set the trigger term to glitch on bit 7.
1Press the Trigger MENU key.
2Highlight the Modify Trigger field, and press the Select key. Highlight Clear Trigger, press the Select key, then highlight All, and press the
Select key.
3Highlight the base field below TCOUNT, and press the Select key. Highlight Binary in the
4Highlight the field to the right of Edge 1, and press the Select key.
5Using the arrow key, move the cursor to highlight the asterisk in the
The asterisk tells the analyzer to look for a glitch on bit 7 of the counter.
Edge 1
Bit 7
Defining Timing Trigger Terms Edge 1
Triggering the Oscilloscope with the Timing Analyzer
Set Up the Timing Trigger Specification
Set Up the Timing Trigger Specification
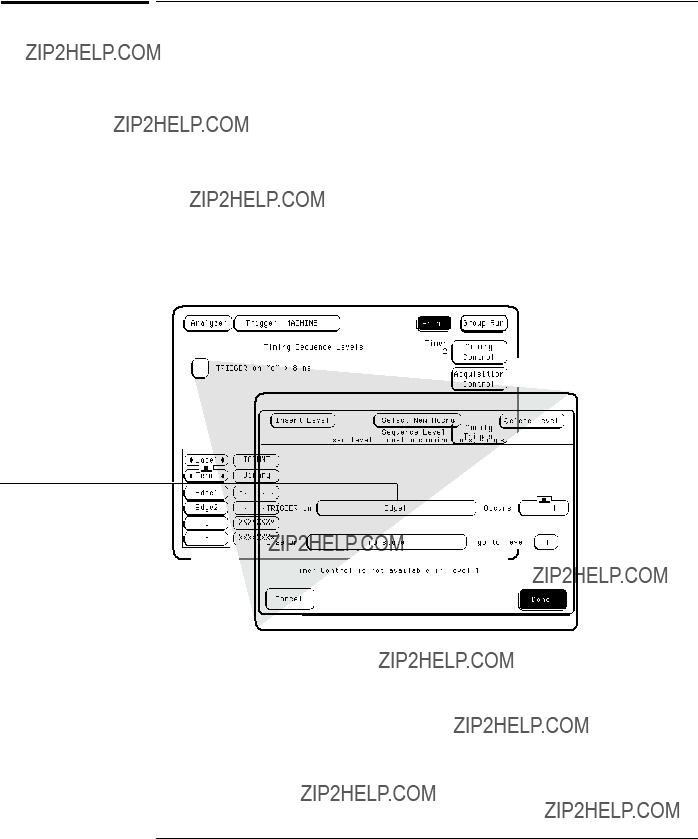
You will now tell the analyzer to trigger on the glitch the first time it occurs.
1Highlight the 1 field in the Timing Sequence Levels box, and press the
Select key.
2Highlight the ">" field, and press the Select key. Highlight Occurs in the
3Highlight the field next to Trigger on, and press the Select key. Highlight Edge 1 in the
4Highlight the field next to Else on, and press the Select key. Highlight no state in the
5Press the Done key to close the Sequence Level 1
The trigger term "Edge1" is set for the analyzer to look for the glitch on bit 7.
Triggering the Oscilloscope with the Timing Analyzer
Arm the Oscilloscope with the Timing Analyzer
Arm the Oscilloscope with the Timing Analyzer
The timing analyzer and the oscilloscope can be configured so that the timing analyzer???s glitch triggering capability will capture the glitch, and then arm the oscilloscope so that it, too, captures the glitch.
1Highlight the Arming Control field at the far right side of the screen, and press the Select key.
2Highlight the field under Scope Arm In, and press the Select key. Highlight Analyzer in the
When you select the analyzer to arm the scope, the field under
Analyzer Arm In changes to Group Run.
3Press the Done key to exit the Arming Control
The timing analyzer starts when Group Run is initiated.
Arming the Oscilloscope with the Timing Analyzer
The oscilloscope is armed by the Timing Analyzer.
Triggering the Oscilloscope with the Timing Analyzer
Add Oscilloscope Waveform to the Timing Waveforms
Add Oscilloscope Waveform to the Timing Waveforms
To see the correlation between the timing analyzer and the oscilloscope, you must insert the scope display into the timing waveform display.
1Press the Wform MENU key to display the Waveform Machine1 menu.
2Highlight the large field at the left side of the display. The TCOUNT label should be displayed in the large field.
If the TCOUNT label is not in the large field, then you need to add it. To add the TCOUNT label, highlight the large field, then press the Select key twice. Choose Insert, Analyzer, TCOUNT, then Sequential in the
3Using the knob, place the cursor on the TCOUNT 7 label.
4Press the Select key.
5Choose Insert, Scope, then C1 (oscilloscope channel 1) in the
The oscilloscope waveform is added to the analyzer display.

Triggering the Oscilloscope with the Timing Analyzer
Capture the Glitch with the Timing Analyzer and Oscilloscope
Capture the Glitch with the Timing Analyzer and
Oscilloscope
The timing analyzer runs, triggers, and then arms the oscilloscope. Notice the slight delay between the glitch displayed by the timing analyzer and the oscilloscope. This is caused by the intermodule bus when one instrument arms another. In the following exercise, you will align the glitch in the two displays.
1Highlight the Group Run field, and press the Select key. Highlight Single in the
2Highlight the s/Div field, then rotate the knob to change the s/Div to 20 ns.
You will now see the glitch on both the oscilloscope waveform, and on TCOUNT 7 in the timing analyzer section of the display.
The glitch captured by the timing analyzer.
The glitch captured by the oscilloscope.
Capturing the Glitch on the Oscilloscope

Triggering the Oscilloscope with the Timing Analyzer
Align the Glitch Displayed by the Oscilloscope and Analyzer
Align the Glitch Displayed by the Oscilloscope and
Analyzer
You can align the glitch displayed by the analyzer and scope by measuring the distance between the falling edge on the timing display with the falling edge of the scope display. Then you use the skew feature to move the timing waveform over so that the two displays are aligned.
1Highlight the Markers Off field, and press the Select key. Highlight Time in the
2Highlight the Trig to O field, and use the knob to place the O marker on the falling edge of the glitch shown by the scope.
3Take note of the time delay in ns between the trigger point and the O marker. This is the time delay you will use to realign the two displays.
The time delay.
Measuring the Time Delay
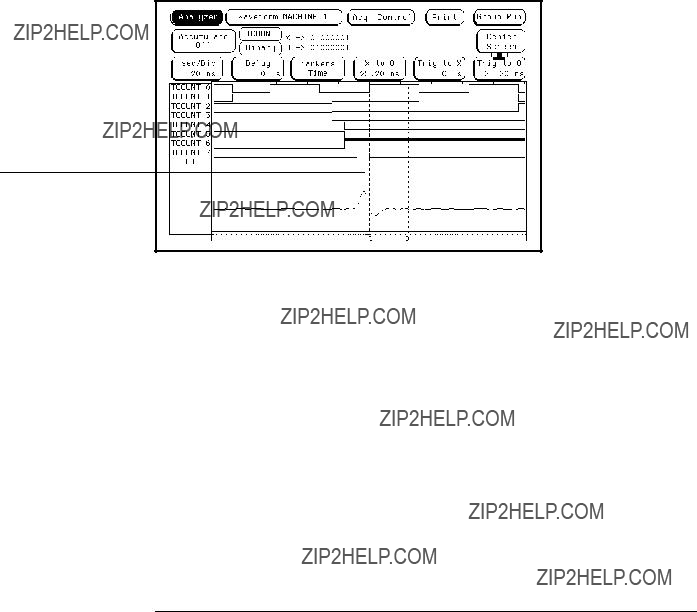
Triggering the Oscilloscope with the Timing Analyzer
Align the Glitch Displayed by the Oscilloscope and Analyzer
4Press the Trigger MENU key.
5Highlight the Arming Control field and press the Select key.
6With the Skew field highlighted, press the Select key.
7With the Analyzer field highlighted, press the Select key.
8Use the knob to change the units to ns, and type in the time delay you measured with the Trig to O marker.
9Press the Done key until you return to the Trigger Menu.
10Highlight the Group Run field, and press the Select key. Highlight Single in the
The timing waveform is now lined up with the oscilloscope waveform.

9
Using the Pattern Generator
Using the Pattern Generator
The pattern generator provides programmable digital output that can be used to stimulate and control a system under test. These exercises will show you how to program the pattern generator so that it provides a pattern of "walking ones." Because the pattern generator is an output module, the timing analyzer will be used to view the pattern generator???s output.
These exercises also show you a simple process that represents basic stimulus/response testing. For example, if you are applying the "walking ones" pattern from the pattern generator to a memory, you can use the timing analyzer to see if the "walking ones" pattern is being written to and read from memory properly.
In this chapter, you will:
???Connect the pattern generator
???Turn on the timing analyzer
???Change a label name
???Modify channel assignments
???Set up the timing analyzer trigger
???Add a pattern generator label to the timing waveform display
???Set up the pattern generator format menu
???Program the pattern generator output
???Add program lines
???Start the pattern generator and view the walking ones pattern
???Stop the pattern generator
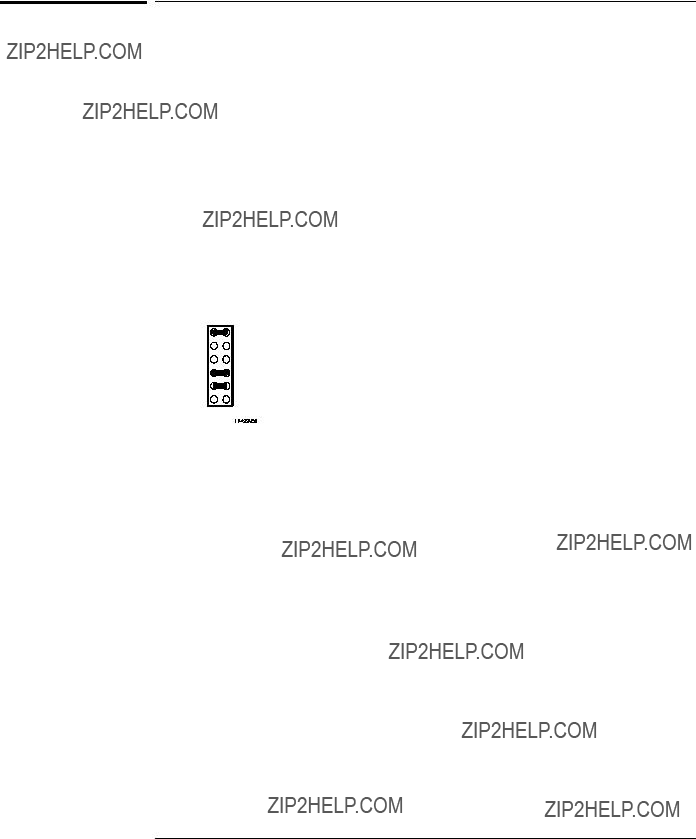
Using the Pattern Generator
Before You Begin
Before You Begin
1Load the configuration file for chapter 3, CH03_60._A.
If you need instructions to load the configuration files, refer to chapter 11, "To Load a Configuration File."
2Connect Pod 1.
Connect Pod 1 of the analyzer to J1 on the Training Board. For the
HP 1660s, Pod 1 is the top cable in the
3Set the jumpers as shown below
The jumper setting of J5 on the training board for this chapter are the same as the default settings. For more information about setting the jumpers, refer to chapter 11, "To Set the Jumpers."

Using the Pattern Generator
Connect the Pattern Generator
Connect the Pattern Generator
???Connect the pattern generator output Pod 4 to the TTL Data Pod. Then connect the TTL Data Pod to J4 (labeled PATTERN GENERATOR) on the training board.
For more information about setting the jumpers, refer to chapter 11, "To Set the Jumpers."
Pod 4 of the pattern generator.
J4 - The TTL Data Pod, with Pod 4 of the pattern generator attached, connects to the training board here.
J1 - Pod 1 of the analyzer connects here.
Connecting the Pattern Generator

Using the Pattern Generator
Turn On the Timing Analyzer
Turn On the Timing Analyzer
1Press the Config MENU key.
If the Configuration menu is already displayed when you press the Config key, then a
2Highlight the field to the right of Type in the Analyzer 1 box and press the Select key. Highlight Timing in the
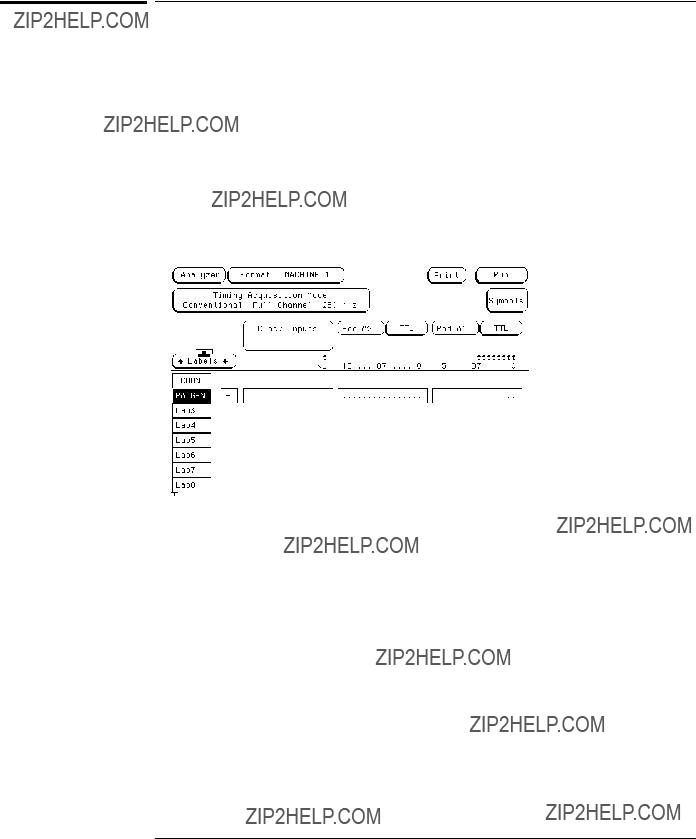
Using the Pattern Generator
Change a Label Name
Using the Pattern Generator
Modify Channel Assignments
Modify Channel Assignments
In this exercise you will assign channels 8 through 11 to Pod A1, which is attached to J1 of the training board. The analyzer will then use these channels to capture the output of the pattern generator.
1Highlight the field showing the 16 channels of Pod A1 to the far right of the PATGEN label. Press the Select key.
2Using the knob, move the cursor to channel 11 in the
3Press the Done key.
The asterisks (*) assign bits 8 through 11 of Pod A1 to the label PATGEN.

Using the Pattern Generator
Set Up the Timing Analyzer Trigger Term
Set Up the Timing Analyzer Trigger Term
The trigger term ???a??? is set to 1 so that the analyzer will trigger on the "walking ones" provided by the pattern generator.
1Press the Trigger MENU key.
2Highlight the field to the right of term "a", and type a 1 into the field.
3Press the Done key.
4Highlight the 1 field in the Timing Sequence Levels box, and press the
Select key.
5Highlight the field to the right of >, and turn the knob to select 8 ns for the pattern duration. Press the Done key.
The analyzer is set up to trigger on the occurrence of a 1.
The a term holds the value 1.

Using the Pattern Generator
Add a Pattern Generator Label to the Timing Waveform Display
Add a Pattern Generator Label to the Timing
Waveform Display
The new label PATGEN must be added to the Waveform display for the captured data to be displayed.
1Press the Waveform menu key.
2Highlight the field under Labels on the left side of the screen, and press the Select key twice.
3Press the Select key to select Insert.
4Press the Select key to select PATGEN.
5Choose Sequential from the
The PATGEN label is placed in the Waveform display.

Using the Pattern Generator
Set Up the Pattern Generator Format Menu
Set Up the Pattern Generator Format Menu
For the pattern generator to output the "walking ones" to the logic analyzer, the lower four bits of Pod 4, which is connected to the training board through the TTL Data Pod, must be assigned to PATGEN.
1Highlight the Analyzer field in the
2If the Format Menu of the Pattern Generator is now displayed, go to step 4.
3Press the Format MENU key.
4Highlight Lab1 below Label, and press the Select key. Highlight Modify Label in the
5Type PATGEN, and Press the Done key.
6Highlight the field showing the Pod B4 to the right of PATGEN, and press the Select key.
The lower 4 bits of Pod B4 are assigned to output the "walking ones" .
Setting Up the Pattern Generator Format Menu

Using the Pattern Generator
Set Up the Pattern Generator Format Menu
7Using the knob, move the cursor to channel 3 in the
8Press the Done key.
8Highlight the field showing the Pod B3 to the left of the field you just modified, and press the Select key.
9Press the Clear Entry key. Press the Done key.
10Highlight the field showing the Pod B1, and press the Select key.
11Press the Clear Entry key. Press the Done key.
Using the Pattern Generator
Program the Pattern Generator Output
Program the Pattern Generator Output
The Sequence window is used to program the pattern generator output. In this exercise, you will change the base field to binary and program the first "walking one."
1Highlight the Pat Gen Format field, and press the Select key.
2Highlight Pat Gen Sequence field in the
Select key.
3Highlight the base field below the PATGEN field, and press the Select key. Highlight Binary in the
4Use the knob to scroll to the field under
***MAIN SEQUENCE START***.
5Use the arrow keys to highlight the
6Press the Select key. Type 0001 and press the Done key.
Using the Pattern Generator
Add Program Lines
Add Program Lines
You will need four lines for the "walking ones" program. In this exercise, you will insert two lines after 0001 and complete the walking ones program.
1Highlight the Insert field, and press the Select key two times to add two additional program lines to the listing.
2Using the knob, scroll to the next program line for the next "walking one."
3Highlight the
4Type 0010 in the field, and press the Done key.
5Repeat steps 2 through 4 for program lines 2 and 3 entering 0100, then 1000, respectively.
The "walking ones" program.

Using the Pattern Generator
Start the Pattern Generator and View the Walking Ones Pattern
Start the Pattern Generator and View the Walking
Ones Pattern
When you select Run and Repetitive, the Pattern Generator begins to run in repetitive mode. The output is the repeating "walking ones" pattern. You will not see this output until you switch to the timing analyzer waveform display.
The pattern generator will run independently until you stop it by pressing the
Stop key.
1On the front panel of the logic analyzer, press the blue SHIFT key, and then push the Run key to run the pattern generator repetitively.
2Highlight the Patt Gen in the
3Highlight the the Run field, and press the Select key. Choose Single, and press the Select key.
The Timing analyzer runs a single trace and automatically displays the Waveform 1 menu in which you see the "walking ones" patter.
4Highlight the s/Div field.
5Turn the knob until the s/Div field displays 20 ns.
Starting the Pattern Generator and Viewing the Walking Ones Pattern
Using the Pattern Generator
Stop the Pattern Generator
Stop the Pattern Generator
1Highlight the Analyzer field, and press the Select key. Highlight Patt Gen in the
2Highlight the Stop field, and press the Select key.
The pattern generator requires CPU time when it is running independently in the repetitive mode. Stopping the pattern generator now will prevent other exercises that do not use it from running slower than normal.

10
Introduction to Inverse Assembly

Introduction to Inverse Assembly
An inverse assembler translates the captured data into microprocessor instructions.
To perform inverse assembly, you must probe a microprocessor and load the correct configuration and inverse assembler. The training board does not have a microprocessor. Therefore, for these exercises you will load a sample listing to simulate the captured microprocessor instructions.
In this chapter you will:
???Load the inverse assembler and sample listing
???View the address, data, and status labels
???View the assembly listing
???Filter the captured data
Introduction to Inverse Assembly
Load the Inverse Assembler and Sample Listing
Load the Inverse Assembler and Sample Listing
In this exercise you will load a configuration file and the inverse assembler to translate the binary data. You will not be making the measurement because the training board does not have a microprocessor.
1Place the flexible disk labeled "Logic Analyzer Training Kit Configurations" in the disk drive.
2Press the Config MENU key.
3Highlight the field to the right of Type in the Analyzer 1 box. Press the Select key and choose State in the
4Press the System MENU key.
5Highlight the field to the right of System, press the Select key, and choose Flexible Disk in the
6If you are using an HP 1660 series analyzer, load the Analyzer with these files:
???IA386E (inverse assembler)
???TRC_386._A. (sample listing)
7If you are using an HP 1670 series analyzer, load the Analyzer with these files:
???ICPU32 (inverse assembler)
???TRC_32._A (sample listing)

Introduction to Inverse Assembly
View the Address, Data, and Status Labels
View the Address, Data, and Status Labels
The labels, pods and bit assignments were configured when you loaded the sample listing. Often, you will load a configuration file you built or one supplied with the preprocessor.
There are three labels the inverse assembler needs to translate the binary data correctly: ADDR (address bus), DATA (data bus), and STAT (status). These labels must be capitalized to be recognized by the inverse assembler.
1Press the Format MENU key.
2Notice the required ADDR, DATA, and STAT labels.
The ADDR label collects the activity on the address bus. The DATA label collects the data and is what the inverse assembler translates into instructions. The STAT label records the type of instruction or bus transaction.
3Highlight the Pods field and turn the knob counter clockwise to scroll through the pods.
Notice that the bits are already assigned to the pods of each label. If you are using a 1670 series analyzer, your label and bit assignments will be different than those in the graphic below. This is because you are using a different sample listing and assembler.
The Pods field is used to scroll through the pods to see the bit assignments.
The Labels field is used to scroll through the labels.
ADDR, DATA, and STAT are used by the inverse assembler.
Viewing the Address, Data, and Status Labels
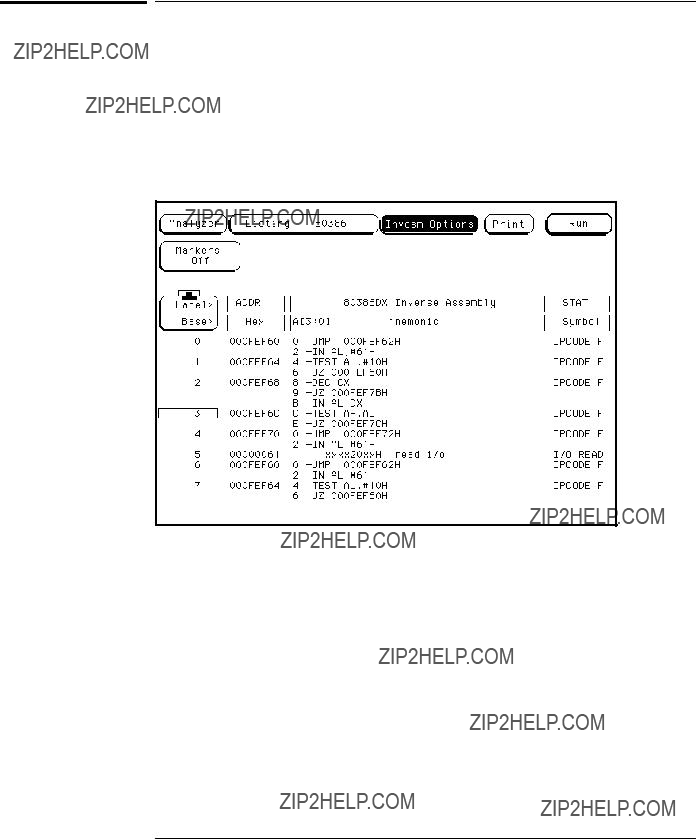
Introduction to Inverse Assembly
View the Assembly Listing
View the Assembly Listing
You can view the captured data in the mnemonic form just as you can view data in the Hex, Decimal, or Binary forms.
1Press the List MENU key.
If you are using a 1670 series analyzer, your listing will be different than the one in the graphic below. This is because you are using a different sample listing and inverse assembler.
Viewing the Assembly Listing
2Highlight the line number field on the left side of the display and use the knob to scroll down through the listing.
If the inverse assembler gets out of sync with the captured data the code will not be translated correctly. To realign the assembler and the data using an HP 1660 series analyzer, place one of the OPCODE F lines at the top of the screen. Then highlight the Invasm Options field, press the Select key, and choose Align from the Inverse Assembly Options
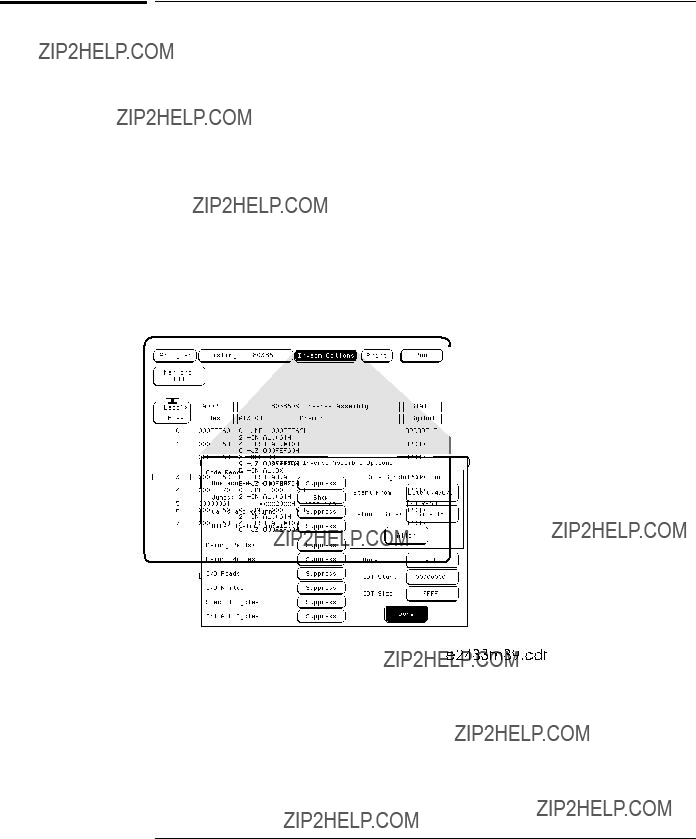
Introduction to Inverse Assembly
Filter the Captured Data
If the program you are running is large or you are not interested in looking at all of the code, you can suppress the types of instructions you are not interested in. In this exercise you will look at the general flow of the code by showing only the jumps and suppressing all other types of instructions.
1Highlight the Invasm Options field and press the Select key.
2Suppress all of the instruction types, except "Jumps:", by highlighting each field and pressing the Select key.
3Press the Done key to close the Inverse Assembly Options
4Use the knob to scroll through the listing of jumps.

11
Setting the Jumpers and
Loading the Configurations
Setting the Jumpers
The jumpers on J5 of the training board are used to control the source of the state clock and to turn the glitch on or off. Before you start each chapter, you should check the jumpers to make sure they are properly set. The "To Set the Jumpers" exercise, on the next page, gives you the information you need to change the jumpers. Table 1 shows you the jumper settings for the chapters .

Setting the Jumpers and Loading the Configurations
To Set the Jumpers
To Set the Jumpers
1Pull the appropriate jumper off of the pins of J5.
2Push the jumper onto the correct pins of J5. You only need to change jumpers that differ from the settings in table 1.
Set the jumpers at their default settings for all chapters. Table 1 shows you the default settings and the settings for each chapter. Chapter 4, "Comparing State Traces," and chapter 8, "Triggering the Oscilloscope with the Timing Analyzer," requires you to change the setting of the glitch jumper.
Glitch OFF
CLK2 
 P. G.
P. G.
OSC
P. G.
CLK1  CLK2
CLK2
GLITCH 
 OFF
OFF
ON
Glitch ON
J5 - Jumpers are set here.
Setting the Jumpers

Loading the Configurations
If you are not performing the exercises in order, you may need to load configuration files to set up your system so that you can complete the exercises. The "To Load a Configuration File" exercise on the next two pages gives you the information you need to load configuration files. The flexible disk labeled "Logic Analyzer Training Kit Configurations," which you received in this training kit, contains the configuration files. The files are listed in Table 2, below.
If you are doing the exercises for the first time, we recommend you follow the steps in each consecutive exercise, from chapter 1 through chapter 5, without loading the configuration files. If you do not want to do the exercises in order, you can load the files listed in the "Before You Begin" section of a chapter, then do the exercises in that chapter.
Setting the Jumpers and Loading the Configurations
To Load a Configuration File
To Load a Configuration File
There are two configuration files you will be loading. One for the analyzer CH0X._A, and one for the oscilloscope CH0X._B. For exercises that only use the analyzer, you will only load the CH0X._A file. For exercises using the scope, you will load both the CH0X._A and the CH0X._B files.
1Place the flexible disk labeled "Logic Analyzer Training Kit Configurations" in the disk drive.
2Press the System MENU key.
3Highlight the field to the right of System, then press the Select key. Choose Flexible Disk in the
If the file directory has not been previously read by the logic analyzer, you will see "reading directory . . ." before the directory listing is displayed.
4Highlight the field below the System field, on the left side of the screen, then press the Select key. Highlight Load in the
See the figure on the next page if you need help.
5Highlight the field to the right of Load, then press the Select key. Highlight Analyzer in the
The procedure for loading a configuration file continues on the next page.
6Using the knob, place the file name you want to load on the light gray center line of the display.
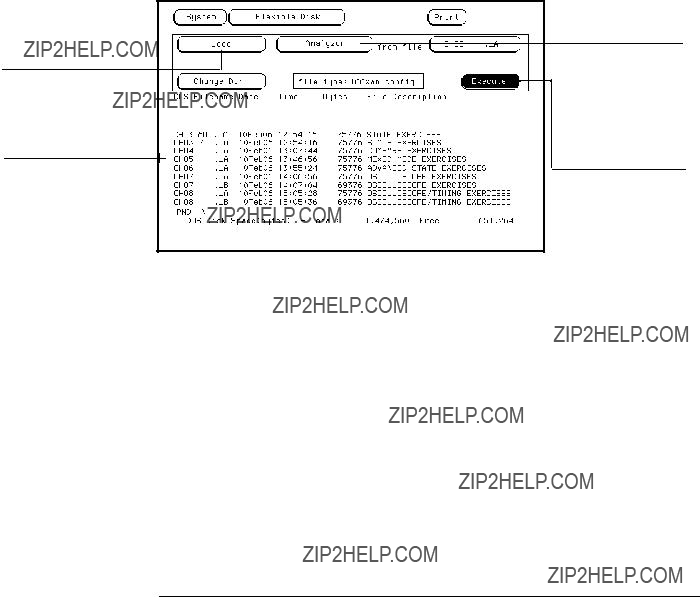
Setting the Jumpers and Loading the Configurations
To Load a Configuration File
Setting this field to Load tells the analyzer to load the file selected.
The knob places the name of the file you want to load on this line.
Setting this field to Analyzer tells the system to load the state and timing analyzers.
Selecting this field loads the file.
Loading a Configuration File

12
All About the Logic Analyzer
Training Board

C A U T I O N
All About the Logic Analyzer Training
Board
The training board helps you learn the basics of HP Logic Analyzers. The following reference information is provided for those who want to know more about how the training board works.
Power Source
The training board is powered by the +5 V supplied by the logic analyzer pods, so a logic analyzer pod must be connected to either J1 or J2 of the training board in order for the training board to work. If only J2 is connected, it must be connected to the logic analyzer through a termination adapter (HP part number
If the termination adapter part number is HP
If J1 is connected, the termination adapter is not required because J1 is terminated on the board by Z1 and Z2.
Circuit Description
The training board uses an
For state analysis, you can clock the state analyzer via the oscillator on the training board (reference designator Y1) or via a pattern generator in an HP 16500 system. The sources for clocks 1 and 2 are selected by the positions of jumpers CLK1 and CLK2, respectively. When the CLK1 and CLK2 jumpers are set to OSC (oscillator), the clock source for the state analyzer is the oscillator on the training board (Y1). When the CLK1 and CLK2 jumpers are set to P.G. (pattern generator), the clock source for the state analyzer is bit D7 or strobe 2 of the pattern generator, depending on which pattern generator pod is connected to J4.
All About the Logic Analyzer Training Board
Jumpers
The glitch is generated using the delay between the falling edge of D4 and rising edge of D5 of the ripple counter, and the delay using R2 with the input capacitance of the 74F02N. The ripple counter is a 74HC393. A 74F02 is used to generate the pulse (glitch) and combine it with D7 of the ripple counter. Because the 74F02 is a fast CMOS gate, it boosts the amplitude of the glitch it receives from the 74HC393 counter. This combination of logic families produces a positive glitch that is about 6 ns wide and has an amplitude of about 4 volts. The glitch is available on channel D7 of J1 and J2 when the GLITCH jumper is set to ON.
Jumpers
The jumpers are used to turn the glitch on and off and to select the sources for state clocks 1 (CLK1) and 2 (CLK2).
Glitch
When the GLITCH jumper is set to OFF, the waveform on D7 of J1 and J2 is the most significant bit of the counter. When this jumper is set to ON, a glitch appears on D7 and the waveform no longer represents the most significant bit of the counter. The glitch always appears on the test point labeled GLITCH, regardless of the position of this jumper.
CLK1
The CLK1 jumper selects the source of state clock 1. If you choose OSC (the default), the source of the clock will be the oscillator on the training board. If you choose P.G., the source of the clock will be Strobe 2 or D7 of the pattern generator, depending on which pattern generator pod you have connected to the training board.
CLK2
The CLK2 jumper selects the source of state clock 2 for the HP 16540A used in an HP 16500 system. If you choose OSC, the source of the clock will be the oscillator on the training board. If you choose P.G. (the default), the source of the clock will be Strobe 2 or D7 of the pattern generator, depending on which pattern generator pod you have connected to the training board.
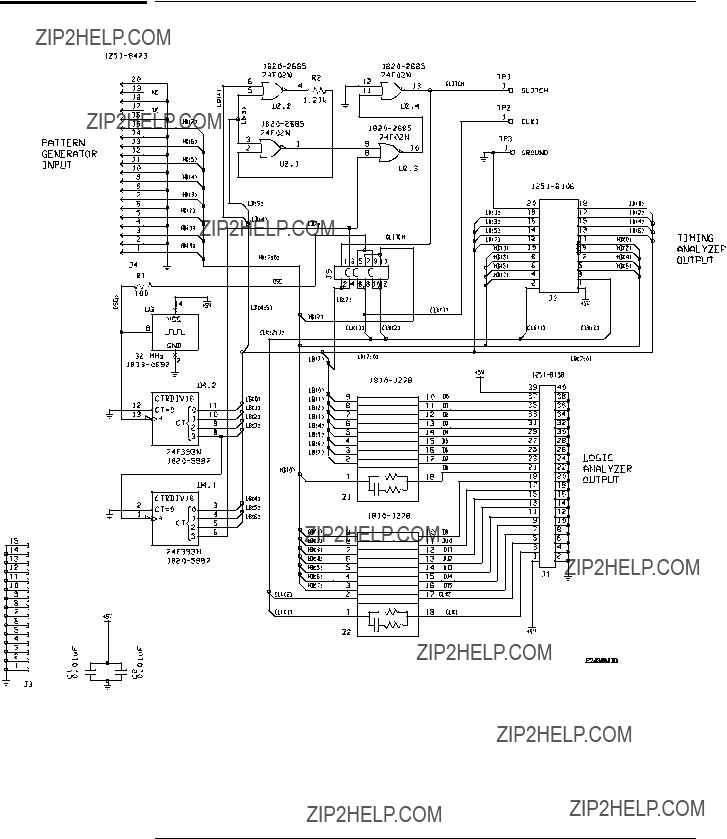
All About the Logic Analyzer Training Board
Logic Analyzer Training Board Schematic

Index
A
a thru j fields,
ADDR, DATA, STAT labels,
state,
set,
arming control,
arming the oscilloscope,
arrows
setting the state clock edge,
assembly code,
assigning channels
in the state analyzer,
Autoscale,
B
base field,
or function,
C
changing a label name,
changing the oscilloscope trigger,
unused,
circuit description,
CLK2,
edge,
J through P,
state, set the,
setting the state clock,
compare errors,
complex sequence of states,
loading,
to load a,
connecting the oscilloscope probe,
count time,
counter ripple,
creating symbols,
D
defining a term,
Delay field
scanning the waveform,
"don???t care",
E errors
compare,
Find Error field,
inverse assembly,
multilevel state triggering,
state analyzer,
F field
Autoscale,
G glitch
capture,
Glitch/Edge term,
H
highlighting a field,
I
immediate trigger mode,
activity,
Invasm,
loading,
J
CLK1,
CLK2,
default settings,
setting,
L
label name changing,
labels,
ADDR, DATA, STAT,
difference,
logic high,

Index
M
marker placement
markers,
measuring the clock period Auto Measure,
mixed display,
mixed mode exercises,
modifying channel assignments,
O
connecting the probe,
P
page keys,
duration,
pattern generator,
pattern generator format menu,
pods,
power source,
connect,
program, "walking ones",
R
range term,
ripple counter output,
single or repetitive,
S
s/Div field,
expanding the waveform,
scrolling,
timing waveform,
setting up state trigger,
adding,
setting up the state clock,
setting up the trigger specification,
state analysis,
state analyzer exercises,
viewing and changing,
state trigger terms defining,
storage qualification,
stored states,
creating,
T term
combination,
defining,
termination adapter,
count,
stamp,
time correlated,
timing analysis,
Timing Acquisition Mode,
Training Kit
materials needed,
Trig to X field,
define a term,
trigger specification state,
trigger term range,
U
unused channel deleting,
using the analyzer interface,
making a measurement,
V
voltage markers,
W
waveform
adding oscilloscope to timing,
zooming,
"While storing no state",
X
Z zooming
timing waveform,
?? Copyright Hewlett-
Packard Company
All Rights Reserved.
Reproduction, adaptation, or translation without prior written permission is prohibited, except as allowed under the copyright laws.
Document Warranty
The information contained in this document is subject to change without notice.
Safety
This apparatus has been designed and tested in accordance with IEC Publication 348, Safety Requirements for Measuring Apparatus, and has been supplied in a safe condition. This is a Safety Class I instrument (provided with terminal for protective earthing). Before applying power, verify that the correct safety precautions are taken (see the following warnings). In addition, note the external markings on the instrument that are described under "Safety Symbols."
Warning
???Before turning on the instrument, you must connect the protective earth terminal of the instrument to the protective conductor of the (mains) power cord. The mains plug shall only be inserted in a socket outlet provided with a protective earth contact. You must not negate the protective action by using an extension cord (power cable) without a protective conductor (grounding). Grounding one conductor of a
???Only fuses with the required rated current, voltage, and specified type (normal blow, time delay, etc.) should be used. Do not use repaired fuses or
???Service instructions are for trained service personnel. To avoid dangerous electric shock, do not perform any service unless qualified to do so. Do not attempt internal service or adjustment unless another person, capable of rendering first aid and resuscitation, is present.
???If you energize this instrument by an auto transformer (for voltage reduction), make sure the common terminal is connected to the earth terminal of the power source.
???Whenever it is likely that the ground protection is impaired, you must make the instrument inoperative and secure it against any unintended operation.
???Do not operate the instrument in the presence of flammable gasses or fumes. Operation of any electrical instrument in such an environment constitutes a definite safety hazard.
???Do not install substitute parts or perform any unauthorized modification to the instrument.
???Capacitors inside the instrument may retain a charge even if the instrument is disconnected from its source of supply.
???Use caution when exposing or handling the CRT. Handling or replacing the CRT shall be done only by qualified maintenance personnel.
Safety Symbols
Instruction manual symbol: the product is marked with this symbol when it is necessary for you to refer to the instruction manual in order to protect against damage to the product.
Hazardous voltage symbol.
Earth terminal symbol: Used to indicate a circuit common connected to grounded chassis.
W A R N I N G
The Warning sign denotes a hazard. It calls attention to a procedure, practice, or the like, which, if not correctly performed or adhered to, could result in personal injury. Do not proceed beyond a Warning sign until the indicated conditions are fully understood and met.
C A U T I O N
The Caution sign denotes a hazard. It calls attention to an operating procedure, practice, or the like, which, if not correctly performed or adhered to, could result in damage to or destruction of part or all of the product. Do not proceed beyond a Caution symbol until the indicated conditions are fully understood or met.
P.O. Box 2197
1900 Garden of the Gods Road
Colorado Springs, CO 80901

Product Warranty
This
For warranty service or repair, this product must be returned to a service facility designated by
For products returned to
Limitation of Warranty
The foregoing warranty shall not apply to defects resulting from improper or inadequate maintenance by the Buyer,
No other warranty is expressed or implied.
Exclusive Remedies
The remedies provided herein are the buyer???s sole and exclusive remedies.
Assistance
Product maintenance agreements and other customer assistance agreements are available for
For any assistance, contact your nearest
Certification
About this edition
This is the first edition of the
HP
Publication number
Printed in USA.
Edition dates are as follows:
First edition, November 1997
New editions are complete revisions of the manual. Update packages, which are issued between editions, contain additional and replacement pages to be merged into the manual by you. The dates on the title page change only when a new edition is published.
A software or firmware code may be printed before the date. This code indicates the version level of the software or firmware of this product at the time the manual or update was issued. Many product updates do not require manual changes; and, conversely, manual corrections may be done without accompanying product changes. Therefore, do not expect a
The following list of pages gives the date of the current edition and of any changed pages to that edition.
All pages original edition