User???s Guide
HP 86140A Series
Optical Spectrum Analyzer
User???s Guide
HP 86140A Series
Optical Spectrum Analyzer

?? Copyright
All Rights Reserved. Repro- duction, adaptation, or trans- lation without prior written permission is prohibited, except as allowed under copy- right laws.
HP Part No.
Printed in USA
February 2000
1400 Fountaingrove Parkway Santa Rosa, CA
USA
(707)
Notice.
The information contained in this document is subject to change without notice. Com- panies, names, and data used in examples herein are ficti- tious unless otherwise noted.
Restricted Rights Legend.
Use, duplication, or disclo- sure by the U.S. Government is subject to restrictions as set forth in subparagraph (c) (1) (ii) of the Rights in Technical Data and Computer Software clause at DFARS
Warranty.
This
Limitation of Warranty.
The foregoing warranty shall not apply to defects resulting from improper or inadequate maintenance by Buyer, Buyer- supplied software or interfac- ing, unauthorized modifica- tion or misuse, operation outside of the environmental specifications for the product, or improper site preparation or maintenance.
No other warranty is expressed or implied.
ii

W A R N I N G
W A R N I N G
W A R N I N G
W A R N I N G
C A U T I O N
C A U T I O N
General Safety Considerations
General Safety Considerations
This product has been designed and tested in accordance with IEC Publica- tion 1010, Safety Requirements for Electronic Measuring Apparatus, and has been supplied in a safe condition. The instruction documentation contains information and warnings which must be followed by the user to ensure safe operation and to maintain the product in a safe condition.
Install the instrument according to the enclosure protection provided. This instrument does not protect against the ingress of water.
This instrument protects against finger access to hazardous parts within the enclosure.
If this product is not used as specified, the protection provided by the equipment could be impaired. This product must be used in a normal condition (in which all means for protection are intact) only.
No operator serviceable parts inside. Refer servicing to qualified service personnel. To prevent electrical shock do not remove covers.
This is a Safety Class 1 Product (provided with a protective earthing ground incorporated in the power cord). The mains plug shall only be inserted in a socket outlet provided with a protective earth contact. Any interruption of the protective conductor inside or outside of the instrument is likely to make the instrument dangerous. Intentional interruption is prohibited.
To prevent electrical shock, disconnect the instrument from mains before cleaning. Use a dry cloth or one slightly dampened with water to clean the external case parts. Do not attempt to clean internally.
This product is designed for use in Installation Category II and Pollution Degree 2 per IEC 1010 and 664 respectively.
iii

C A U T I O N
C A U T I O N
C A U T I O N
C A U T I O N
C A U T I O N
General Safety Considerations
Do not use too much liquid in cleaning the optical spectrum analyzer. Water can enter the
VENTILATION REQUIREMENTS: When installing the product in a cabinet, the convection into and out of the product must not be restricted. The ambient temperature (outside the cabinet) must be less than the maximum operating temperature of the product by 4?? C for every 100 watts dissipated in the cabinet. If the total power dissipated in the cabinet is greater than 800 watts, then forced convection must be used.
Always use the
Do not connect ac power until you have verified the line voltage is correct as described in ???Line Power Requirements??? on page
This instrument has autoranging line voltage input. Be sure the supply voltage is within the specified range.
iv

Contents
HP 86140/2 Front and Rear Panels
The Softkey Panels
3Using the Optical Spectrum Analyzer
The Bandwidth/Sweep Menus
The Save/Recall Menus
Monitoring the Instrument
Front Panel Functions to Remote Commands
CALCulate Subsystem Commands

Contents
MMEMory Subsystem Commands
HP 71450 Series Commands to HP 86140 Series Equivalents
Error Reporting Behavior
OSA Warnings
OSA Errors
Options and Accessories
Cleaning Connections for Accurate Measurements
7Specifications and Regulatory Information
Definition of Terms

1
Setting Up the OSA

Setting Up the OSA
Setting Up the OSA
Setting Up the OSA
This chapter shows you how to set up your optical spectrum analyzer, connect power and accessories, and verify general operation. Although the pictures in this section show an HP 86140A or 86142A optical spectrum analyzer, setting up other HP
???Tips on avoiding costly repairs by proper optical connection cleaning tech- niques.
???List of available options, accessories, and power cords.
???Instructions on returning your instrument to HP for service.
???HP Sales and Service Offices.
Setting Up the OSA
Setting Up the OSA
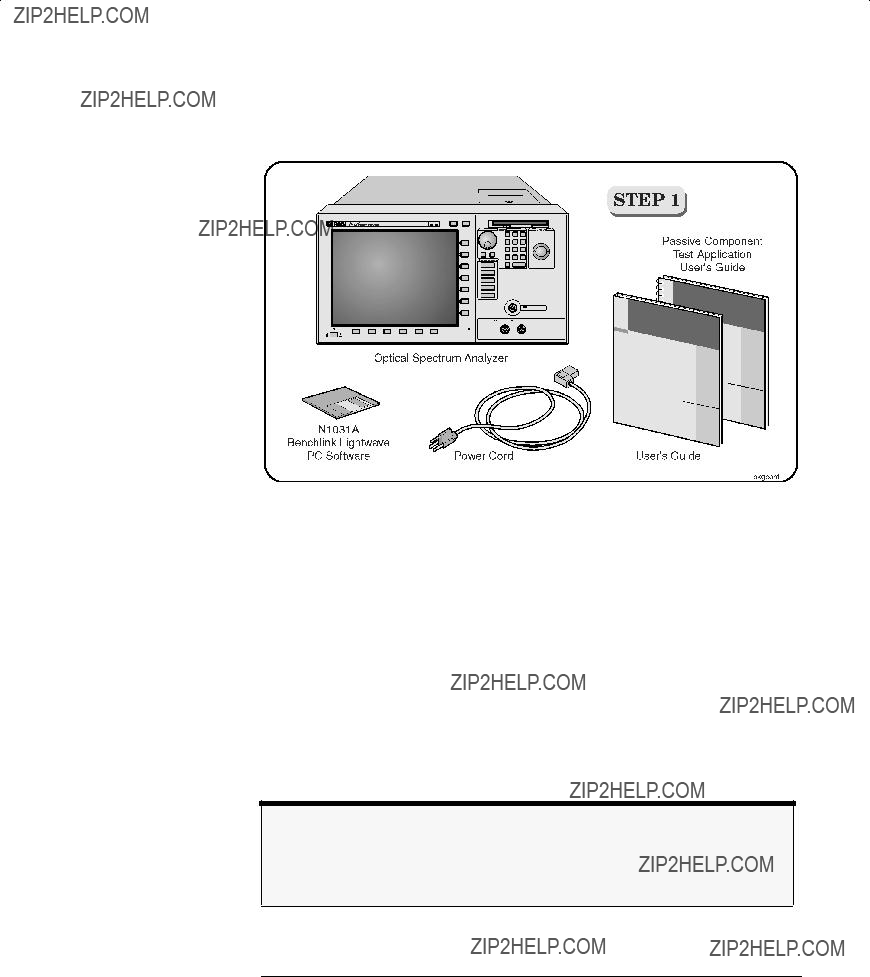
Package contents for HP 86140 series optical spectrum analyzers
???Inspect the shipping container for damage.
???Inspect the instrument.
???Verify that you received the options and accessories you ordered.
Keep the shipping container and cushioning material until you have inspected the contents of the shipment for completeness and have checked the optical spectrum analyzer mechanically and electrically.
If anything is missing or defective, contact your nearest
Note
The N1031A BenchLink software allows you to upload graphics and trace date to a per- sonal computer for preparing a report, creating an analysis, or storing the waveforms for later use.
Setting Up the OSA
Setting Up the OSA
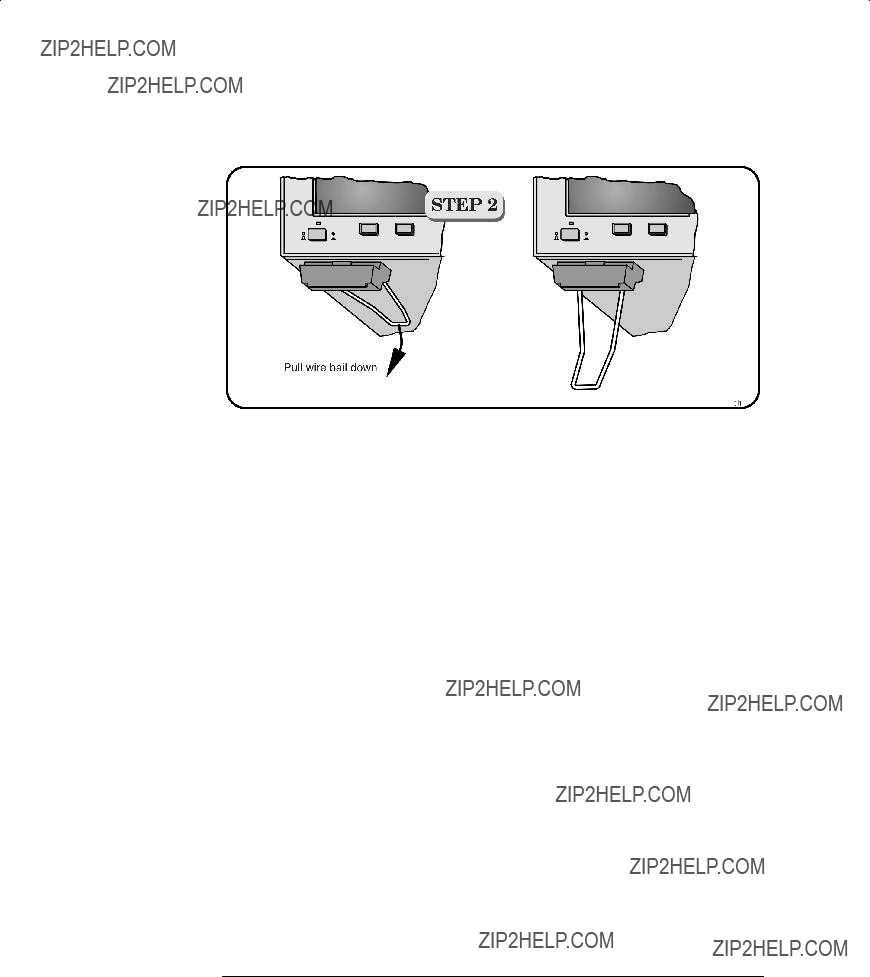
You can tilt your instrument upward for easier viewing. On the HP 86140A and 86142A instruments, lift up the front of the instrument, grasp one of the wire bails under the front corner, and pull it down and forward until it latches into place. Repeat for the other wire bail. On HP 86143A and 86145A instruments, pivot the handle to tilt the instrument.
Setting Up the OSA
Setting Up the OSA

Setting Up the OSA
Setting Up the OSA
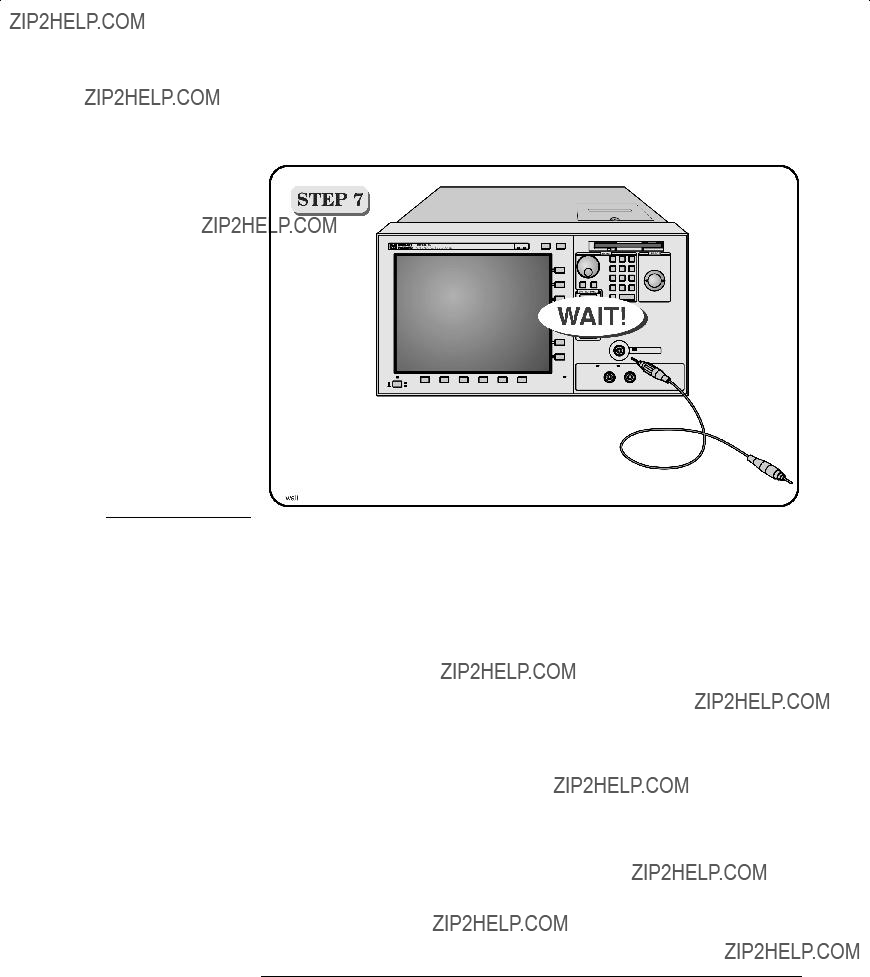
You can connect a

Setting Up the OSA
Setting Up the OSA
The optical spectrum analyzer automatically adjusts for line input voltages in the range of 100 to 240 VAC. There is no manual selection switch. The line cord provided is matched by HP to the country of origin of the order. Refer to ???AC
Line Power Requirements
Setting Up the OSA
Setting Up the OSA
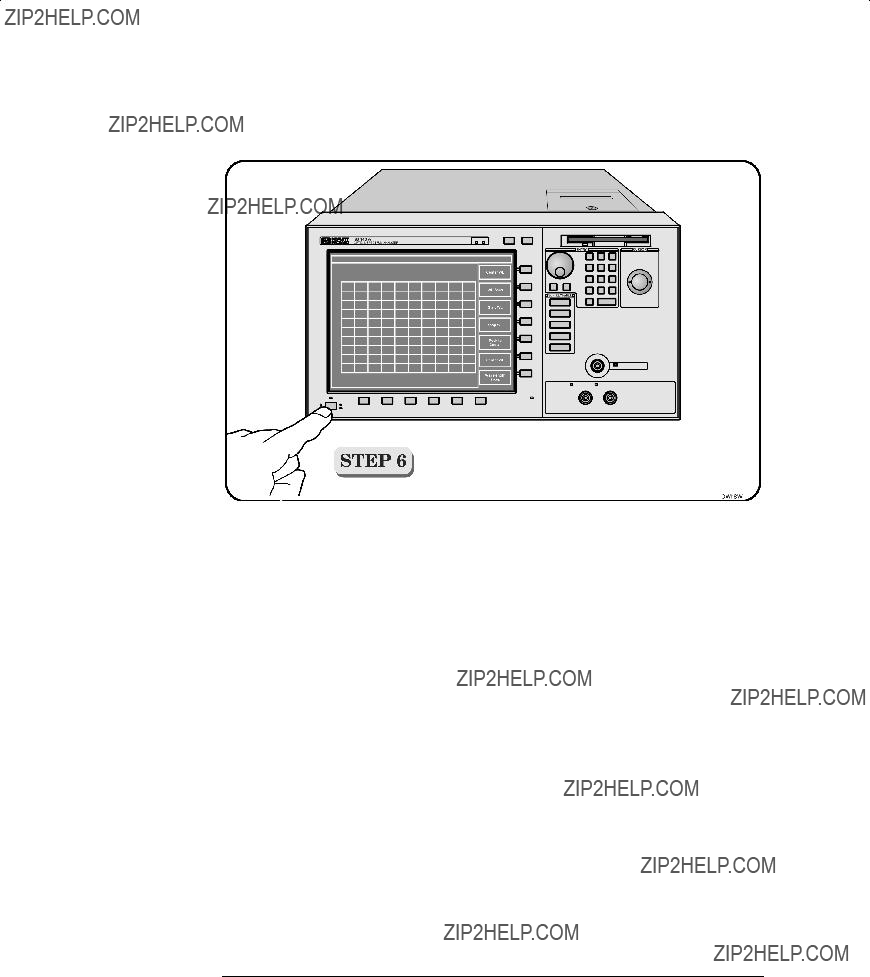
???Press the power switch at the lower
After a short initialization period, the display will look similar to the picture on this page. The instrument is ready to use.
Setting Up the OSA
Setting Up the OSA
Setting Up the OSA
Setting Up the OSA

2
A Quick Tour

A Quick Tour
A Quick Tour
A Quick Tour
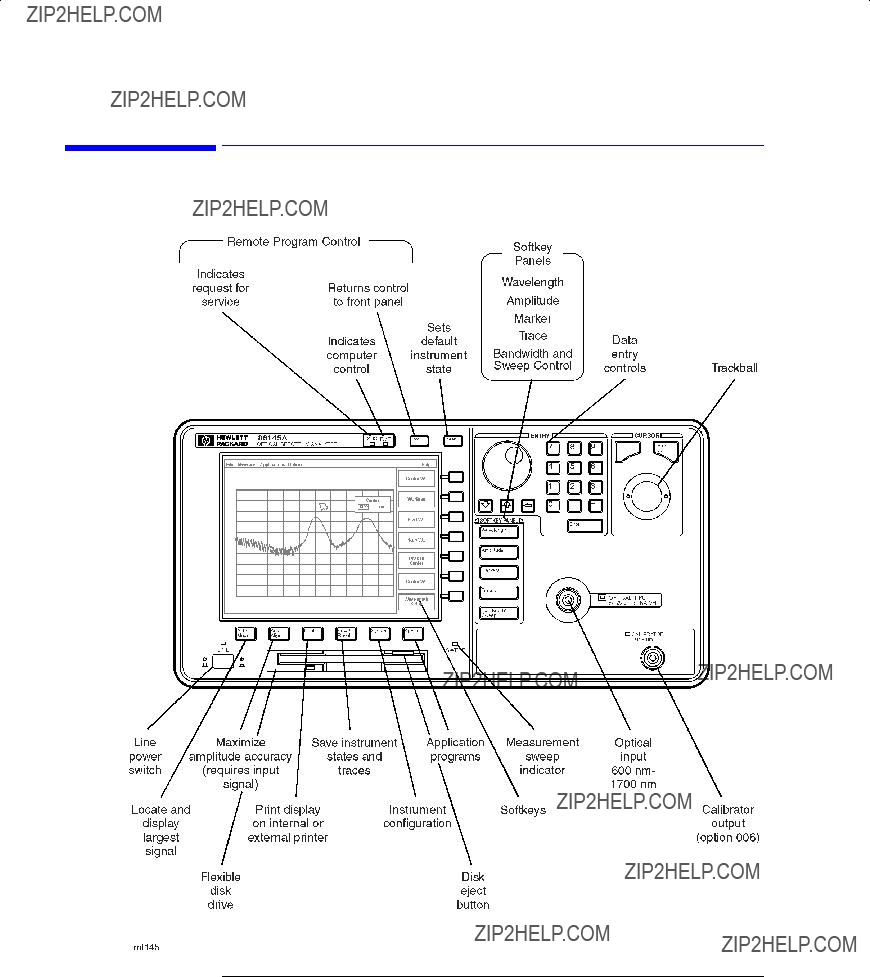
HP
???Softkey panel and softkeys
???Print, Save/Recall, System, and Application keys
???Menu bar
The menu bar or keys can be used to access the same functions. Use the track- ball or an optional pointing device to make menu and softkey selections.

Auto Align
Auto Meas
Appl???s
A Quick Tour
A Quick Tour
All displayed wavelength values show values as measured in a vacuum. This default setting can be changed to show values as measured in air. See ???To change the default wavelength settings??? on page
The OPTICAL INPUT connector on standard instrument versions uses single mode fiber. Connecting
To ensure maximum amplitude accuracy, connect an input signal to the instru- ment and then press Auto Align. This starts an automatic alignment procedure that should be performed whenever the instrument has been:
???moved,
???subjected to large temperature changes, or
???warmed up at the start of each day.
Press the Auto Meas key to automatically locate the largest signal present at the input connector.
Additional software applications can be purchased and installed in your opti- cal spectrum analyzer. These applications automate and simplify your mea- surement tasks. Press this key to access your applications.

A Quick Tour
HP 86140/2 Front and Rear Panels
HP 86140/2 Front and Rear Panels
A Quick Tour
HP 86140/2 Front and Rear Panels
A Quick Tour
HP 86143/5 Front and Rear Panels
HP 86143/5 Front and Rear Panels

A Quick Tour
HP 86143/5 Front and Rear Panels

A Quick Tour
Optical Spectrum Analyzer Display
Optical Spectrum Analyzer Display

A Quick Tour
Optical Spectrum Analyzer Display
A Quick Tour
The Menu Bar
The Menu Bar
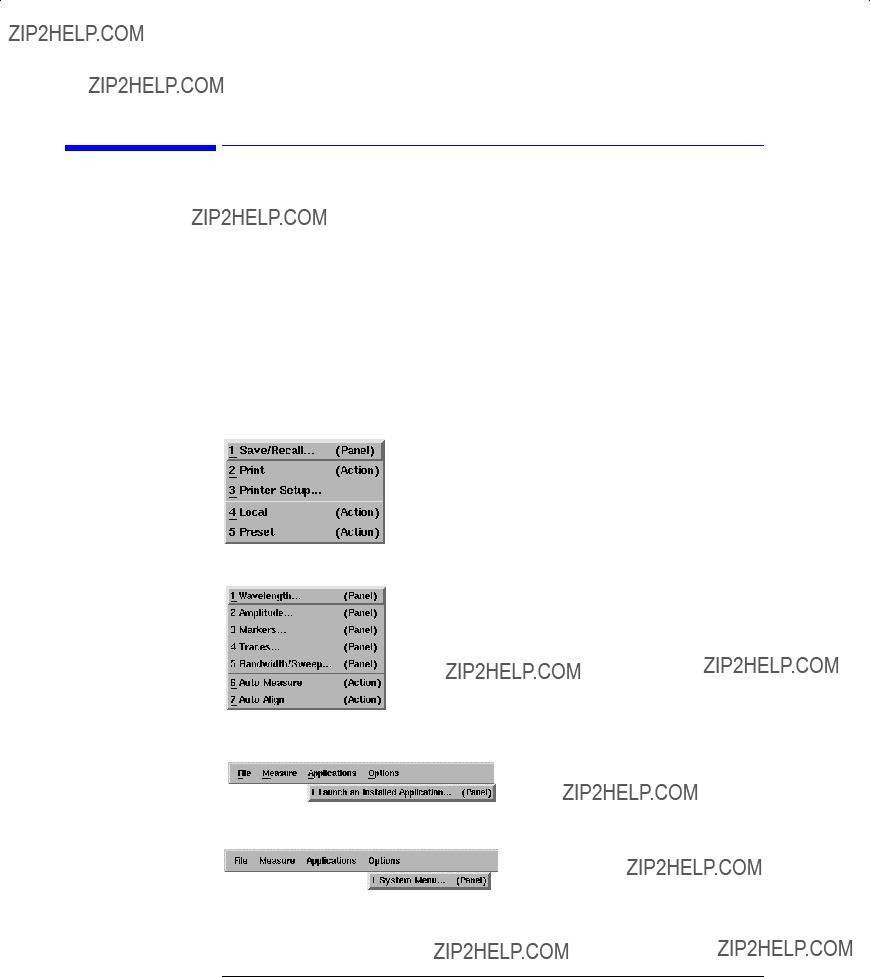
The Menu bar includes the File, Measure, Application, and Options
The File menu
The Measure menu
The Applications menu
The Options menu

A Quick Tour
The Softkey Panels
The Softkey Panels
The softkey panels can be accessed using either the
The Bandwidth/Sweep menus
A Quick Tour
The Softkey Panels
The Amplitude menus
The Amplitude softkeys are accessed by using the
The Measure menu
A Quick Tour
The Softkey Panels
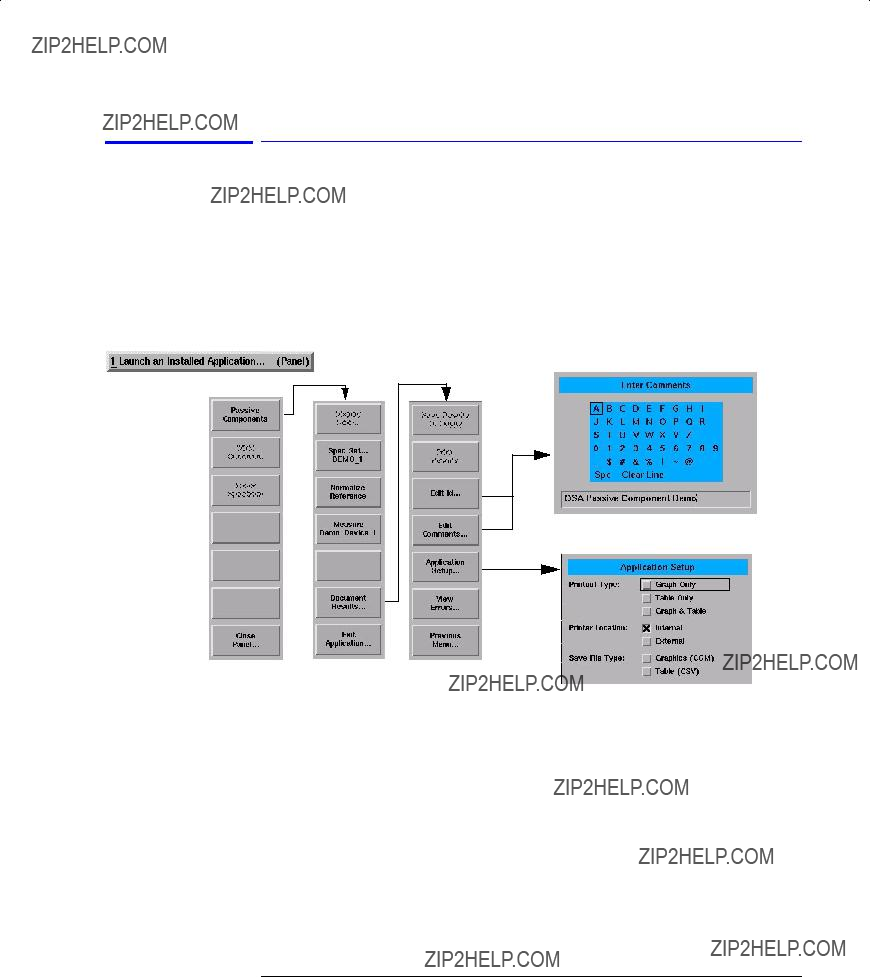
The Applications menus
The Applications (Appl???s) softkeys are accessed by using the
For a complete description of the applications, refer to the manual that came with your software.
The Applications menu

A Quick Tour
The Softkey Panels
The Bandwidth/Sweep menus
The Bandwidth/Sweep softkeys are accessed by using the
The Measure menu
A Quick Tour
The Softkey Panels
The Marker menus
The Markers softkeys are accessed using the
The Measure menu

A Quick Tour
The Softkey Panels
The Save/Recall menus
The Save/Recall softkeys and setup panels are accessed by using the drop- down File menu Save/Recall selection or the
The File menu
A Quick Tour
The Softkey Panels
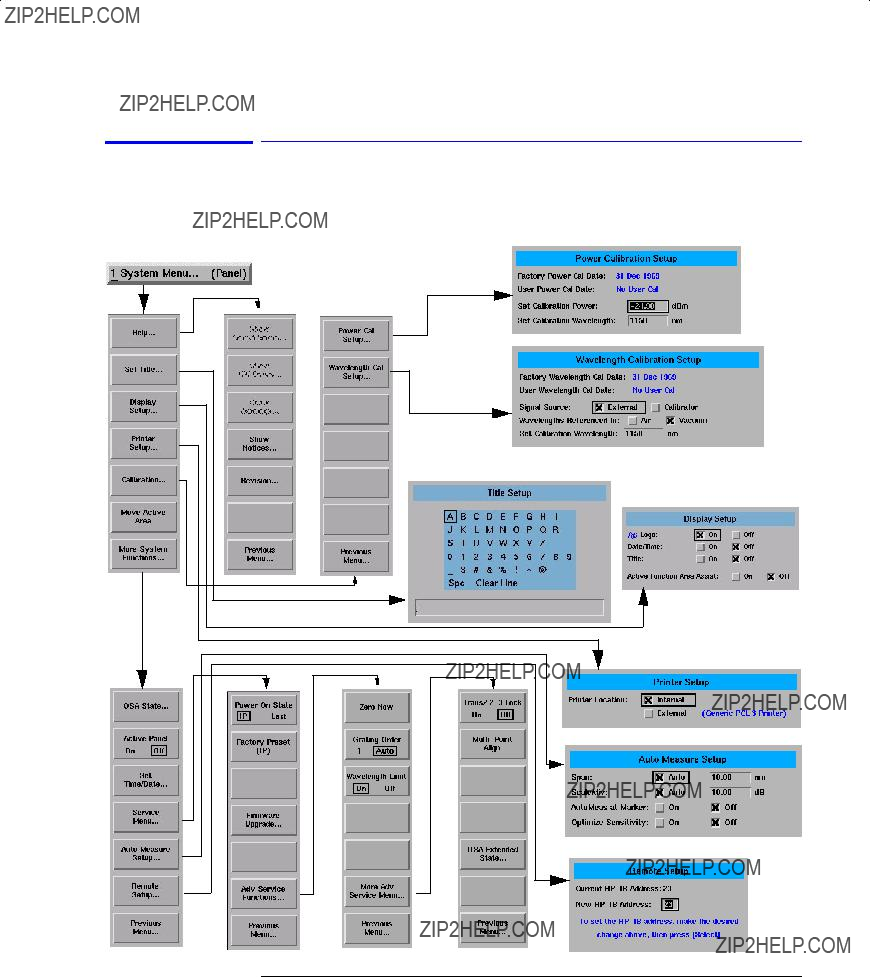
The Systems menus
The System softkeys are accessed using the
Options menu System selection on the menu bar.
The Options menu

A Quick Tour
The Softkey Panels
The Traces menus
The Traces softkeys are accessed by using the
The Measure menu

A Quick Tour
The Softkey Panels
The Wavelength menus
The Wavelength softkeys are accessed using the
The Measure menu

A Quick Tour
Tutorial: Getting Started
Tutorial: Getting Started
This tutorial will introduce you to the HP 86140 series optical spectrum ana- lyzer front panel controls. You will perform an auto alignment, perform a peak search, use a delta marker and print the display.
Instrument setup
A source signal must be present at the input of the optical spectrum analyzer. In this tutorial a
To set the OSA to a known state
1Press the
To perform an Auto Align
For maximum amplitude accuracy, perform an automatic alignment whenever the optical spectrum analyzer has been moved, subjected to large temperature changes, or following

A Quick Tour
Tutorial: Getting Started
2Connect a fiber from the source to the input connector of the optical spectrum analyzer. Be sure to follow the good connector practices described in ???Cleaning Connections for Accurate Measurements??? on page
3Enable the source.
4Press the
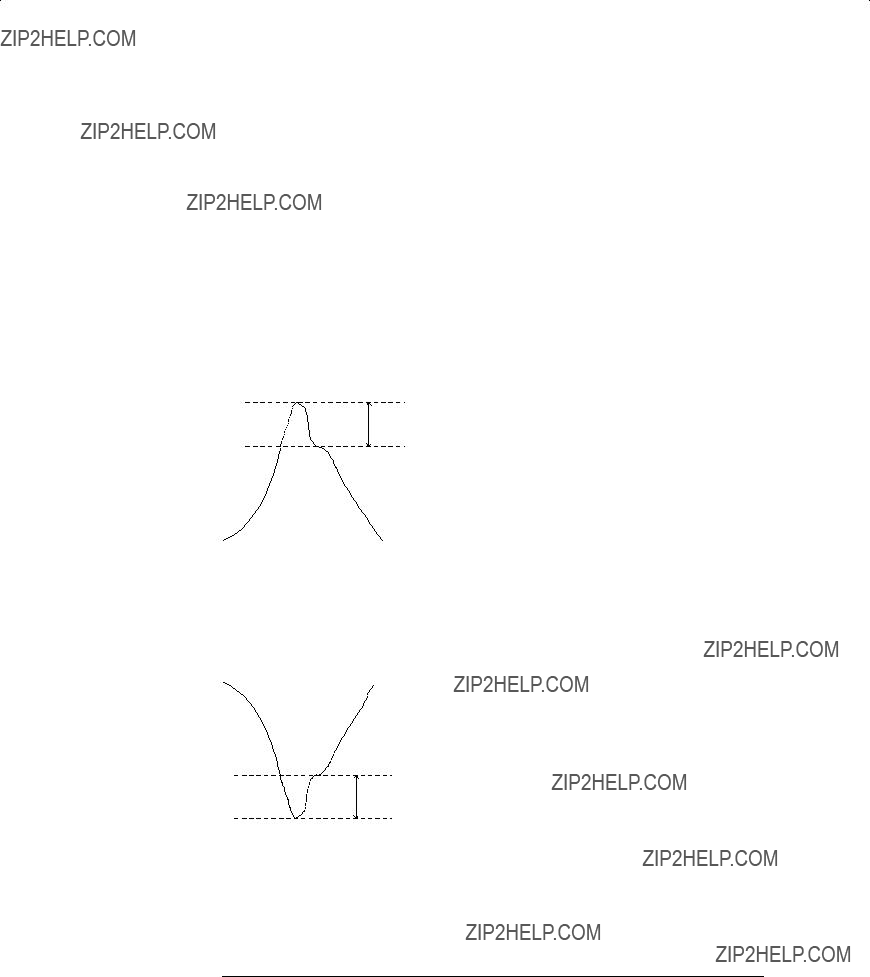
To perform a peak search
5Press the
Trace with normal marker.
To zoom in on the signal
Press the Span softkey and then use the knob, step keys, or numeric keypad to zoom in on the signal.

A Quick Tour
Tutorial: Getting Started
Using the delta marker
The optical spectrum analyzer has four types of markers; normal markers, bandwidth markers, delta markers and noise markers. The marker currently being displayed is a normal marker. In the next step we will use it as a delta marker.
6Press the
7Press the More Marker Functions.... softkey.
8Press the Delta Marker softkey to activate the delta marker and the active function area.
9Use the knob, step keys or numeric entry pad to move the delta marker.
10The reference marker remains stationary.
Trace with delta marker.
Printing the display
11Press the Print key to print a copy of the display. The output will be sent to the internal or external printer, depending on the printer selected. For information on selecting the printer, see ???To set up a printer??? on page

A Quick Tour
Changing the Printer Paper
Changing the Printer Paper

C A U T I O N
C A U T I O N
C A U T I O N
C A U T I O N
A Quick Tour
Changing the Printer Paper
Avoid dropping the coin or screwdriver, used to open the printer door, into the printer assembly.
Always use HP brand paper to ensure quality printing and long printer life. Order paper as HP part number
Never use the printer without printer paper as this can damage the printer head.
???If the instrument is on, the paper feeder automatically scrolls whenever paper is inserted into the feeder.
???Lift the paper latch to correct paper alignment problems. The scroll knob al- lows you to manually advance the paper.
To avoid damage caused by losing parts and tools inside the instrument, always turn the instrument off before installing the printer paper.
3
To perform an Automatic Alignment
To use the navigation softkeys
Using the Optical Spectrum Analyzer

Using the Optical Spectrum Analyzer
Using the OSA
Using the OSA
In this chapter, there are sections on both the menus and the
Any of the instrument settings can be changed by using either the
To perform an Automatic Alignment
For maximum amplitude accuracy, perform an automatic alignment whenever the optical spectrum analyzer has been moved, subjected to large temperature changes, or follow- ing

Using the Optical Spectrum Analyzer
The optical spectrum analyzer has
For maximum amplitude accuracy, perform the automatic alignment when- ever the optical spectrum analyzer has been moved, subjected to large tem- perature changes, or following
Pressing the Auto Align button on the front panel of the OSA performs an auto- matic alignment of the instrument using the largest signal found in a full span sweep. This aligns the output of the monochromator with the photodetector for improved amplitude accuracy. You should use the Auto Align function whenever the OSA is bumped or physically moved to a new location.
The automatic alignment requires the connection of an external light source. This can be a broadband or narrowband source. If there is insufficient signal power, the automatic alignment will not be performed, and an error message will be reported.
The Auto Align function saves and restores the current instrument state. This allows the Auto Align function to be used in the middle of a measurement rou- tine.
If markers are turned on, the Auto Align function attempts to do the automatic alignment at the wavelength of the active marker. If the instrument is in zero span, the alignment is performed at the center wavelength.
To perform an Auto Align function from the remote interface, see the descrip- tions of the following remote commands:
???CALibration:ALIGn??? on page

Using the Optical Spectrum Analyzer
Pressing the Auto Meas button on the front panel of the OSA performs an auto- matic measurement of the largest signal found in a full span sweep and places a marker at the signal peak. Auto measure requires the connection of an external light source. This can be a broadband or narrowband source. If there is insufficient signal power, the automatic measurement will not be performed, and a warning message will be reported. This automatic measurement routine is normally the best way to adjust sensitivity while maintaining the fastest sweep rates.
The Auto Measure function uses trace A to perform the measurement. Since the Auto Measure function can alter the instrument state, we recommend that this operation be performed before a measurement sequence is started.
Using the Auto Measure Setup panel shown below, you can modify the automeasure span and the vertical scale, tune to the wavelength indicated by the marker and optimize the sensitivity. See ???To change the automeasure defaults??? on page
To perform an Auto Measure from the remote interface, see the descriptions of the following remote commands:
???DISPlay[:WINDow[1]]:TRACe:ALL[:SCALe][:AUTO]??? on page
???DISPlay[:WINDow[1]]:TRACe:Y[:SCALe]:AUTO:PDIVision <numeric_value>[DB]??? on page

Using the Optical Spectrum Analyzer
Places the optical spectrum analyzer under local control. Enables the front panel keys after the instrument has been under control with an external com- puter via
Sets the optical spectrum analyzer to a known state.

Using the Optical Spectrum Analyzer
a. Accessible only via the remote interface.
Select this function to print a copy of the display. Using the Printer Setup menu selection, you can specify the printer as the

Using the Optical Spectrum Analyzer
The Menus
The Menus
The
Using the Optical Spectrum Analyzer
The Amplitude Menus
The Amplitude Menus
The Amplitude menus are accessed using the
Note
Normally, the optical spectrum analyzer automatically selects the amplitude units according to whether the scale is logarithmic (dBm) or linear (watts). See ???To change the default amplitude settings??? on page
Linear scale
In linear scale, the graticule is scaled in linear units, proportional to the input power. The bottom of the graticule line represents zero watts. The top of the graticule represents the reference level. Therefore, with 10 graticule lines, each division represents 10% of the input signal at the top of the screen.
Logarithmic scale
Logarithmic scales range from 0.01 to 20.00
Using the Optical Spectrum Analyzer
The Amplitude Menus
Using the Amplitude functions
To change the reference level
1Press the
2Press the Reference Level softkey.
3Use the knob, step keys or numeric entry pad to enter the desired value.
The reference level value is the amplitude level shown at the reference level position. The reference level position is indicated on the display by a green line and the REF annotation on the display. The default position is one major graticule division from the top of the display. For the right vertical scale, the default position is midscreen. The reference level can be specified in dBm or watts.
Note
When using the step keys, the increment and decrement values are determined by the settings of the Scale/Division function. See ???To change the value of the vertical ampli- tude scale??? for more information.
Note
If both the left and right vertical scales are displayed, the reference level of the active trace is adjusted.
To change the value of the vertical amplitude scale
1Press the
2Press the Scale/Div softkey.
3Use the knob, step keys or numeric entry pad to enter the desired value.
Note
This function determines the amount the value increases or decreases when using the arrow keys to set the reference level. See ???To change the reference level??? for more information.
Using the Optical Spectrum Analyzer
The Amplitude Menus
Note
If both the left and right vertical scales are displayed, the scale/division of the active trace is changed.
To change the display mode between log and linear
1Press the
2Press the Display Mode softkey to toggle between Log and Linear data display.
To change the sensitivity
1Press the
2Press the Sensitivity softkey to toggle between Auto and Manual modes.
3Use the knob, step keys or numeric entry pad to enter the desired value.
This key toggles the sensitivity between automatic and manual. The sensitivity setting indicates the smallest signal amplitude that will be displayed across the current wavelength range. Increasing sensitivity slows the sweep speed. An increase in sensitivity may also require a narrower video bandwidth, which will slow the sweep speed.
Normally, the optical spectrum analyzer selects the greatest sensitivity possi- ble that does not require amplification changes during the sweep. If you man- ually increase the sensitivity level, the sweep pauses to allow this change in gain.
Automatic mode
When in automatic mode, the analyzer selects the greatest sensitivity possible that does not require amplification changes during the sweep.
Manual mode
When sensitivity is increased manually, the sweep pauses to allow this change in gain.
Using the Optical Spectrum Analyzer
The Amplitude Menus
Note
The settings for sensitivity, video bandwidth and sweep time interact. If the sensitivity is set to manual, the video bandwidth and sweep time may be forced to Auto mode. If the video bandwidth is set to manual, the sensitivity and sweep time may be forced to Auto. If the sweep speed is set to manual and is set too fast, the OVER SWEEP indicator will come on in the display area. Since these settings interact, it is recommended that only one of the settings be changed, whichever setting is most important to the measurement task being performed.
To set the reference level to the peak value
1Press the
2Press the Peak to REF LEVEL softkey.
The system sets the value of the reference level equal to the value of the high- est point on the active trace.
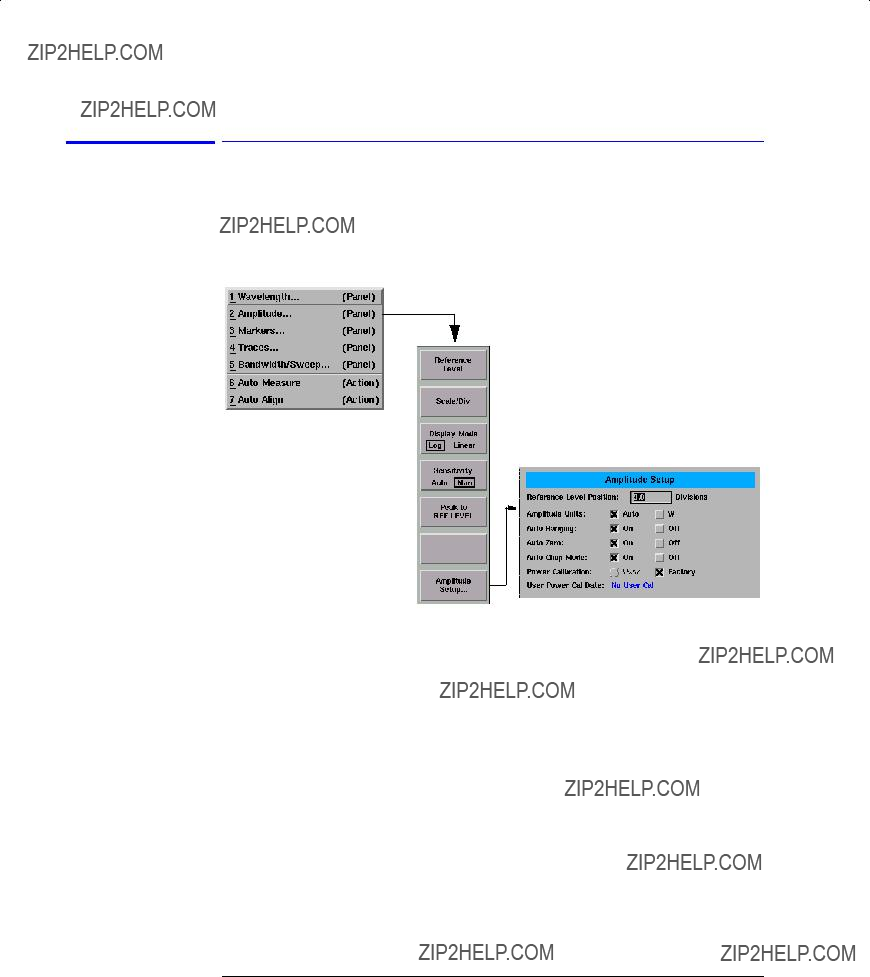
To change the default amplitude settings
1Press the
2Press the Amplitude Setup.... softkey.
3The Amplitude Setup panel opens. Refer to ???To Fill In a Setup Panel??? on page
The Amplitude Setup panel
Setup panel selections
Using the Optical Spectrum Analyzer
The Amplitude Menus
Reference Level Position
The value selected for the Reference Level Position determines the position of the reference level on the graticule. Setting this value to zero divisions places the reference level on the very bottom of the grid. Setting the reference level to 10 divisions places the reference level at the top of the grid. Pressing the
Note
When using the knob or step keys, the value will automatically change. When using the numeric entry pad, a terminator must be selected from the softkey panel.
Amplitude Units
Selecting Auto for amplitude units allows power to be shown in dBm when using the logarithmic scale and in watts when using the linear scale. Selecting W forces the readout to be in watts, regardless of the amplitude scaling.
Auto Ranging
The Auto Range function allows the OSA to change the gain of the transim- pedance amplifier during a sweep. This provides measurements to be made at the widest dynamic range and at the fastest sweep speed.
Pressing the
Note
It is recommended that Auto Ranging always be turned ON.
Auto Zero
Turns Auto Zero ON and OFF. Auto Zero ON enables the internal amplifiers to be zeroed between sweeps. Selecting OFF disables this feature. Pressing the
Note
Turning Auto Zero OFF allows the instrument to sweep faster, but results in less accu- racy on low level signals.

Using the Optical Spectrum Analyzer
The Amplitude Menus
Note
The optical spectrum analyzer performs a more complete zeroing when the instrument is first turned on. You can run this more complete routine anytime by pressing the Zero Now softkey. Refer to ???To zero the instrument??? on page
Auto Chop Mode
Enables the spectrum analyzer chop mode. Chop mode increases dynamic range for long sweep times by subtracting ambient light. Subtracting the ambi- ent light can improve sensitivity but slow down the sweep speed.
Pressing the
Note
Sweep times of 50 msec ?? the # of trace points, or longer, use a special ???chop??? mode. Chop mode increases dynamic range, stabilizes measurements against drift, and reduces effects of stray light. This special chop mode is enabled by setting the Auto Chop mode to ON.
Power Calibration
Power Calibration allows you to use amplitude correction factors either from the factory calibration or from the last successful user calibration. Pressing the
User Power Cal Date
The User Power Cal Date displays the date of the last successful

Using the Optical Spectrum Analyzer
The Bandwidth/Sweep Menus
The Bandwidth/Sweep Menus
The Bandwidth/Sweep softkeys are accessed by using the

Using the Optical Spectrum Analyzer
The Bandwidth/Sweep Menus
Using the Bandwidth/Sweep functions
To change the resolution bandwidth
The ability to display two closely spaced signals as two distinct responses is determined by resolution bandwidth.
1Press the
2Press the Res BW softkey.
3Toggle between selecting the resolution bandwidth automatically or manually.
4Use the knob, step keys or numeric entry pad to enter the desired value.
The resolution bandwidth can be set to one of the following values:
0.07 (0.06 for the HP 86142A and 86145A), 0.1, 0.2, 0.5, 1, 2, 5, or 10 nm. Resolution bandwidth filtering occurs before detection of the light.
In Auto mode, the resolution bandwidth is coupled to the span in a preset 0.01:1 ratio. This means that the optical spectrum analyzer attempts to set a bandwidth value that is 1% of the span setting. You can alter this behavior by manually setting the resolution bandwidth.
To change the video bandwidth
1Press the
2Press the Video BW softkey.
3Toggle between selecting the video bandwidth automatically or manually.
4Use the knob, step keys or numeric entry pad to enter the desired value.
Video bandwidth filtering occurs after detection of the light. In the autocou- pled mode, the video bandwidth has an extremely wide range. This allows the optical spectrum analyzer to avoid unnecessary filtering that would reduce the sweep speed more than required.
Normally, the video bandwidth is coupled to the requested sensitivity. Manu- ally entering a video bandwidth breaks this coupling. The video bandwidth can be manually set from 100 mHz to 3 kHz, or the bandwidth of the currently selected transimpedance amplifier, whichever is less.

Using the Optical Spectrum Analyzer
The Bandwidth/Sweep Menus
The following functions affect video bandwidth:
???Changing the sensitivity value.
???Changing the reference level.
???Turning autoranging ON or OFF.
The range of video bandwidth available in Auto mode is much greater than can be set manually from the front panel. A lower video bandwidth value requires a longer sweep time. Because of the interdependence between the video bandwidth and sensitivity, it is recommended that either the sensitivity or the video bandwidth be changed, whichever is the most important to the measure- ment task being performed.
To change the sweep time
1Press the
2Press the Sweep Time softkey.
3Toggle between selecting sweep time automatically or manually.
4Use the knob, step keys or numeric entry pad to enter the desired value.
The sweep time is the amount of time required for the optical spectrum ana- lyzer to sweep the current measurement range. The optical spectrum analyzer automatically selects sweep times based on coupling of the following instru- ment settings:
???Wavelength span
???Resolution bandwidth
???Video bandwidth
???Sensitivity
???Trace length
???Power level
Coupling of these parameters yields optimum amplitude accuracy. When cou- pled, the optical spectrum analyzer always uses the fastest sweep possible while still maintaining the specified accuracy. Coupled, sweep times range from 50 ms to a maximum value that depends on the number of trace points used to draw the trace. This relationship is shown in the following equation:
50 ms ??? sweep time??? ( 1s) ( trace points)
The default number of trace points is 1001, so the maximum sweep time is normally 100 seconds. When coupling is disabled, the sweep time can be set from 56.3 ms to a maximum of 1000 seconds. If you change the number of trace points, the maximum sweep time changes as well.
Using the Optical Spectrum Analyzer
The Bandwidth/Sweep Menus
Manually setting the sweep time turns coupling off.
Note
If the sweep time is set too fast, an OVER SWEEP message appears indicating the dis- play is no longer calibrated and that trace data may not meet specifications. Increase the sweep time until the OVER SWEEP message disappears. If the sweep time is set too slow, measurement times may be excessively long.
To turn repeat sweep on and off
1Press the
2Press the Repeat Sweep softkey to toggle this function ON or OFF.
To perform a single sweep
1Press the
2Press the Single Sweep softkey. The instrument will perform a single sweep and then stop.
When first turned on, the optical spectrum analyzer uses free run triggering with continuous sweeps. Free run triggering ensures evenly timed sweeps for a stable display of the current tuning range. Sweeps continuously repeat as long as trigger conditions are met. The SWEEP indicator light on the front panel of the optical spectrum analyzer is on when the sweep is in progress. The indi- cator is off between sweeps.
Note
Single sweep mode is especially useful when programming the instrument. Use single sweeps for the following reasons:
???Insure trace reflects current measurement range settings
???Capture traces before processing them with math commands
???Capture traces before positioning markers

Using the Optical Spectrum Analyzer
The Bandwidth/Sweep Menus
To select the internal trigger
1Press the
2Press the More BW/Sweep Functions.... softkey.
3Press the Trigger Mode.... softkey.
4Press the Internal softkey.
Internal triggering synchronizes the start of the sweep to an internally gener- ated trigger signal. Internal triggering ensures continuously triggered sweeps with the shortest delay between sweeps.
To select a gated trigger
1Press the
2Press the More BW/Sweep Functions.... softkey.
3Press the Trigger Mode.... softkey.
4Press the Gated softkey.
In some measurements, the spectrum at a particular time within the modula- tion period is more important than the average spectrum. Gated triggering can be used to synchronize the data acquisition portion of the OSA to a gating trig- ger connected to the
Gated triggering is used to select data samples containing valid information. When the gating signal is high, the data sample is accepted. When the gating signal is low, the data sample is replaced by a data point with a value of

Using the Optical Spectrum Analyzer
The Bandwidth/Sweep Menus
To select an external trigger
1Press the
2Press the More BW/Sweep Functions.... softkey.
3Press the Trigger Mode.... softkey.
4Press the External softkey.
External triggering synchronizes the sweep with a signal connected to the
To select the ADC trigger
1Press the
2Press the More BW/Sweep Functions.... softkey.
3Press the Trigger Mode.... softkey.
4Press either the ADC+,
The softkeys in the menu select the type of triggering for the

Using the Optical Spectrum Analyzer
The Bandwidth/Sweep Menus
To set the trigger delay
1Press the
2Press the More BW/Sweep Functions.... softkey.
3Press the Trigger Delay softkey.
4Use the knob, step keys or numeric entry pad to enter the desired value.
5Use the Trigger Delay softkey to set the delay between the external trigger and the triggering of the
The value you select is displayed in the Active Function Area.
To select the synchronous output
1Press the
2Press the More BW/Sweep Functions.... softkey.
3Press the Sync Out softkey until the desired output is selected.
The synchronous output allows external equipment to receive a sync signal at each sample point of the OSA sweep. When LOW is selected, the signal will be a TTL LOW. When HIGH is selected, the signal will be a TTL HIGH. When PULSE is specified, the signal will go HIGH when the external trigger is recognized and goes low when the
Using the Optical Spectrum Analyzer
The Markers Menus
The Markers Menus
The Markers softkeys are accessed using the

Using the Optical Spectrum Analyzer
The Markers Menus
Using the Optical Spectrum Analyzer
The Markers Menus
Using the Marker functions
To select the active marker
1Press the
2Press the Active Marker.... softkey.
3Select the appropriate marker to activate, deactivate, or turn all markers off.
Selecting a marker always places that marker on the currently selected Active trace at the center wavelength. Turning a marker OFF will turn off any marker function that was on for that particular marker. When the marker is turned ON again, all the marker functions for that marker will be off.
To set the active trace
1Press the
2Press the Active Trace.... softkey.
3Select the trace to activate. or
1Press the
2Press the Active Trace.... softkey.
3Select the trace to activate.
Note
The active trace is designated by a double arrow (>>) on either the right or left side of the display.

Using the Optical Spectrum Analyzer
The Markers Menus
To set markers to measure bandwidth
1Press the
2Select an active marker.
3Place the marker on the peak of the signal to be measured by pressing the PEAK SEARCH softkey.
4Press the Marker BW.... softkey.
5Select a
If a peak search is not performed, then pressing the Marker BW.... softkey finds the bandwidth around the currently active marker. If the bandwidth markers cannot be placed at the selected value, an error message, such as ???BW not found??? will be displayed.
To perform a peak search using a marker
1Press the
2Select an active marker.
3Press the PEAK SEARCH softkey.
The active marker is placed on the highest point of the active trace. If no marker is ON, Marker #1 will be turned ON and placed on the highest point of the active trace.
To change the center wavelength with a marker
1Press the
2Place a marker on the trace to be centered.
3Press the Marker to CENTER softkey.
The center wavelength is set to the wavelength value of the active marker.

Using the Optical Spectrum Analyzer
The Markers Menus
To change the reference level with a marker
1Press the
2Place a marker on the trace at the level you want moved to the reference level position.
3Press the Marker to REF LEVEL softkey.
The reference level is set to the amplitude of the active marker.
To perform a peak search
1Press the
2Select an active marker.
3Press the PEAK SEARCH softkey. or
1Press the
2Select an active marker.
3Press the More Marker Functions.... softkey.
4Press the Marker Search Menu.... softkey.
5Press the Search Mode.... softkey and toggle to select Peak search mode.
6Press the Peak Search softkey. Select from the following options:
Next Peak Down
Places the marker on the next highest peak from the current marker ampli- tude. This next highest peak must meet the peak excursion and threshold cri- teria. If the specified marker is OFF, it will be turned ON, placed at the center wavelength, and the search for the next maximum will begin from that point.
Next Peak Left
Places the marker on the next peak located at a shorter wavelength than the current marker wavelength position. This next peak must meet the peak excursion and threshold criteria. If the specified marker is OFF, it will be turned ON, placed at the center wavelength, and the search to the left will begin from that point.

Using the Optical Spectrum Analyzer
The Markers Menus
Next Peak Right
Places the marker on the next peak located at a longer wavelength than the current marker wavelength position. This next peak must meet the peak excursion and threshold criteria. If the specified marker is OFF, it will be turned ON, placed at the center wavelength, and the search to the right will begin from that point.
Active Marker....
Turns a particular marker ON or OFF. Turning a marker OFF will turn off any marker function that was on for that particular marker. When the marker is turned ON again, all the marker functions for that marker will be off.
Note
For addition information on setting the peak and pit excursion criteria, see ???Peak Excur- sion??? and ???Pit Excursion??? on page
To perform a pit search
1Press the
2Select an active marker.
3Press the More Marker Functions.... softkey.
4Press the Marker Search Menu.... softkey.
5Press the Search Mode.... softkey and toggle to select Pit search mode.
6Press the Pit Search softkey. Select from the following options:
Next Pit Up
Places the marker on the next lowest pit from the current marker amplitude. This next highest pit must meet the peak excursion and threshold criteria. If the specified marker is OFF, it will be turned ON, placed at the center wave- length, and the search for the next minimum will begin from that point.
Next Pit Left
Places the marker on the next pit located at a shorter wavelength than the current marker wavelength position. This next pit must meet the pit excursion and threshold criteria. If the specified marker is OFF, it will be turned ON, placed at the center wavelength, and the search to the left will begin from that point.

Using the Optical Spectrum Analyzer
The Markers Menus
Next Pit Right
Places the marker on the next pit located at a longer wavelength than the cur- rent marker wavelength position. This next pit must meet the pit excursion and threshold criteria. If the specified marker is OFF, it will be turned ON, placed at the center wavelength, and the search to the right will begin from that point.
Active Marker....
Turns a particular marker ON or OFF. Turning a marker OFF will turn off any marker function that was on for that particular marker. When the marker is turned ON again, all the marker functions for that marker will be off.
Note
For addition information on setting the peak and pit excursion criteria, see ???Peak Excur- sion??? and ???Pit Excursion??? on page
To set the noise marker function
1Press the
2Select an active marker.
3Press the More Marker Functions.... softkey.
4Press the Noise Marker softkey.
5Toggle the noise marker ON or OFF.
The noise marker measures the spectral power density at the position of the active marker. The measurement is referenced to a 0.1 nm or 1 nm resolution bandwidth. The reference bandwidth used to normalize the noise is selected on the Marker setup panel. See ???To change the default marker settings??? on page

Using the Optical Spectrum Analyzer
The Markers Menus
To set the delta marker function
1Place the marker to be used as a reference on the desired trace and at the desired wavelength.
2Press the
3Press the More Marker Functions.... softkey.
4Press the Delta Marker softkey.
To fix the position of the reference marker and activate the delta marker, tog- gle the delta marker ON. Use the
To calculate the total power under a trace
1Press the
2Press the More Marker Functions.... softkey.
3Use the Trace Integ softkey to turn trace integration on.
Only one total power calculation can be turned on at a time. For example, if a total power calculation is being performed on trace A, turning a total power calculation for trace B ON will turn the calculation for trace A OFF.
To set the wavelength line markers
1Press the
2Press the More Marker Functions.... softkey.
3Press the Line Marker Menu.... softkey.
4Press the Wavelength Marker 1 or Wavelength Marker 2 softkey.
5Position the line markers using the knob, step keys, or numeric entry pad.
Line markers let you perform sweeps, searches and integrations over a reduced section of the selected wavelength range. Wavelength Marker 1 is always to the left of Wavelength Marker 2.

Using the Optical Spectrum Analyzer
The Markers Menus
To turn off all line makers and line marker functions
1Press the
2Press the More Marker Functions.... softkey.
3Press the Line Marker Menu.... softkey.
4Press the Line Markers Off softkey.
To sweep between line markers
1Press the
2Press the More Marker Functions.... softkey.
3Press the Line Marker Menu.... softkey.
4Select and set Wavelength Marker 1 and 2 to the desired wavelength sweep limits.
5Press the Advanced Line Mkr Functions.... softkey.
6Press the Sweep Limit softkey to toggle this function ON or OFF.
When the sweep limit is ON, the instrument will only sweep between Wave- length Marker 1 and Wavelength Marker 2.
To search between line markers
1Press the
2Press the More Marker Functions.... softkey.
3Press the Line Marker Menu.... softkey.
4Select and set Wavelength Marker 1 and 2 to the desired wavelength search limits.
5Press the Advanced Line Mkr Functions.... softkey.
6Press the Search Limit softkey to toggle this function ON or OFF.
When the search limit is ON, all the marker peak/pit searches will be between Wavelength Marker 1 and Wavelength Marker 2.

Using the Optical Spectrum Analyzer
The Markers Menus
To integrate between line markers
1Press the
2Press the More Marker Functions.... softkey.
3Press the Line Marker Menu.... softkey.
4Select and set Wavelength Marker 1 and 2 to the desired integration limits.
5Press the Advanced Line Mkr Functions.... softkey.
6Press the Integrate Limit softkey to toggle this function ON or OFF.
Turning the integration limit ON will calculate the power between Wavelength Marker 1 and Wavelength Marker 2 when the Trace Integration function in ON. See ???To calculate the total power under a trace??? on page
Note
Although there is a single range controlling the total power integration, the marker search range, and the wavelength sweep range, there are three independent state set- tings for limiting the total power integration, the marker search, and the wavelength sweep to the range.
To change the default marker settings
1Press the
2Press the More Marker Functions.... softkey.
3Press the Marker Setup.... softkey.
4The Marker Setup panel opens. Refer to ???To Fill In a Setup Panel??? on page
Using the Optical Spectrum Analyzer
The Markers Menus
Setup panel selections
The Marker Setup panel
Normal Marker Units
Sets the
Bandwidth Marker Units
Sets the bandwidth marker
Delta Marker Units
Sets the delta marker
Normal/Delta Marker Interpolation
Turns the normal/delta marker interpolation ON or OFF. When interpolation is ON, the normal/delta markers will be placed at the exact wavelength or fre- quency value selected if it is within the trace range. The marker will linearly interpolate between two trace data points. The default state is OFF.
This setting controls the interpolation state for all four markers when in the normal or delta mode.
Using the Optical Spectrum Analyzer
The Markers Menus
Bandwidth Marker Interpolation
Turns the bandwidth marker interpolation ON or OFF. When interpolation is ON, the bandwidth markers will be placed at the exact number of dB (NDB) from the normal marker if within the trace range. The position of the marker will be linearly interpolated between two trace data points. The default state is ON. If interpolate is OFF, for negative NDB values, the bandwidth markers will be at values closest to and more negative than the NDB value. For positive NDB values, the bandwidth markers will be at values closest to and more posi- tive than the NDB values. This will typically result in a wider bandwidth mea- surement.
Peak Excursion
Sets the peak excursion value for the marker search routines.
Peak excursion criteria
The peak excursion value is used to determine whether or not a local maxi- mum in the trace is to be considered a peak. To qualify as a peak, both sides of the local maximum must fall by at least the peak excursion value.
Pit Excursion
Sets the pit excursion value for the marker search routines.
Pit excursion criteria
The pit excursion value is used to determine whether or not a local minimum in the trace is to be considered a pit. To qualify as a pit, both sides of the local minimum must rise by at least the pit excursion value.

Using the Optical Spectrum Analyzer
The Markers Menus
Use Marker Search Threshold
This limits the marker search function to data points above the selected threshold level.
Marker Search Threshold Value
Selects the amplitude threshold value used for limiting the marker search function. When Marker Search Threshold is ON, a dotted line is shown on the display at the threshold level.
Noise Marker Reference Bandwidth
Sets the normalization bandwidth for the noise marker. There are two allow- able settings: 1 nm and 0.1 nm.
Note
Changing this value will change the value of the noise marker by 10 dB.
Peak Search at End of Each Sweep
Finds the peak value of the trace and moves the marker to the peak at the end of each sweep. This function operates on the active marker. This function operates on normal, delta, bandwidth and noise markers.

Using the Optical Spectrum Analyzer
The Save/Recall Menus
The Save/Recall Menus
The Save/Recall softkeys are accessed by using the

Using the Optical Spectrum Analyzer
The Save/Recall Menus
Using the Save/Recall functions
To save measurement and trace data
1Press the
2Press the Save Menu.... softkey.
3The Save Setup panel opens. Refer to ???To Fill In a Setup Panel??? on page
Setup panel selections
The Save Setup panel
Save
Saves the measurement data in a binary format (.dat file). This includes the traces and all measurement conditions. When the file is recalled, the instru- ment state will be set to the same state as when the file was saved. The Trace(s) Only option creates an ASCII (.csv) file. When the file is recalled, the trace data will be displayed under the current instrument settings. Refer to
???To display the OSA State information panel??? on page
Save Traces
Selects the traces to be saved.
Save Graphics
Saves graphic data when selected. The graphic data is stored in Computer Graphics Metafile (CGM) format. This is a vector graphics format that describes pictures and graphical elements in geometric terms. This selection is valid only when saving to the floppy drive.
Using the Optical Spectrum Analyzer
The Save/Recall Menus
Save to
Selects saving data to a floppy disk or to internal memory.
File Name
Selects manual or automatic mode for choosing a file name.
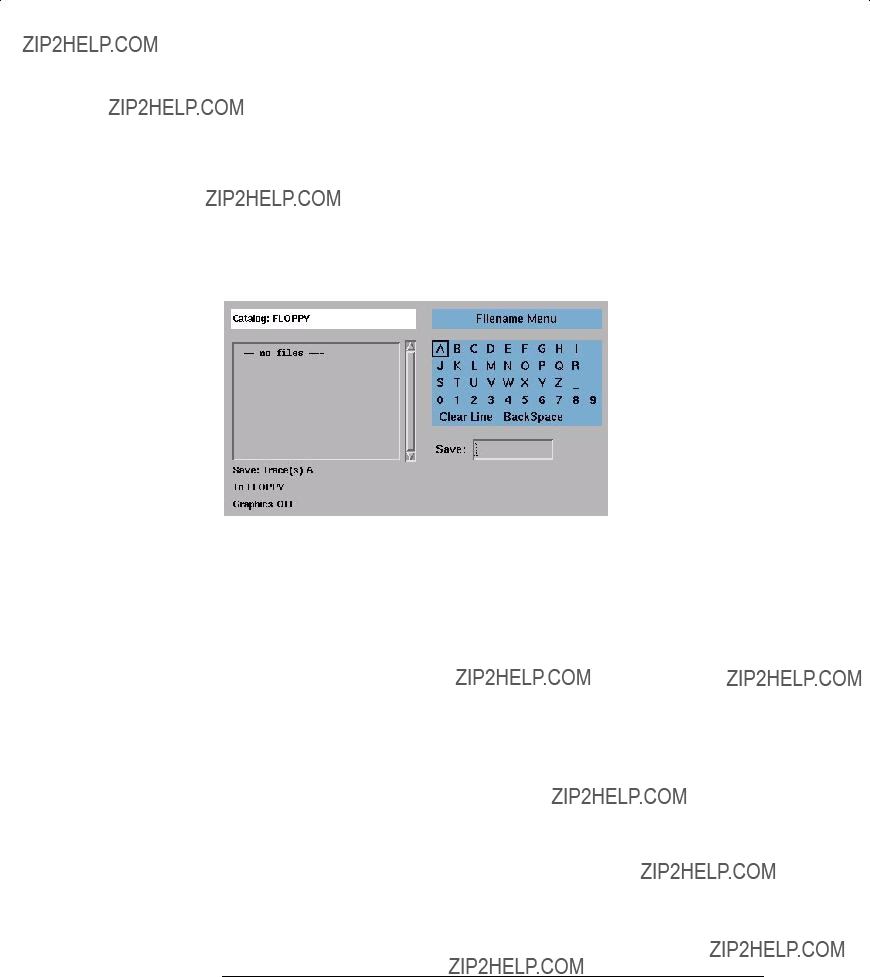
4When you are satisfied with your selections, press the Choose File to Save softkey. The Filename Menu setup panel opens.
The Filename Menu setup panel
To enter a filename using the arrow keys
1 Use the
2When the desired letter or function is selected, press the Select softkey.
3Select the BackSpace function to delete individual letters.
4Select the Clear Line function to delete the entire filename.
5When you finish entering the filename, press the SAVE FILE softkey.
To enter a filename using a trackball or mouse
1Use the pointing device to place the cursor on a letter of the filename. Click on the character to select it.
2Click the BackSpace function to delete individual letters.
3Click the Clear Line function to delete the entire filename.
4When you finish entering the filename, click the SAVE FILE softkey.
Using the Optical Spectrum Analyzer
The Save/Recall Menus
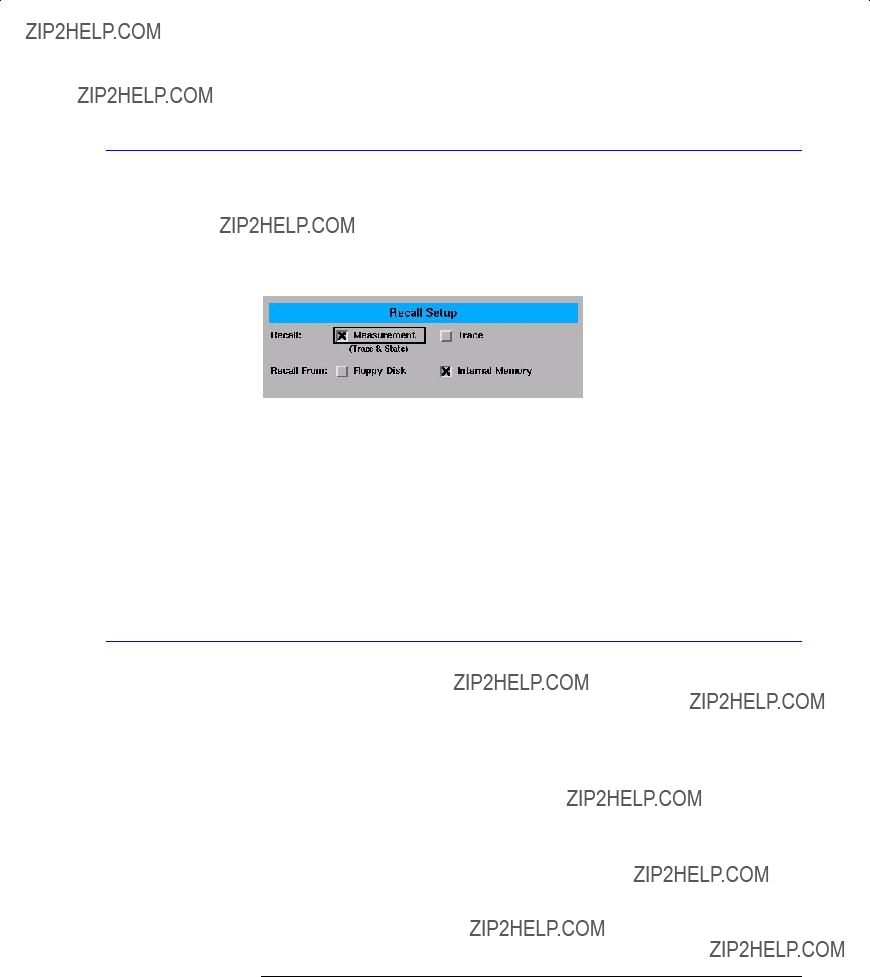
To recall measurement and trace data
1Press the
2Press the Recall Menu.... softkey.
3The Recall Setup panel opens.
4When you are satisfied with your selections, press the Choose File to Recall softkey. The Catalog panel opens. See ???To select a file from the catalog??? on page
To select a file from the catalog
1Press the
2Press the Recall Menu.... or Delete Menu.... softkey.
3Press the Choose File to Recall or Choose File to Delete softkey.
4Make the desired selections on the setup panel. Refer to ???To Fill In a Setup Panel??? on page
5When you are satisfied with your selections, press Enter. The Catalog panel opens.
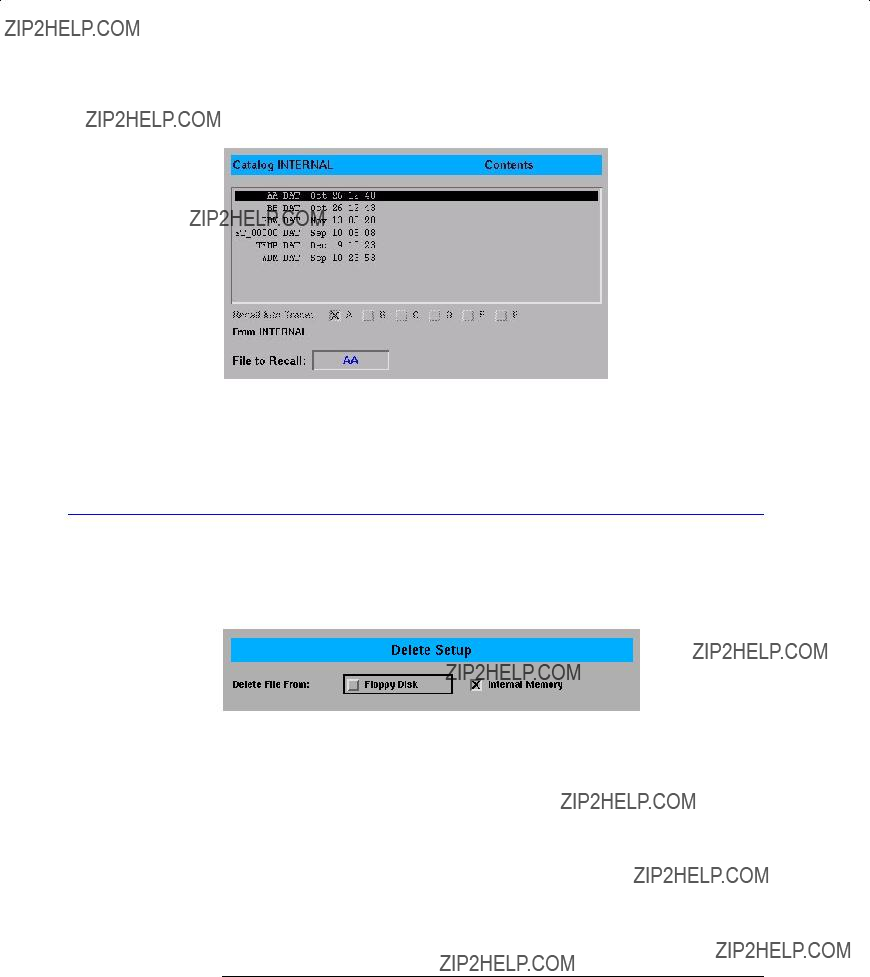
Using the Optical Spectrum Analyzer
The Save/Recall Menus
The Catalog setup panel
6Use the arrow keys to highlight the next five previous file softkeys, or click on the desired filename using a trackball or mouse. Press Enter to recall or delete the selected file.
To delete a file from internal memory or a floppy disk
1Press the
2Press the Delete Menu.... softkey.
Setup panel selections
The Delete Setup panel
Delete File From:
Selects whether to delete from a floppy disk or from internal memory.
Press the Choose File to Delete softkey to open the Catalog window. See ???To select a file from the catalog??? on page

Using the Optical Spectrum Analyzer
The Save/Recall Menus
To format a floppy disk
1Press the
2Press the Format Floppy Disk.... softkey.
3Press the Format softkey to format the 3.5 floppy disk. Press the Cancel softkey to stop the format action and return to the previous screen.
To backup or restore the internal memory
1Press the
2Press the Backup/Restore Menu.... softkey.
Softkey panel selections
Backup Internal Memory
An OSA Backup Utility screen appears asking you to insert a formatted floppy disk in the external drive.
Restore Internal Memory
An OSA Restore Utility screen appears. This operation will remove all files from internal memory and replace them with files from backup floppy disks.
To save in Fast Save mode
1Press the
2Press the Fast SAVE softkey.
3The instrument saves the measurement to internal memory.
To recall in Fast Recall mode
1Press the
2Press the Fast RECALL softkey.
3The instrument recalls the measurement saved previously by the Fast Save function.

Using the Optical Spectrum Analyzer
The System Menus
The System Menus
The System softkeys are accessed using the
Using the Optical Spectrum Analyzer
The System Menus
Using the System functions
To display notices, bandwidth errors, critical errors and warnings
Note
The Show Notices...., Show BW Errors...., Show Critical Errors...., and Show Warnings....
functions are only available if a notice, bandwidth error, critical error, or warning has been generated by the system. If no notices, bandwidth errors, critical errors, or warn- ings have been generated, these functions will be grayed out.
1Press the
2Press the Help.... softkey.
3Press the Show Notices...., Show BW Errors...., Show Critical Errors.... or Show Warnings....softkey. A window opens displaying the notice, bandwidth error, critical error or warning. You can print the queue, clear the queue, or page up and down to view the information.
To display the firmware revision
1Press the
2Press the Help.... softkey.
3Press the Revision.... softkey. A display appears showing the firmware revision information.
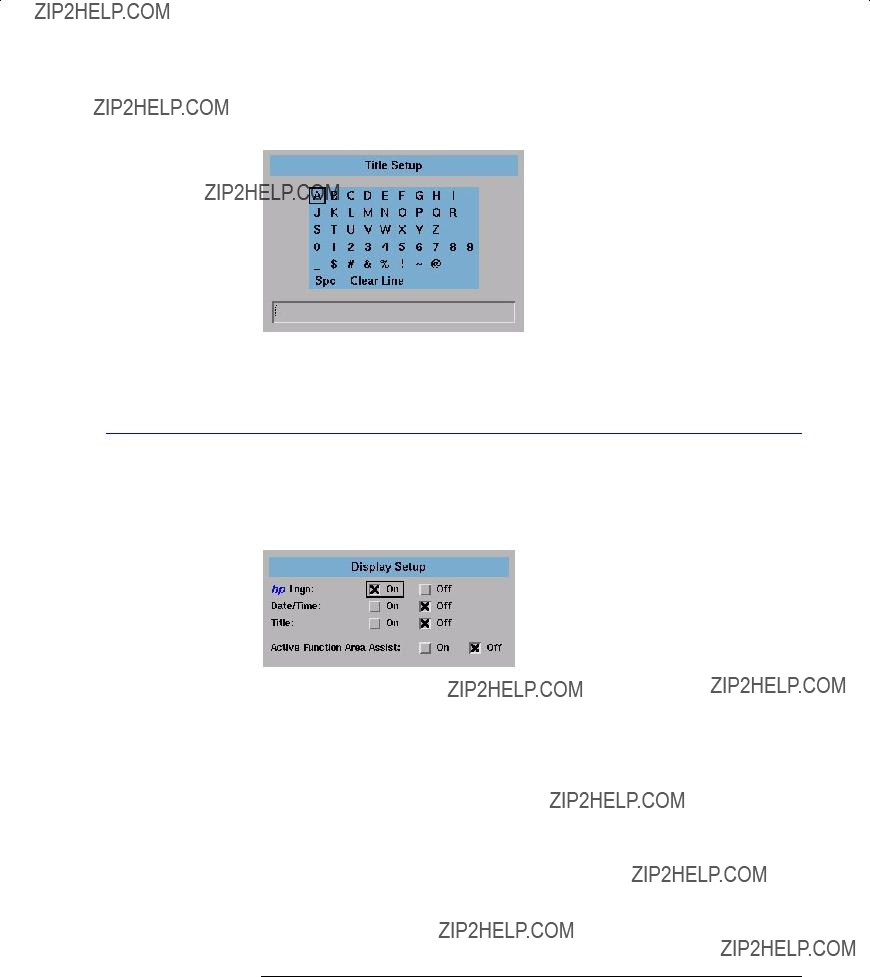
To add a title to the display
1Press the
2Press the Set Title.... softkey. The Title Setup panel appears.
Using the Optical Spectrum Analyzer
The System Menus
The Title Setup panel
Refer to ???To Fill In a Setup Panel??? on page
To change the display setup
1Press the
2Press the Display Setup.... softkey. The Display Setup panel appears.

Using the Optical Spectrum Analyzer
The System Menus
Active Function Area Assist
When this function is ON, the function set in the Active Function Area is auto- matically set to the first, or top, softkey function. For example, when you press the
To set up a printer
1Press the
2Press the Printer Setup.... softkey. The Printer Setup panel appears.
Setup panel selections
The Printer Setup panel
Printer Location
Selects either the internal printer or an external printer as the print destina- tion.
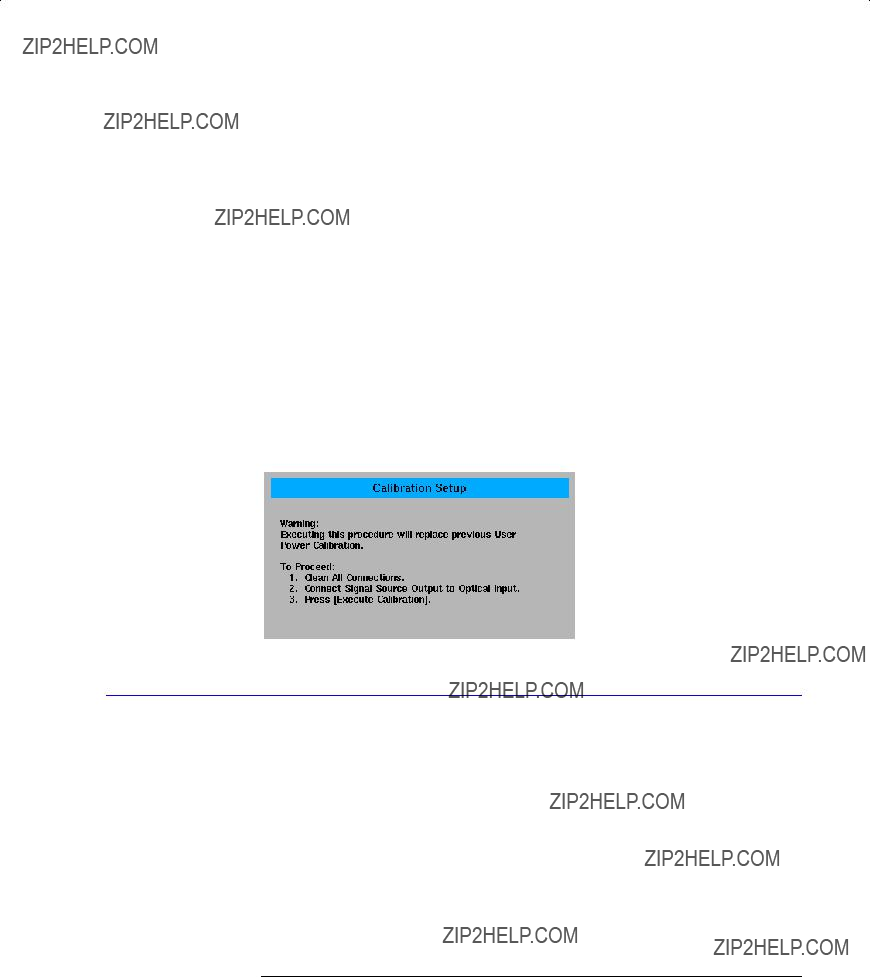
To perform a power calibration
1Press the
2Press the Calibration.... softkey.
3Press the Power Cal Setup.... softkey. The Power Calibration Setup panel appears.
The Power Calibration setup panel
Setup panel selections
Using the Optical Spectrum Analyzer
The System Menus
Factory Power Cal Date
Shows the date of the last
User Power Cal Date
Shows the date of the last successful
Set Calibration Power
This is the exact amplitude of the calibration source that will be used for the next power calibration. The power entered must be within +10 dB and
Set Calibration Wavelength
This is the approximate wavelength of the calibration source that will be used for the next user power calibration. The wavelength entered must be within 2.5 nm of the wavelength measured using the factory calibration.
4Enter the power and wavelength of the calibration signal.
5Press the Perform Calibration.... softkey.
6 Follow the
To perform a wavelength calibration
1Press the
2Press the Calibration.... softkey.
3Press the Wavelength Cal Setup.... softkey. The Wavelength Calibration Setup panel appears.

Using the Optical Spectrum Analyzer
The System Menus
Setup panel selections
The Wavelength Calibration setup panel
Factory Wavelength Cal Date
Shows the date of the last
User Wavelength Cal Date
Shows the date of the last successful
Signal Source
Select either an external single wavelength signal source or the internal cali- brator as the wavelength calibration source.
Wavelength Referenced In (for external calibration source only)
Selects air or vacuum for the calibration. If the internal calibrator is selected, this selection will not be available.
Set Calibration Wavelength (for external calibration source only)
This is the exact wavelength of the calibration source that will be used for the next user wavelength calibration. The wavelength entered must be within 2.5 nm of the wavelength measured using the factory calibration. If the inter- nal calibrator is selected, this selection will not be available.
4If you are using an external calibration source, enter the signal source and wavelength of the calibration signal and whether the calibration is referenced in air or vacuum. If you are using an internal calibration source, continue with Step 5.

Using the Optical Spectrum Analyzer
The System Menus
5 Press the Perform Calibration.... softkey.
6 Follow the
To move the active function area
1Press the
2Press the Move Active Area softkey. Each press of the softkey moves the active function area to one of eight
To display the OSA State information panel
1Press the
2Press the More System Functions.... softkey.
3Press the OSA State.... softkey.
4The OSA State Information display panel opens and can be printed.
The OSA State information panel

Using the Optical Spectrum Analyzer
The System Menus
To display the Active Function Area
1Press the
2Press the More System Functions.... softkey.
3Press the Active Panel softkey to toggle the display of the Active Function Area
ON or OFF.
To change the time and date
N O T E
1
2
3
Changing the time, date, or time zone causes the instrument to reboot.
Press the
Press the More System Functions.... softkey.
Press the Set Time/Date.... softkey. The Time/Date Setup panel appears.
4Use the navigation keys to set the date, time and time zone that are correct for your location.
5Press the Set Time/Date softkey when you are satisfied with your selections.
To select the
1Press the
2Press the More System Functions.... softkey.
3Press the Service Menu.... softkey.
4Press the Power On State softkey. Toggle to select IP or Last.

Using the Optical Spectrum Analyzer
The System Menus
The IP function is the same as the
To perform a factory preset (IP)
1Press the
2Press the More System Functions.... softkey.
3Press the Service Menu.... softkey.
4Press the Factory Preset (IP) softkey.
The factory preset function restarts the instrument and sets it to the same states as the

Using the Optical Spectrum Analyzer
The System Menus
To upgrade the firmware
To upgrade the firmware you must have the firmware upgrade disk set from HP.
1Press the
2Press the More System Functions.... softkey.
3Press the Service Menu.... softkey.
4Press the Firmware Upgrade.... softkey.
5You are prompted for each disk in the firmware upgrade set. When the last disk has been copied, the instrument will finish the installation process and restart.
To zero the instrument
1Press the
2Press the More System Functions.... softkey.
3Press the Service Menu.... softkey.
4Press the Adv Service Functions.... softkey.
5Press the Zero Now softkey.
The Zero Now function causes the auto zero function to run immediately. This allows you to manually zero the instrument when the Auto Zero function is off. The dark current of the photodetector is measured one time, and then the resulting correction is applied to all subsequent measurements, for improved amplitude accuracy.
Using the Optical Spectrum Analyzer
The System Menus
Note
The optical spectrum analyzer compensates for
The optical spectrum analyzer performs a more complete zeroing when the instrument is first turned on. You can run this more complete routine anytime by pressing the ZERO NOW softkey.
To set the grating order mode
1Press the
2Press the More System Functions.... softkey.
3Press the Service Menu.... softkey.
4Press the Adv Service Functions.... softkey.
5Press the Grating Order softkey.
6Toggle between 1 and AUTO.
The Grating Order function lets you choose between 1st order grating only and the Automatic setting. The Automatic mode selects 2nd order mode if the stop wavelength is less than 900 nm. The 2nd order grating mode provides a slightly higher measurement sensitivity. Note that the 10 nm resolution bandwidth is not available when using the 2nd order grating mode. The grating order is listed in the OSA State Information. See ???To display the OSA State information panel??? on page
To set the wavelength limit
1Press the
2Press the More System Functions.... softkey.
3Press the Service Menu.... softkey.
4Press the Adv Service Functions.... softkey.
Using the Optical Spectrum Analyzer
The System Menus
5Press the Wavelength Limit softkey. Toggle ON to limit the span to the specified range of 600 to 1700 nm. When this function is OFF, the start wavelength of the OSA can be tuned down to 350 nm, and the stop wavelength can be tuned up to 2000 nm.
Note
The performance of the OSA is not specified and the amplitude is not calibrated outside the
To set the TransZ 2 - 3 Lock
1Press the
2Press the More System Functions.... softkey.
3Press the Service Menu.... softkey.
4Press the Adv Service Functions.... softkey.
5Press the More Adv Service Menu.... softkey.
6Press the TransZ 2 - 3 Lock softkey.
Setting the TransZ
To set
1Press the
2Press the More System Functions.... softkey.
3Press the Service Menu.... softkey.
4Press the Adv Service Functions.... softkey.
5Press the More Adv Service Menu.... softkey.
6Press the
Using the Optical Spectrum Analyzer
The System Menus
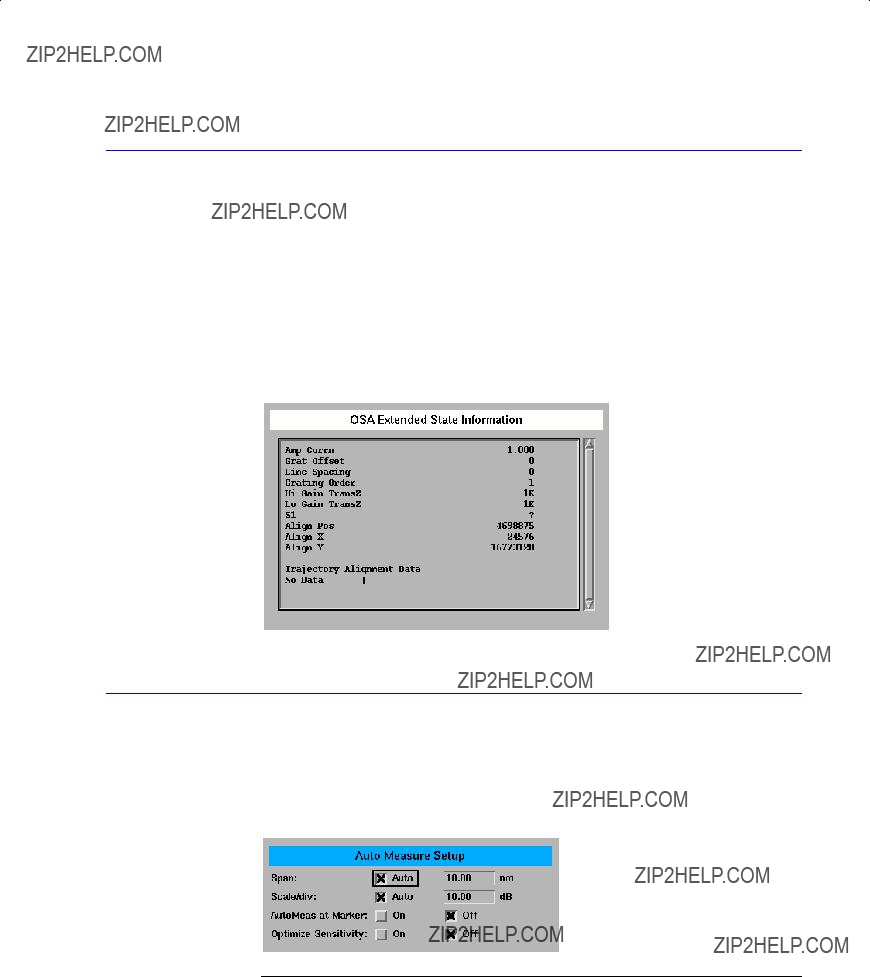
To display the OSA Extended State information panel
1Press the
2Press the More System Functions.... softkey.
3Press the Service Menu.... softkey.
4Press the Adv Service Functions.... softkey.
5Press the More Adv Service Menu.... softkey.
6Press the OSA Extended State.... softkey. The OSA Extended State Information panel is displayed and can be printed.
The OSA Extended State function provides information useful to HP service personnel.
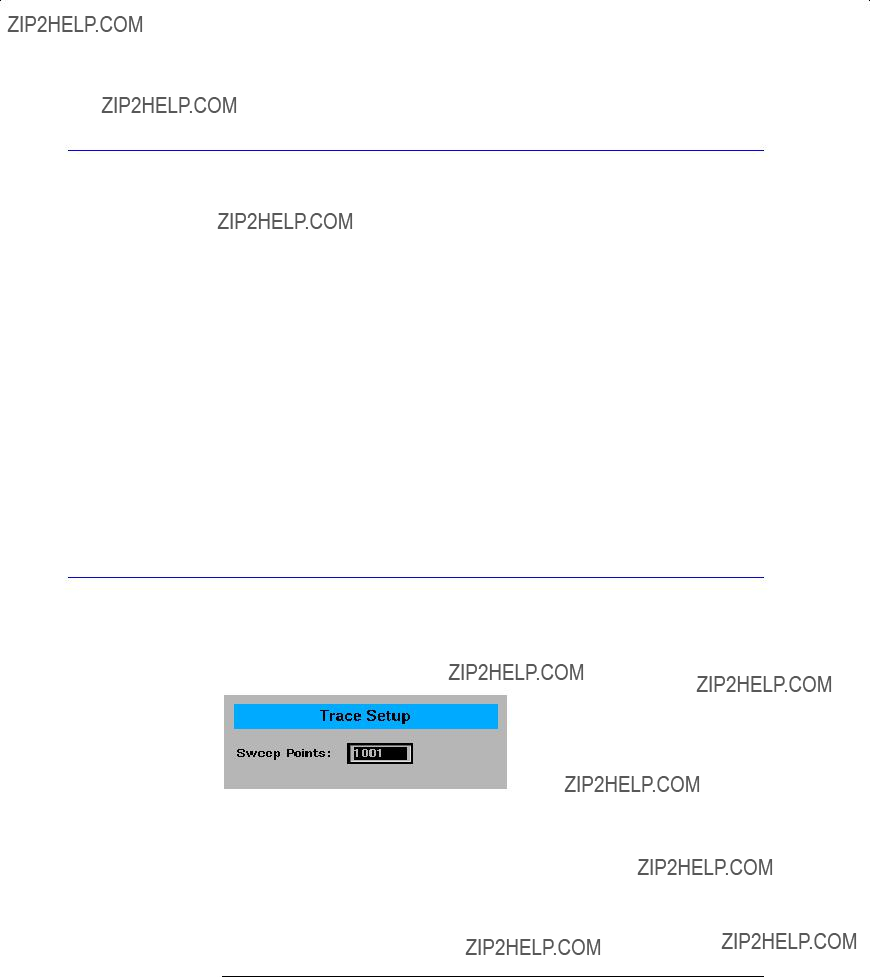
To change the automeasure defaults
1Press the
2Press the More System Functions.... softkey.
3Press the Auto Measure Setup.... softkey. The Automeasure Setup panel appears.

Setup panel selections
Using the Optical Spectrum Analyzer
The System Menus
4Use the arrow keys or the numeric entry pad to set the wavelength span manually or automatically. Refer to ???To Fill In a Setup Panel??? on page
Span
This function selects the wavelength span for viewing the signal located by the auto measure function. If Auto is specified, the span is set wide enough to dis- play most of the signal. If a particular span is desired, deselect Auto and put the desired span in the nm dialog box. The default selection for Span is Auto.
Note
If the span is set too narrow, the auto measure operation may not complete successfully. If this happens a warning message is displayed.
Scale/Div
The dB/div selection sets the vertical scale to be used after performing the auto measure function. If Auto is specified, the measurement function sets the vertical scale to a value based on the dynamic range of the signal. If a particu- lar vertical scale is desired, deselect Auto and put the desired dB/div in the dB dialog box. The default selection for dB/div is Auto.
AutoMeas at Marker
Selecting the ON state for AutoMeas at Marker causes the auto measure func- tion to perform its operation at the wavelength of the active marker. This allows you to measure a signal other than the largest one found in a full span sweep. The default selection for Automeasure at Marker is OFF.
Optimize Sensitivity
Selecting the ON state for Optimize Sensitivity causes the auto measure func- tion to set the sensitivity so the resulting measurement has a minimal amount of noise. It does this by finding the minimum in the measurement trace and comparing this value to the known sensitivity of the instrument at that wave- length. Sensitivity is then reduced until the signal is close to this minimum sensitivity or the sweep time becomes too long. The Optimize Sensitivity func- tion is useful when viewing high dynamic range signals. The drawback to turn- ing this function ON is that it generally requires a longer sweep time to get better sensitivity. The default selection for Optimize Sensitivity: is OFF.

Using the Optical Spectrum Analyzer
The System Menus
Note
None of the Automeasure Setup parameters are affected by the
They are not saved as part of the measurement setup.
To set the
Setup panel selections
1Press the
2Press the More System Functions.... softkey.
3Press the Remote Setup.... softkey. The Remote Setup panel appears.
4The Current HPIB Address information shows the
5Press the Set HPIB Address softkey if changes were made.
The Remote Setup panel
Current HPIB Address
Shows the
New HPIB Address
Enter the new

Using the Optical Spectrum Analyzer
The Traces Menus
The Traces Menus
The Traces softkeys are accessed by using the

Using the Optical Spectrum Analyzer
The Traces Menus
Using the Traces functions
To set the active trace
1Press the
2Press the Active Trace.... softkey.
3Use the arrow keys or knob to select the active trace. or
1Press the
2Press the Active Trace.... softkey.
3Use the arrow keys or knob to select the active trace.
To put a marker on a trace, or to make changes to a trace, it must be the active trace. The active trace is designated by the
To set the update function for the trace
1Press the
2Select the trace to be changed.
3Press the Update <trace> softkey.
4Use the arrow keys or knob to select ON or OFF.
When ON, the trace always accepts data when data is available. When OFF, the trace will not be updated.
To set the display function for the trace
1Press the
2Select the trace to be changed.
3Press the View <trace> softkey to turn the display of the selected trace ON or OFF.

Using the Optical Spectrum Analyzer
The Traces Menus
To set the Hold.... function
1Press the
2Press the Hold <trace>.... softkey to select None, Min or Max. None turns the Hold function off.
The maximum hold function compares the current amplitude value of each point on a trace in the current sweep to the corresponding point detected dur- ing the previous sweep, then displays the maximum value.
The minimum hold function compares the current amplitude value of each point on a trace in the current sweep to the corresponding point detected dur- ing the previous sweep, then displays the minimum value.
Pressing the Max/Min Reset softkey resets the hold function to the last acquired trace. Subsequent traces are accumulated in the hold sequence.
To set the trace math for trace C
1Press the
2Press the Trace Math.... softkey.
3Press the Default Math Trace C.... softkey to define the math expression to be used when the math operations are turned on. The result is placed in Trace C.
4Select the appropriate softkey to define the math expression.
Defines the math expression to be used and turns the math operation ON. The math operation is performed in linear units.
Trace C Math Off
Determines whether or not math processing is performed.

Using the Optical Spectrum Analyzer
The Traces Menus
To set the trace math for trace F
1Press the
2Press the Trace Math.... softkey.
3Press the Default Math Trace F.... softkey. The result is placed in trace F.
4Select the appropriate softkey to define the math expression.
Defines the math expression to be used and turns the math operation ON. The math operation is performed in linear units.
Trace F Math Off
Determines whether or not math processing is done.
To exchange both the
1Press the
2Press the Trace Math.... softkey.
3Press the Exchange Menu.... softkey.
4Select the two traces to be exchanged for both the X- and
To turn all math functions off
1Press the
2Press the Trace Math.... softkey.
3Press the All Math Off softkey.
Using the Optical Spectrum Analyzer
The Traces Menus
To set up averaging
1 Press the
2 Press the Averaging.... softkey.
3Toggle averaging ON or OFF. If averaging is on, softkeys appear to select the number of measurements to be averaged.
Use the keys to select the number of measurements to be averaged. When the number of measurements taken is less than the count, the following formula is used to calculate the data:
sum of all measurements AVG =
number of measurements
If the number of measurements is greater than or equal to the count, the fol- lowing formula is used to calculate the data:
Averaging values other than those displayed can be entered by using the numeric keypad or the knob when the Avg Count active function area is dis- played.
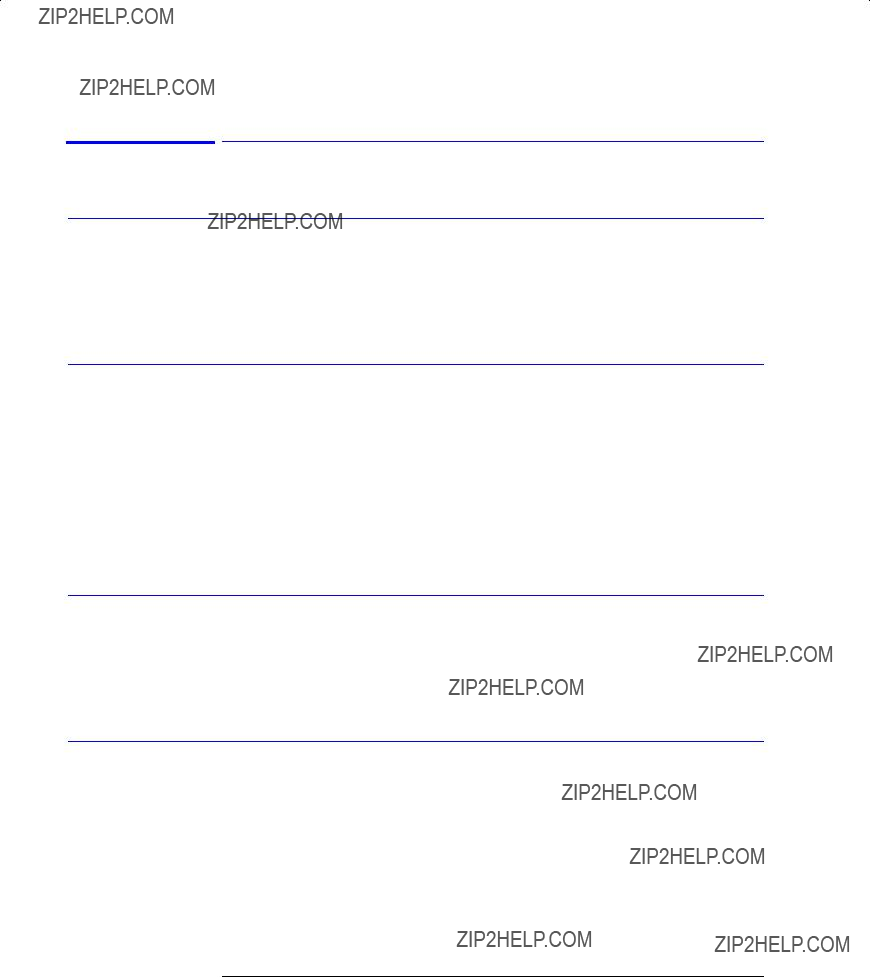
To set the number of points in a sweep
1Press the
2Press the Trace Setup.... softkey. The Trace Setup panel will appear.
The Trace Setup panel
3Enter the desired sweep length in the setup panel. The minimum sweep length is three points. The maximum sweep length is 10,001 points. Refer to ???To Fill In a Setup Panel??? on page
Using the Optical Spectrum Analyzer
The Wavelength Menus
The Wavelength Menus
The Wavelength softkeys are accessed using the
Note
When the optical spectrum analyzer is first turned on, the wavelength range is set to the full 1100 nm span (600 nm to 1700 nm). Sweeps begin at the shortest wavelength (start) and end at the longest wavelength (stop). You can set the center, stop, start, and span wavelength values. The span is set symmetrically about the center wavelength.
Using the Optical Spectrum Analyzer
The Wavelength Menus
Using the Wavelength functions
To set the center wavelength
1Press the
2Press the Center WL softkey.
3Use the knob, step keys or numeric entry pad to enter the desired value.
To set the wavelength span
1Press the
2Press the Span softkey.
3Use the knob, step keys or numeric entry pad to enter the desired value.
The span is set symmetrically about the center wavelength. When the span is set to 0 nm, the display???s horizontal axis represents time instead of wave- length. A span of 0 nm (called zero span mode) configures the optical spec- trum analyzer as a fixed tuned receiver.
To set the start wavelength
1Press the
2Press the Start WL softkey.
3Use the knob, step keys or numeric entry pad to enter the desired value.
To set the stop wavelength
1Press the
2Press the Stop WL softkey.
3Use the knob, step keys or numeric entry pad to enter the desired value.
Using the Optical Spectrum Analyzer
The Wavelength Menus
To set the peak to the center of the display
1Press the
2Press the Peak to CENTER softkey to move the peak to the center of the display.
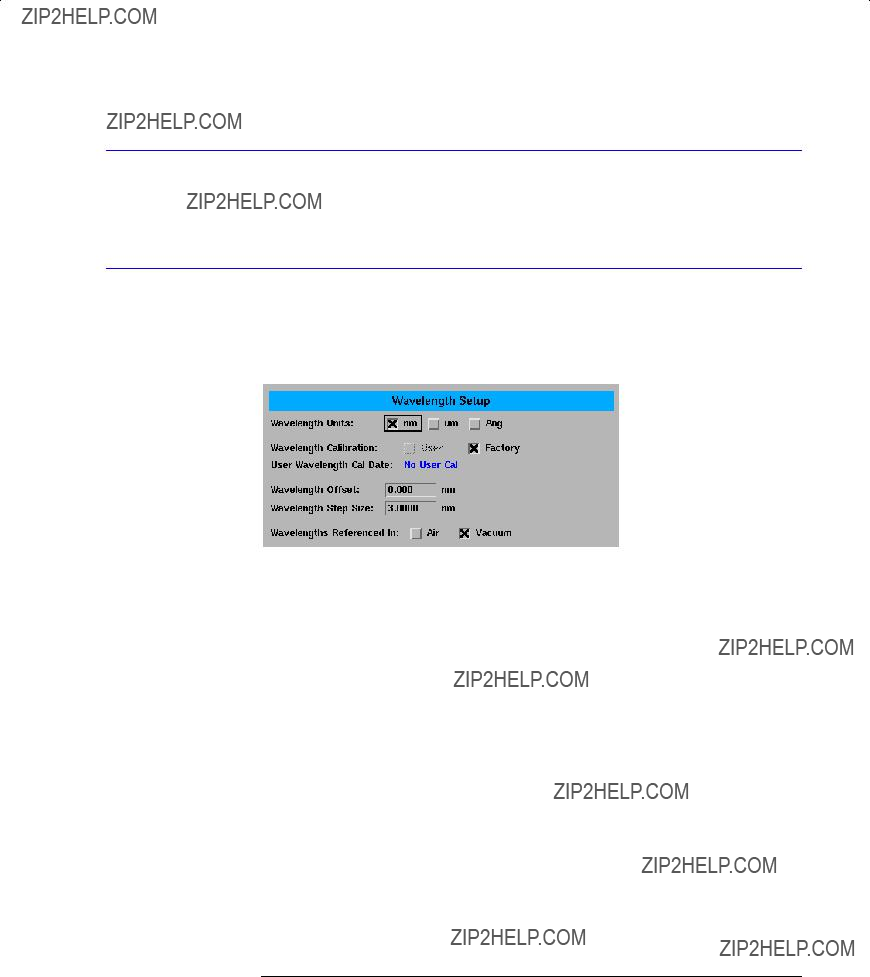
To change the default wavelength settings
1Press the
2Press the Wavelength Setup.... softkey. The Wavelength Setup panel opens.
Setup panel selections
The Wavelength Setup panel
Wavelength Units
Sets the wavelength units to nm, um, or Ang.
Wavelength Calibration
The wavelength calibration is not a simple offset applied to all wavelengths, but uses the trigonometric diffraction grating equation to correct all wave- lengths in a calculated manner. The power offset is a simple offset applied equally to all wavelengths. It is good measurement practice to calibrate the optical spectrum analyzer as close as possible to the wavelength where you plan to make your measurements.
User Wavelength Cal Date
Shows the date of the last successful
Wavelength Offset
Specifies the wavelength offset. This is an offset between the measured wave- length and the displayed wavelength.

Using the Optical Spectrum Analyzer
The Wavelength Menus
Wavelength Step Size
Specifies the center wavelength step size.
Wavelengths Referenced In
Specifies if the displayed wavelengths show values as measured in air or in vacuum. Pressing the

Using the Optical Spectrum Analyzer
To Fill In a Setup Panel
To Fill In a Setup Panel
Setup panels allow you to adjust setup conditions which are not frequently changed.
Using the softkeys The arrow softkeys
Allow the user to navigate from field to field in the dialog box. The highlighted parameter can be changed.
The Select softkey
Selects or deselects the highlighted parameter.
The Defaults softkey
Resets the parameters to their default condition.
Close Panel.... softkey
Saves the current setup and returns the user to the previous menu.
The
Allows the user to enter a numeric value in the highlighted field.

Using the Optical Spectrum Analyzer
To Fill In a Setup Panel
To use the navigation softkeys
1Use the arrow softkeys to highlight the settings on the setup panel.
2Use the Select softkey to toggle the selection boxes on and off.
3Enter values in the numeric fields using the
4To return the setup values to the instrument???s preset settings, press the Defaults softkey.
5When you are satisfied with your selections, press the Close Panel.... softkey to enter your selections and close the setup panel.

4
Monitoring the Instrument
Front Panel Functions to Remote Commands
HP 71450 Series Commands to HP 86140 Series Equivalents
Remote Operation

Remote Operation
Remote Operation
Remote Operation
This chapter provides information on remote programming of the HP 86140- series optical spectrum analyzers. The easiest way to program the instrument is by using the VXIplug&play universal instrument drivers. The VXI- plug&play universal instrument drivers allow you to develop programs using the following applications: HP VEE, LabVIEW1, LabWindows/CVI, C, C++, and Microsoft??2 Visual Basic3.
If you desire more control of the instrument, you can use the
SCPI Consortium.
International Institute of Electrical and Electronics Engineers. IEEE Standard
International Institute of Electrical and Electronics Engineers. IEEE Standard
For situations where all you need to accomplish is capturing the instrument???s display or returning trace data values to the computer, consider using the HP N1031A BenchLink software that was shipped with the instrument.
1.LabVIEW and LabWindows/CVI are products of National Instruments Corporation.
2.Microsoft?? is a U.S. registered trademark of Microsoft Corp.
3.Microsoft Visual Basic is a product of Microsoft Corp.

Remote Operation
Remote Operation
Table
Indicates that the instrument is operating under
Indicates that the instrument has requested service from the computer. Refer to
???Monitoring the Instrument??? on page
Pressing this button activates the
Remote Operation
Getting Started
Getting Started
One of the easiest ways to learn how to write programs to control the instru- ment is to look at simple examples. In ???Example Programs??? on page
To change the
1Press the
2Press the More System Functions.... softkey.
3Press the Remote Setup.... softkey, and change the
Remote mode and
Whenever the instrument is in Remote mode, the RMT message is displayed on the instrument???s screen and all keys are disabled except for the
You can specify a local lockout mode that
Consult the documentation for your programming environment to determine which commands are used to put an instrument in the remote and local lock- out modes. These are not HP 86140 series commands; they control
Remote Operation
Getting Started
Remote command buffering
The OSA accepts serial data via
For this reason, send individual commands rather than combining them. After the command is correctly interpreted, the bus is held until the command exe- cution is complete. If there are no other commands pending, the interface bus is released and the controller can perform other tasks while the OSA is com- pleting the operation.
Command buffering provides an automatic synchronization between the pro- gram sending the commands and the analyzer operation. Each command will be executed before another command is recognized. There is no danger of reading or interpreting trace data in an indeterminate state, such as before a sweep has completed.
Controlling the sweep
Placing the optical spectrum analyzer in remote mode and sending the DISP:WIND:TRAC:ALL:SCAL:AUTO command finds the largest signal and optimizes the analyzer settings. This command also sets single sweep mode on the analyzer. If the DISP:WIND:TRAC:ALL:SCAL:AUTO command is not used, single sweep can be set using the INIT:CONT OFF command. The trace data present in the analyzer must be updated by taking a sweep when appropriate using the INIT:IMM command. Use this command to update the sweep after changing settings.
This mode of operation allows the program to control the sweep and ensure that data read from, or operated on in the analyzer, is updated correctly. Con- trolling the sweep also minimizes the amount of time the analyzer spends sweeping. At high sensitivity and high resolution settings, sweeps can take a significant amount of time. Controlling the sweep ensures that the amount of time spent acquiring data is optimized and that the data being displayed is valid for the current settings.

Remote Operation
Getting Started
Syntax notation conventions
The following information applies to the common and
HCOPy:DATA?
MMEMory:DATA
TRACe:DATA:Y:POWER
TRACe:DATA:Y:RATio
TRACe:DATA:Y?
MEMory:STATe:EXTended?
Uppercase lettering indicates that the uppercase portion of the command is the short form of the command. For example, in the command WAVelength, WAV is the short form.
Table
a.

Remote Operation
Getting Started
SCPI command are grouped in subsytems
In accordance with IEEE 488.2, the instrument???s commands are grouped into ???subsystems.??? Commands in each subsystem perform similar tasks. The first page of this chapter lists where each subsystem is documented.
Sending a command
It???s easy to send a command to the instrument. Simply create a command string from the commands listed in this book, and place the string in your pro- gram language???s output statement. For example, the following string places marker1 on the peak of the active trace:
OUTPUT 723;???CALC:MARK1:MAX???
Use either short or long forms
Commands and queries may be sent in either long form (complete spelling) or short form (abbreviated spelling). The description of each command in this manual shows both versions; the extra characters for the long form are shown in lowercase. The following is a long form of a command:
OUTPUT 723;???:SENSe:WAVelength:STARt????
And this is the short form of the same command:
OUTPUT 723;???:SENS:WAV:STAR????
You can use upper or lowercase letters
Program headers can be sent using any combination of uppercase or lower- case ASCII characters. Instrument responses, however, are always returned in uppercase.
Combine commands in the same subsystem
You can combine commands from the same subsystem provided that they are both on the same level in the subsystem???s hierarchy; simply separate the com- mands with a
OUTPUT 723;???:SENS:WAV:STAR 1300NM???
OUTPUT 723;???:SENS:WAV:STOP 1400NM???
can be combined into one line:
OUTPUT 723;???:SENS:WAV:STAR 1300NM;STOP 1400NM???
The semicolon separates the two functions.

Remote Operation
Getting Started
Combine commands from different subsystems
You can send commands and program queries from different subsystems on the same line; simply precede the new subsystem by a semicolon followed by a colon. In the following example, the colon and semicolon pair before CALC allows you to send a command from another subsystem.
OUTPUT 723;???:SENS:WAV:SPAN:FULL;:CALC:MARK1:MAX???
Sending common commands
If a subsystem has been selected and a common command is received by the instrument, the instrument remains in the selected subsystem. For example, if the command
OUTPUT 723;???:SENS:WAV:STAR 1300NM;*CLS;STOP 1400NM???
is sent to the instrument, the Sense subsystem remains selected. If some other type of command is received within a program message, you must reenter the original subsystem after the command.
Adding parameters to a command
Many commands have parameters that specify an option. Use a space charac- ter to separate the parameter from the command, as shown in the following line:
OUTPUT 723;???:SENS:BWID:RES 0.1NM???
Separate multiple parameters with a comma (,). Spaces can be added around the commas to improve readability.
OUTPUT 723;???:DISP:WIND:TRAC:STAT TRB, ON???
White space
White space is defined to be one or more characters from the ASCII set of
0 through 32 decimal, excluding 10 (NL). White space is usually optional, and can be used to increase the readability of a program.

Remote Operation
Getting Started
Numbers
All numbers are expected to be strings of ASCII characters. Thus, when send- ing the number 9, you would send a byte representing the ASCII code for the character ???9??? (which is 57). A
28, 0.28E2 and
If a measurement cannot be made, no response is given and an error is placed into the error queue. For example,
*RST
:CALC1:MARK1:X?
will timeout the controller and place a Settings conflict error in the error queue.
Table
Program message terminator
The string of instructions sent to the instrument is executed after the instruc- tion terminator is received. The terminator may be either a

Remote Operation
Getting Started
Querying data
Data is requested from the instrument using a query. Queries can be used to find out how the instrument is currently configured. They are also used to obtain results of measurements made by the instrument, with the query actu- ally activating the measurement. String responses are returned as uppercase letters.
Queries usually take the form of a command followed by a question mark (?). After receiving a query, the instrument places the answer in its output queue. The answer remains in the output queue until it is read or another command is issued. For example, the query
OUTPUT 723;???:CALC:MARK1:X????
places the wavelength of marker 1 in the output queue. In HP BASIC, the con- troller input statement
ENTER 720;Range
passes the value across the bus to the controller and places it in the variable Range. Sending another command or query before reading the result of a query causes the output queue to be cleared and the current response to be lost. This also generates an error in the error queue. The output of the instru- ment may be numeric or character data depending on what is queried. Refer to the specific commands for the formats and types of data returned from que- ries. You can send multiple queries to the instrument within a single program message, but you must also read them back within a single program message. This can be accomplished by either reading them back into a string variable or into multiple numeric variables. When you read the result of multiple queries into string variables, each response is separated by a semicolon.

Remote Operation
Monitoring the Instrument
Monitoring the Instrument
Your programs can monitor the HP 86140 series for its operating status, including querying execution or command errors and determining whether or not measurements have been completed. Several status registers and queues are provided to accomplish these tasks as shown in Figure
Querying a register always returns the value as a
Table

Remote Operation
Monitoring the Instrument
Figure

Remote Operation
Monitoring the Instrument
The STATus:PRESet command clears all event registers and sets all bits in the event enable registers. Use the *CLS common command to clear all event regis- ters and all queues except the output queue. If *CLS is sent immediately fol- lowing a program message terminator, the output queue is also cleared. In addition, the request for the *OPC bit is also cleared.
For an example program using the status registers, refer to ???Example 9. Moni- toring the status registers??? on page
Status Byte
The Status Byte contains summary bits that monitor activity in the other sta- tus registers and queues. The register???s bits are set and cleared by summary bits from other registers or queues. If a bit in the Status Byte goes high, query the value of the source register to determine the cause.
Standard Status Structure
The Standard Status Structure monitors the following instrument status events: operation complete, query error, device dependent error, execution error, and command error. When one of these events occurs, the event sets the corresponding bit in the register.

Remote Operation
Monitoring the Instrument
Operation Status Structure
Contains bits that report on the instrument???s normal operation. Additional transition filters give you the ability to select the logic transitions which set the event register bits. For example, you can define the Measuring bit of the Operation Status Structure to be set when a status line transitions from false to true. This is a positive transition. You can also specify a negative transition where bits are set when a status line transitions from true to false.
Questionable Status Structure
Contains bits that report on several questionable instruments conditions.
Remote Operation
Monitoring the Instrument
Output Queue
The output queue stores the instrument responses that are generated by cer- tain commands and queries that you send to the instrument. The output queue generates the Message Available Summary bit when the output queue contains one or more bytes. This summary bit sets the MAV bit (bit 4) in the Status Byte. The method used to read the output queue depends upon the programming language and environment. For example, with HP Basic, the output queue may be read using the ENTER statement.
Error Queue
As errors are detected, they are placed in an error queue. Instrument specific errors are indicated by positive values. General errors have negative values. You can clear the error queue by reading its contents, sending the *CLS com- mand, or by cycling the instrument???s power. The error queue is first in, first out. If the error queue overflows, the last error in the queue is replaced with error

Remote Operation
Example Programs
Example Programs
These programs are provided to give you examples of using HP 86140 series remote programming commands in typical applications. They are not meant to teach general programming techniques or provide
The following example programs are provided in this section:

Remote Operation
Example Programs

Remote Operation
Example Programs

Remote Operation
Example Programs

Remote Operation
Example Programs

Remote Operation
Example Programs

Remote Operation
Example Programs

Remote Operation
Example Programs

Remote Operation
Example Programs
!The following lines calculate the wavelength value of each point
!of the trace. Note that wavelength values of a trace cannot
!be directly queried.

Remote Operation
Example Programs


Remote Operation
Example Programs
Example 8. Total power measurement

Remote Operation
Example Programs

Remote Operation
Example Programs

Remote Operation
Front Panel Functions to Remote Commands
Front Panel Functions to Remote Commands
This is a table of the
Table

Remote Operation
Front Panel Functions to Remote Commands
Table

Remote Operation
Front Panel Functions to Remote Commands
Table

Remote Operation
Front Panel Functions to Remote Commands
Table
Remote Operation
Front Panel Functions to Remote Commands
Table

Remote Operation
Front Panel Functions to Remote Commands
Table
Remote Operation
Command Trees

Remote Operation
Command Trees
:LEFT
:NEXT
:RIGHt
:MINimum
:LEFT
:NEXT
:RIGHt
:PEXCursion
[:PEAK] <param> PIT <param>
:SCENter
:SRANge
:LOWer?
:FREQuency <param> :TIME <param> [:WAVelength] <param>
[:STATe] OFF|ON|0|1 :UPPer?
:FREQuency <param> :TIME <param> [:WAVelength] <param>
:SRLevel
[:STATe] OFF|ON|0|1
:TRACe TRA|TRB|TRC|TRD|TRE|TRF :X?
:FREQuency <param>
:READout FREQuency|WAVelength|TIME :TIME <param>
[:WAVelength] <param>
:Y?
:MATH
[:EXPRession][:DEFine] <expression> :STATe OFF|ON|0|1
:MAXimum
:CLEar
[:STATe] ON|OFF|1|0 :MEAN
[:DATA]?
:STATe ON|OFF|1|0 :RANGe
:LOWer?
:FREQuency <param> :TIME <param> [:WAVelength] <param>
[:STATe] ON|OFF|1|0 :UPPer?
:FREQuency <param> :TIME <param> [:WAVelength] <param>
:MINimum
:CLEar
[:STATe] ON|OFF|1|0 :THReshold <param>
:STATe ON|OFF|1|0 :TPOWer
[:DATA]?

Remote Operation
Command Trees


Remote Operation
Command Trees
Remote Operation
Common Commands
Common Commands
*CLS
Clears all the event status registers summarized in the status byte register. This command resets the status data structure. It does this by emptying the error queue and clearing all bits in all of the event registers.
*ESE <numeric_value>
Sets the bits in the Standard Event Enable register. The Standard Event regis- ter monitors
*ESE?
Returns the value of the Standard Event Enable register.
*ESR?
Reads and clears the Standard Event Status register. The register is cleared when it is read. The response value is an integer, to be interpreted as a binary number, representing the bit values of the register.
*IDN?
Returns a string value which identifies the instrument type and firmware ver- sion. The string is a

Remote Operation
Common Commands
*OPC
Sets bit 0 in the Standard Event Status register when all pending operations have finished.
*OPC?
Returns a 1 when all operations have finished.
*OPT?
Returns a
*RCL <numeric_value>|<filename>[,INTernal|FLOPpy]
Recalls previously saved instrument settings from the requested register or file.
*RST
Executes a device reset and returns the instrument to a known state. This command is not the same as the SYSTem:PRESet command. See page
*SAV <numeric_value>|<filename>[,INTernal|FLOPpy]
Saves instrument settings to the designated register or file.
*SRE <numeric_value>
Sets the bits in the Service Request Enable register. The parameter is rounded to an integer value and interpreted as a binary number, representing the bit values of the register. The Service Request Enable register serves as a mask for the Status Byte. When a bit in the Status Byte goes to 1, if the correspond- ing bit in the Service Request Enable register is a 1, the instrument asserts the Service Request line on the
*SRE?
Returns the value of the Service Request Enable register.

Remote Operation
Common Commands
*STB?
Returns the current value of the instrument???s Status Byte. This will not change the Status Byte register. The response value is an integer, to be interpreted as a binary number, representing the bit values of the register. Performing a serial poll on the instrument also reads the Status Byte register, except that bit 6 indicates whether there is a service request that has not been serviced. The most convenient way to clear the Status Byte register is to send a *CLS command. The Status Byte register summarizes the states of the other regis- ter sets. It is also responsible for generating service requests.
*TST?
Tests the analyzer interface hardware and returns 0 if the interface is func- tional.
*WAI
Prevents the instrument from executing any further commands until the cur- rent command has finished executing. The *WAI command ensures that over- lapped commands are completely processed before subsequent commands, those sent after the *WAI command, are processed. This command is not needed by the optical spectrum analyzer, since all commands are non- overlapped, but it is included for compatibility with existing programs that might use it.
Remote Operation
CALCulate Subsystem Commands
CALCulate Subsystem Commands
The CALCulate subsystem performs
Note
CALC: is interpreted as CALC1:. CALC1 controls TRA, CALC2 controls TRB, CALC3 con- trols TRC, CALC4 controls TRD, CALC5 controls TRE, and CALC6 controls TRF.
CALCulate[1|2|3|4|5|6]:AVERage:CLEar
Causes the average data to be cleared and the average counter to be reset to zero.
CALCulate:AVERage:COUNt <numeric_value>
CALCulate:AVERage:COUNt?
Sets the number of measurements to be averaged. When the number of mea- surements taken is less than the count, the following formula is used to calcu- late the data:
sum of all measurements AVG =
number of measurements
If the number of measurements is greater than or equal to the count, the fol- lowing formula is used to calculate the data:
Remote Operation
CALCulate Subsystem Commands
CALCulate[1|2|3|4|5|6]:AVERage[:STATe] OFF|ON|0|1
CALCulate[1|2|3|4|5|6]:AVERage[:STATe]?
Turns trace averaging ON and OFF. If a math expression with the correspond- ing CALCulate subopcode is OFF, the SENSe:DATA is averaged. If the math expression is ON, the result of the math expression is averaged.
The CALCulate:AVERage, CALCulate:MAXimum, and CALCulate:MINimum states are mutually exclusive. Each trace can have only one of these functions on at a time. Turning CALCulate:AVERage ON will automatically turn CALCu- late:MAXimum and CALCulate:MINimum OFF. Each trace can have different CALC blocks turned on.
CALCulate:MARKer:AOFF
Turns off all markers and marker functions.
Note
If no marker number is given in the following marker commands, the command is inter- preted as referring to marker number 1. For example, CALC:MARK ON is equivalent to CALC:MARK1 ON.
Note
Going to zero span will turn off all markers. This is because markers are referenced to a particular time or wavelength not a particular display position. Going out of zero span will restore the markers to the state they were in before going to zero span. Changing to or from zero span changes the fundamental units for the
CALCulate:MARKer:FUNCtion:BWIDth|BANDwidth:INTerpolate OFF|ON|0|1
CALCulate:MARKer:FUNCtion:BWIDth|BANDwidth:INTerpolate?
Turns the bandwidth marker interpolation ON or OFF. When interpolation is ON, the bandwidth markers will be placed at the exact NDB setting from the normal marker if the trace data allows. The position of the marker will be lin- early interpolated between two true trace data points. The default state is ON. If interpolate is OFF, for negative NDB values, the bandwidth markers will be at

Remote Operation
CALCulate Subsystem Commands
values closest to and more negative than the NDB value. For positive NDB val- ues, the bandwidth markers will be at values closest to and more positive than the NDB values. This will typically result in a wider bandwidth measurement.
This is a global setting and controls the interpolation state for all four band- width markers.
CALCulate:MARKer[1|2|3|4]:FUNCtion:BWIDth|BANDwidth:NDB <numeric_value>
CALCulate:MARKer[1|2|3|4]:FUNCtion:BWIDth|BANDwidth:NDB?
Sets the desired vertical offset from the numbered marker of the bandwidth markers. The parameter units are as specified in the UNIT:RATio command.
This value can be set or queried anytime. The marker does not have to be on or in the bandwidth function.
CALCulate:MARKer:FUNCtion:BWIDth|BANDwidth:READout FREQuency|WAVelength|TIME
CALCulate:MARKer:FUNCtion:BWIDth|BANDwidth:READout?
Sets the
Trying to set the readout to TIME when in a
CALCulate:MARKer[1|2|3|4]:FUNCtion:BWIDth|BANDwidth:RESult?
Returns the difference in the
If the bandwidth markers cannot find the desired NDB setting relative to the normal marker, the result returned will be 9.91e37. This value is defined by the SCPI standard to represent NaN (not a number).
This query generates a ???Settings conflict??? error if the bandwidth function is OFF for the specified marker.

Remote Operation
CALCulate Subsystem Commands
CALCulate:MARKer[1|2|3|4]:FUNCtion:BWIDth|BANDwidth[:STATe] OFF|ON|0|1
CALCulate:MARKer[1|2|3|4]:FUNCtion:BWIDth|BANDwidth[:STATe]?
Turns the bandwidth marker function ON or OFF for a particular marker. Only one marker function is allowed to be on at a time for each individual marker. Turning on the bandwidth function for a marker will turn off any other marker function and turn on the Bandwidth function. For example, turning on the Bandwidth function for a marker that has the Delta function ON, will turn OFF the Delta function and turn ON the Bandwidth function for the marker.
If the bandwidth function is turned ON for a marker that is OFF, the marker will be turned ON, placed at the center wavelength, and then the bandwidth mark- ers will measure the bandwidth relative to this marker.
CALCulate:MARKer[1|2|3|4]:FUNCtion:BWIDth|BANDwidth:X:CENTer?
Returns the absolute
This query generates a ???Settings conflict??? error if the bandwidth function is OFF for the specified marker.
CALCulate:MARKer[1|2|3|4]:FUNCtion:BWIDth|BANDwidth:X:LEFT?
Returns the absolute
This query generates a ???Settings conflict??? error if the bandwidth function is OFF for the specified marker.

Remote Operation
CALCulate Subsystem Commands
CALCulate:MARKer[1|2|3|4]:FUNCtion:BWIDth|BANDwidth:X:RIGHt?
Returns the absolute
This query generates a ???Settings conflict??? error if the bandwidth function is OFF for the specified marker.
CALCulate:MARKer[1|2|3|4]:FUNCtion:DELTa:RESet
Sets the reference for the delta marker to the current position of the delta marker.
CALCulate:MARKer[1|2|3|4]:FUNCtion:DELTa[:STATe] OFF|ON|0|1
CALCulate:MARKer[1|2|3|4]:FUNCtion:DELTa[:STATe]?
Turns the delta marker function ON or OFF for a particular marker. Individual markers can have only one marker function on at a time.
Turning the delta function for a marker ON will turn any other marker function OFF. For example, turning the delta function ON for a marker that has the bandwidth function ON, will turn the bandwidth function OFF and turn the delta function ON for the marker.
If the delta function is turned ON for a marker that is OFF, the marker will be turned ON, placed at the center wavelength, and the delta function will be turned ON.
CALCulate:MARKer[1|2|3|4]:FUNCtion:DELTa:X:OFFSet?
Returns the difference between the absolute
The units of the value returned by the query are determined by the CALCu- late:MARKer:FUNCtion:DELTa:X:READout state. For READout of FRE- Quency, the units are Hertz. For READout of WAVelength, the units are meters. For READout of TIME, the units are seconds.
This query generates a ???Settings conflict??? error if the delta function is OFF for the specified marker.

Remote Operation
CALCulate Subsystem Commands
CALCulate:MARKer[1|2|3|4]:FUNCtion:DELTa:X:OFFSet:FREQuency <numeric_value>
Allows the user to set the marker offset in frequency units. The marker
This query generates a ???Settings conflict??? error if the delta function is OFF for the specified marker.
CALCulate:MARKer[1|2|3|4]:FUNCtion:DELTa:X:OFFSet:TIME <numeric_value>
Allows the user to set the marker offset when the instrument is in zero span. The marker
This query generates a ???Settings conflict??? error if the delta function is OFF for the specified marker.
CALCulate:MARKer[1|2|3|4]:FUNCtion:DELTa:X:OFFSet[:WAVelength]<numeric_value>
Allows the user to set the marker offset in wavelength units. The marker X- axis value corresponds to the reference X value + the offset value. The default units of the parameter are meters.
Even though the offset READout may be FREQuency, this command can still be used to specify the offset using wavelength units.
For example:
CALC:MARK:FUNC:DELT:X:OFFS:WAV 10NM when readout is WAVElength CALC:MARK:FUNC:DELT:X:OFFS:FREQ 10THZ when readout is FREQuency CALC:MARK:FUNC:DELT:X:OFFS:WAV
This query generates a ???Settings conflict??? error if the delta function is OFF for the specified marker.
CALCulate:MARKer:FUNCtion:DELTa:X:READout FREQuency|WAVelength|TIME
CALCulate:MARKer:FUNCtion:DELTa:X:READout?
Sets the

Remote Operation
CALCulate Subsystem Commands
Trying to set the readout to TIME when in a
CALCulate:MARKer[1|2|3|4]:FUNCtion:DELTa:X:REFerence?
Returns the
This query generates a ???Settings conflict??? error if the delta function is OFF for the specified marker.
CALCulate:MARKer[1|2|3|4]:FUNCtion:DELTa:Y:OFFSet?
Returns the difference between the delta marker absolute Y value and the ref- erence Y value.
This query generates a ???Settings conflict??? error if the delta function is OFF for the specified marker.
CALCulate:MARKer[1|2|3|4]:FUNCtion:DELTa:Y:REFerence?
Returns the
This query generates a ???Settings conflict??? error if the delta function is OFF for the specified marker.
CALCulate:MARKer[1|2|3|4]:FUNCtion:NOISe:BWIDth|BANDwidth <numeric_value>
CALCulate:MARKer[1|2|3|4]:FUNCtion:NOISe:BWIDth|BANDwidth?
Sets the normalization bandwidth for the marker noise result query. The default units for the parameter are meters. There are only two allowable set- tings: 1 nm and 0.1 nm. Sending any value outside this range will generate a "Data out of range" error. Sending a value within this range will set the band- width to whichever of the two possible settings is closest to the specified value. If the specified noise marker is OFF, a ???Settings conflict??? error is gener- ated.
Remote Operation
CALCulate Subsystem Commands
CALCulate:MARKer[1|2|3|4]:FUNCtion:NOISe:RESult?
This query returns the noise marker value normalized to 1 or 0.1 nm. The nor- malization bandwidth is controlled by the CALCulate:MARKer:FUNC- tion:NOISe:BWIDth command.
This query generates a ???Settings conflict??? error if the noise function is OFF for the specified marker.
CALCulate:MARKer[1|2|3|4]:FUNCtion:NOISe[:STATe] OFF|ON|0|1
CALCulate:MARKer[1|2|3|4]:FUNCtion:NOISe[:STATe]?
Turns the marker noise function ON or OFF for a particular marker. Individual markers can have only one marker function on at a time. Use the CALCulate:MARKer:X command to position the noise marker.
CALCulate:MARKer[1|2|3|4]:FUNCtion:PRESet
Turns OFF all marker functions for the specified marker. This command is pro- vided as a convenient way to turn all marker functions off without having to check the state of each individual marker function. If the marker specified by this command is OFF, the marker will be turned ON with all marker functions OFF, that is, the marker will be in the ???normal??? marker mode.
CALCulate:MARKer:INTerpolate OFF|ON|0|1
CALCulate:MARKer:INTerpolate?
Turns the normal/delta marker interpolation ON or OFF. When interpolation is ON, the normal/delta markers will be placed at the exact X setting, if the trace data allows. The marker will linearly interpolate between two true trace data points. The default state is OFF.
This setting controls the interpolation state for all four markers, except for the bandwidth markers.
CALCulate:MARKer[1|2|3|4]:MAXimum
Places the specified marker on the highest point of the trace. The point does not have to meet the peak excursion and threshold criteria. The marker trace is determined by the CALCulate:MARKer:TRACe command. If the specified marker is OFF, it will be turned ON and placed on the highest point of the trace.

Remote Operation
CALCulate Subsystem Commands
CALCulate:MARKer[1|2|3|4]:MAXimum:LEFT
Places the marker on the next peak located at a shorter wavelength than the current marker wavelength position. This next peak must meet the peak excursion and threshold criteria. If the specified marker is OFF, it will be turned ON, placed at the center wavelength, and the search to the left will begin from that point.
CALCulate:MARKer[1|2|3|4]:MAXimum:NEXT
Places the marker on the next highest peak from the current marker ampli- tude. This next highest peak must meet the peak excursion and threshold cri- teria. If the specified marker is OFF, it will be turned ON, placed at the center wavelength, and the search for the next maximum will begin from that point.
CALCulate:MARKer[1|2|3|4]:MAXimum:RIGHt
Places the marker on the next peak located at a longer wavelength than the current marker wavelength position. This next peak must meet the peak excursion and threshold criteria. If the specified marker is OFF, it will be turned ON, placed at the center wavelength, and the search to the right will begin from that point.
CALCulate:MARKer[1|2|3|4]:MINimum
Places the specified marker on the lowest point of the trace. The point does not have to meet the pit excursion and threshold criteria. The marker trace is determined by the CALCulate:MARKer:TRACe command. If the specified marker is OFF, it will be turned ON and placed on the lowest point of the trace.
CALCulate:MARKer[1|2|3|4]:MINimum:LEFT
Places the marker on the next pit located at a shorter wavelength than the current marker wavelength position. This next pit must meet the pit excursion and threshold criteria. If the specified marker is OFF, it will be turned ON, placed at the center wavelength, and the search to the left will begin from that point.

Remote Operation
CALCulate Subsystem Commands
CALCulate:MARKer[1|2|3|4]:MINimum:NEXT
Places the marker on the next lowest pit from the current marker amplitude. This next lowest pit must meet the pit excursion and threshold criteria. If the specified marker is OFF, it will be turned ON, placed at the center wavelength, and the search for the next minimum will begin from that point.
CALCulate:MARKer[1|2|3|4]:MINimum:RIGHt
Places the marker on the next pit located at a longer wavelength than the cur- rent marker wavelength position. This next pit must meet the pit excursion and threshold criteria. If the specified marker is OFF, it will be turned ON, placed at the center wavelength, and the search to the right will begin from that point.
CALCulate:MARKer[1|2|3|4]:PEXCursion[:PEAK] <numeric_value>
CALCulate:MARKer[1|2|3|4]:PEXCursion[:PEAK]?
Sets the peak excursion value for the marker search routines. The peak excur- sion value is used to determine whether or not a local maximum in the trace is to be considered a peak. To qualify as a peak, both sides of the local maximum must fall by at least the peak excursion value.
CALCulate:MARKer[1|2|3|4]:PEXCursion:PIT <numeric_value>
CALCulate:MARKer[1|2|3|4]:PEXCursion:PIT?
Sets the pit excursion value for the marker search routines. The pit excursion value is used to determine whether or not a local minimum in the trace is to be considered a pit. To qualify as a pit, both sides of the local minimum must rise by at least the pit excursion value.
CALCulate:MARKer[1|2|3|4]:SCENter
Sets the center wavelength to the wavelength value of the marker.
CALCulate:MARKer:SRANge:LOWer?
Returns the lower limit for the marker search range. The range used for the marker search range is the same range used for the total power calculation, the trace mean range, and the wavelength sweep range. The return value is in meters, unless span is set to zero, in which case the return value is in seconds.
Remote Operation
CALCulate Subsystem Commands
CALCulate:MARKer:SRANge:LOWer:FREQuency <param>
Sets the lower limit for the marker search range. Setting this value when CALCulate:MARKer:SRANge:STATe is OFF will automatically turn CALCulate:MARKer:SRANge:STATe ON. The range used for the marker search range is the same range used for the total power calculation, the trace mean range, and the wavelength sweep range. Changing the range with this com- mand will change all four ranges. Sending the command when the instrument is in a zero span will generate a ???Settings conflict??? error. The default units for the parameter is in Hertz.
CALCulate:MARKer:SRANge:LOWer:TIME <param>
Sets the lower limit for the marker search range. Setting this value when CALCulate:MARKer:SRANge:STATe is OFF will automatically turn CALCulate:MARKer:SRANge:STATe ON. The range used for the marker search range is the same range used for the total power calculation, the trace mean range, and the wavelength sweep range. Changing the range with this com- mand will change all four ranges. Sending this command while span is not set to zero will results in a ???Settings conflict??? error. Default units for the parame- ter is in seconds.
CALCulate:MARKer:SRANge:LOWer[:WAVelength] <param>
Sets the lower limit for the marker search range. Setting this value when CALCulate:MARKer:SRANge:STATe is OFF will automatically turn CALCulate:MARKer:SRANge:STATe ON. The range used for the marker search range is the same range used for the total power calculation, the trace mean range, and the wavelength sweep range. Changing the range with this com- mand will change all four ranges. Sending the command when the instrument is in a zero span will generate a ???Settings conflict??? error. Default units for the parameter is in meters; frequency units are allowed.

Remote Operation
CALCulate Subsystem Commands
CALCulate:MARKer:SRANge[:STATe] OFF|ON|0|1
CALCulate:MARKer:SRANge[:STATe]?
Turns the search range ON or OFF for all the markers. When the search range is ON, all the marker maximum/minimum searches will be within the upper and lower wavelength range. Although there is a single range controlling the total power integration, the marker search range, the mean calculation, and the wavelength sweep range, there are four independent state settings for limiting the total power integration, the marker search, the mean calculation, and the wavelength sweep to the range. If all four states for the total power integra- tion, the marker search, the mean calculation, and the wavelength sweep range are OFF, setting CALCulate:MARKer:SRANge:STATe to ON will initialize
CALCulate:MARKer:SRANge:UPPer?
Returns the upper limit for the marker search range. The range used for the marker search range is the same range used for the total power calculation, the trace mean range, and the wavelength sweep range. The return value is in meters, unless span is set to zero, in which case the return value is in seconds.
CALCulate:MARKer:SRANge:UPPer:FREQuency <param>
Sets the upper limit for the marker search range. Setting this value when CALCulate:MARKer:SRANge:STATe is OFF will automatically turn CALCulate:MARKer:SRANge:STATe ON. The range used for the marker search range is the same range used for the total power calculation, the trace mean range, and the wavelength sweep range. Changing the range with this com- mand will change all four ranges. Sending the command when the instrument is in a zero span will generate a ???Settings conflict??? error. The default units for the parameter is in Hertz.

Remote Operation
CALCulate Subsystem Commands
CALCulate:MARKer:SRANge:UPPer:TIME <param>
Sets the upper limit for the marker search range. Setting this value when CALCulate:MARKer:SRANge:STATe is OFF will automatically turn CALCulate:MARKer:SRANge:STATe ON. The range used for the marker search range is the same range used for the total power calculation, the trace mean range, and the wavelength sweep range. Changing the range with this com- mand will change all four ranges. Sending this command while span is not set to zero will result in a ???Settings conflict??? error. Default units for the parameter is in seconds.
CALCulate:MARKer:SRANge:UPPer[:WAVelength] <param>
Sets the upper limit for the marker search range. Setting this value when CALCulate:MARKer:SRANge:STATe is OFF will automatically turn CALCulate:MARKer:SRANge:STATe ON. The range used for the marker search range is the same range used for the total power calculation, the trace mean range, and the wavelength sweep range. Changing the range with this com- mand will change all four ranges. Sending the command when the instrument is in a zero span will generate a ???Settings conflict??? error. Default units for the parameter is in meters; frequency units are allowed.
CALCulate:MARKer[1|2|3|4]:SRLevel
Sets the reference level to the amplitude of the marker.
CALCulate:MARKer[1|2|3|4][:STATe] OFF|ON|0|1
CALCulate:MARKer[1|2|3|4][:STATe]?
Turns a particular marker ON or OFF. If no number is given for the MARKer node, 1 is assumed. (For example, CALCulate:MARKer ON will turn marker 1 ON.) The marker will be placed on the trace determined by the CALCulate:MARKer:TRACe command. If no trace is specified, the default trace is trace A. The marker will be placed at the center wavelength. Turning a marker OFF will turn off any marker function that was on for that particular marker. When the marker is turned ON again, all the marker functions for that marker will be off.

Remote Operation
CALCulate Subsystem Commands
CALCulate:MARKer[1|2|3|4]:TRACe TRA|TRB|TRC|TRD|TRE|TRF
CALCulate:MARKer[1|2|3|4]:TRACe?
Places the marker on a particular trace.
CALCulate:MARKer[1|2|3|4]:X?
Returns the
The units of the value returned by the query is determined by the CALCulate:MARKer:X:READout state. For READout of FREQuency, the units returned are in Hertz. For READout of WAVelength, the units returned are meters. For READout of TIME, the units are in seconds.
Sending the query when the specified marker is OFF will generate a ???Settings conflict??? error.
CALCulate:MARKer[1|2|3|4]:X:FREQuency <numeric_value>
Sets the
Sending the command when the specified marker is OFF will turn the marker ON and place the marker at the desired position. Sending the command when the instrument is in a zero span will generate a ???Settings conflict??? error.
CALCulate:MARKer:X:READout FREQuency|WAVelength|TIME
CALCulate:MARKer:X:READout?
Sets the
Trying to set the READout to TIME when in a

Remote Operation
CALCulate Subsystem Commands
CALCulate:MARKer[1|2|3|4]:X:TIME <numeric_value>
Sets the
Sending the command when the specified marker is OFF will turn the marker ON and place the marker at the desired position. Sending the command when the instrument is in a
CALCulate:MARKer[1|2|3|4]:X[:WAVelength] <numeric_value>
Sets the
Sending the command when the specified marker is OFF will turn the marker ON and place the marker at the desired position. Sending the command when the instrument is in a zero span will generate a ???Settings conflict??? error.
CALCulate:MARKer[1|2|3|4]:Y?
Returns the
Sending the command when the specified marker is off will generate a ???Set- tings conflict??? error.
Remote Operation
CALCulate Subsystem Commands
CALCulate[1|2|3|4|5|6]:MATH[:EXPRession][:DEFine] (<expression>)
CALCulate[1|2|3|4|5|6]:MATH[:EXPRession][:DEFine]?
Note
The parentheses in the above expression are required for proper operation of this com- mand.
Defines a math expression to be used when the math operations are turned ON. The <expression> can contain a <trace_name> as operands. The math operations will be performed in linear units. If, for example, the desired opera- tion is TRA ??? TRB in log units, the expression should be defined as TRA / TRB. Each CALCulate subsystem can have one expression defined. Recursive expressions are not allowed.
Example Statements:
For the equivalent of the front panel C = Alog ??? B key:
OUTPUT 723 "CALC3:MATH:EXPR (TRA / TRB)"
For the equivalent of the front panel C = Alog + B key:
OUTPUT 723 "CALC3:MATH:EXPR (TRA * TRB)"
For the equivalent of the front panel C = Alin ??? B key:
OUTPUT 723 "CALC3:MATH:EXPR (TRA ??? TRB)"
For the equivalent of the front panel C = Alin + B key:
OUTPUT 723 "CALC3:MATH:EXPR (TRA + TRB)"
For the equivalent of the front panel F = Clog ??? D key:
OUTPUT 723 "CALC6:MATH:EXPR (TRC / TRD)"
Note
CALC1 controls TRA, CALC2 controls TRB, CALC3 controls TRC, CALC4 controls TRD,
CALC5 controls TRE, and CALC6 controls TRF.

Remote Operation
CALCulate Subsystem Commands
CALCulate[1|2|3|4|5|6]:MATH:STATe OFF|ON|0|1
CALCulate[1|2|3|4|5|6]:MATH:STATe
Determines whether or not math processing is done.
CALCulate[1|2|3|4|5|6]:MAXimum:CLEar
Clears the current maximum hold values for the trace and allows a new maxi- mum hold to occur. The trace will be initialized to a very negative dBm value
CALCulate[1|2|3|4|5|6]:MAXimum[:STATe] OFF|ON|0|1
CALCulate[1|2|3|4|5|6]:MAXimum[:STATe]?
Turns maximum hold on a trace ON or OFF. The maximum hold operation com- pares the current amplitude value of each point on a trace in the current sweep to the corresponding point detected during the previous sweep, then stores the maximum value. The CALCulate:AVERage, CALCulate:MAXimum, and CALCulate:MINimum states are mutually exclusive. Each trace can have only one of these functions on at a time. Turning CALCulate:MAXimum ON will automatically turn CALCulate:AVERage and CALCulate:MINimum OFF. Each trace is allowed to have a different CALC block turned on. For example, CALCulate1:MAXimum ON, CALCulate2:MINimum ON, CALCulate3:AVERage ON will put trace A in maximum hold, trace B in minimum hold and trace C in trace average mode.
If the math expression with the corresponding CALCulate subopcode is OFF, then the SENSe:DATA is used for the maximum hold operation. If the math expression is ON, the result of the math expression is used for the maximum hold operation.

Remote Operation
CALCulate Subsystem Commands
CALCulate[1|2|3|4|5|6]:MEAN[:DATA]?
Returns the arithmetic mean of the trace associated with the subopcode of the CALCulate node. The points of the trace are summed in linear units and the sum is divided by the number of points. When the CALCulate:MEAN:RANge is ON, the mean is calculated over the upper and lower
CALCulate[1|2|3|4|5|6]:MEAN:RANGe:LOWer?
This query returns the lower
The range used for the trace mean range is the same range used for the total power calculation, the marker search range, and the wavelength sweep range.
The return value is in meters, unless the span is set to zero, in which case the return value is in seconds.
CALCulate[1|2|3|4|5|6]:MEAN:RANGe:LOWer:FREQuency <numeric_value>[HZ|KHZ|MHZ|GHZ|THZ]
Sets the lower
The range used for the trace mean range is the same range used for the total power calculation, the marker search range, and the wavelength sweep range. Changing the range with this command will change all four ranges. Default units for the parameters are Hertz.
Sending this command when the instrument is in a zero span will generate a ???Settings conflict??? error.

Remote Operation
CALCulate Subsystem Commands
CALCulate[1|2|3|4|5|6]:MEAN:RANGe:LOWer:TIME <numeric_value>[NS|US|MS|S]
Sets the lower
The range used for the trace mean range is the same range used for the total power calculation, the marker search range, and the wavelength sweep range. Changing the range with this command will change all four ranges. Default units for the parameters are seconds.
Sending this command while span is not set to zero will result in a ???Settings Conflict??? error.
CALCulate[1|2|3|4|5|6]:MEAN:RANGe:LOWer[:WAVelength] <numeric_value>[M|UM|NM|A]
This command sets the lower
The range used for the trace mean range is the same range used for the total power calculation, the marker search range, and the wavelength sweep range. Changing the range with this command will change all four ranges.
Sending this command when the instrument is in a zero span will generate a ???Settings conflict??? error. Default units for the parameter are meters. Fre- quency units are also allowed.
CALCulate[1|2|3|4|5|6]:MEAN:RANGe[:STATe] OFF|ON|0|1
CALCulate[1|2|3|4|5|6]:MEAN:RANGe[:STATe]?
Turns the trace mean calculation range ON or OFF for all traces. Turning the calculation range ON will also turn the CALCulate:MEAN:STATe ON for the specified trace (the trace is specified via its subopcode). There is a single range controlling the total power integration, the trace mean range, the marker search range, and the wavelength sweep range, but there are four independent state settings for limiting the total power calculation, the trace mean calculation, the marker search, and the wavelength sweep to the range.

Remote Operation
CALCulate Subsystem Commands
CALCulate[1|2|3|4|5|6]:MEAN:RANGe:UPPer?
This query returns the upper
The returned value is in meters, unless the span is set to zero, in which case the returned value is in seconds.
CALCulate[1|2|3|4|5|6]:MEAN:RANGe:UPPer:FREQuency <numeric_value>[HZ|KHZ|MHZ|GHZ|THZ]
Sets the upper
CALCulate[1|2|3|4|5|6]:MEAN:RANGe:UPPer:TIME <numeric_value>[NS|US|MS|S]
This command sets the upper limit for the trace mean range calculation. Set- ting this value when CALCulate:MEAN:RANGe:STATe is OFF will automatically turn CALCulate:MEAN:RANGe:STATe ON. The range used for the trace mean range is the same range used for the total power calculation, the marker search range, and the wavelength sweep range. Changing the range with this command will change all four ranges. Default units for the parameter are sec- onds.
Sending this command while span is not set to zero will result in a ???Settings Conflict??? error.
CALCulate[1|2|3|4|5|6]:MEAN:RANGe:UPPer[:WAVelength] <numeric_value>[M|UM|NM|A]
This command sets the upper
Sending the command when the instrument is in a zero span will generate a ???Settings conflict??? error.
Remote Operation
CALCulate Subsystem Commands
CALCulate[1|2|3|4|5|6]:MEAN:STATe OFF|ON|0|1
CALCulate[1|2|3|4|5|6]:MEAN:STATe?
Turns the mean power calculation for a trace ON or OFF. Only one mean power calculation can be turned on at a time. For example, if a mean power calcula- tion is being performed on trace A, turning a mean power calculation for trace B ON will turn the calculation for trace A OFF.
CALCulate[1|2|3|4|5|6]:MINimum:CLEar
Clears the current minimum hold values for the trace and allows a new mini- mum hold to occur. The trace will be initialized to the current value of the trace. If the specified trace is not in the minimum hold state, sending this com- mand will have no effect.
CALCulate[1|2|3|4|5|6]:MINimum[:STATe] OFF|ON|0|1
CALCulate[1|2|3|4|5|6]:MINimum[:STATe]?
Turns minimum hold for a trace ON or OFF. The minimum hold operation com- pares the current amplitude value of each point on a trace in the current sweep to the corresponding point detected during the previous sweep, then stores the minimum value. The CALCulate:AVERage, CALCulate:MAXimum, and CALCulate:MINimum states are mutually exclusive. Each trace can have only one of these functions on at a time. Turning CALCulate:MINimum ON will automatically turn CALCulate:AVERage and CALCulate:MAXimum OFF. Each trace can have a different CALC block turned on. For example, CALCulate1:MAXimum ON, CALCulate2:MINimum ON, CALCulate3:AVERage ON will put trace A in maximum hold, trace B in minimum hold, and trace C in trace average mode.
If the math expression with the corresponding CALCulate subopcode is OFF, then the SENSe:DATA is used for the minimum hold operation. If the math expression is ON, the result of the math expression is used for the minimum hold operation.
CALCulate:THReshold <param>[W|MW|UW|DBM]
CALCulate:THReshold?
Sets the value for the marker search threshold.

Remote Operation
CALCulate Subsystem Commands
CALCulate[1|2|3|4|5|6]:THReshold:STATe ON|OFF|1|0
CALCulate[1|2|3|4|5|6]:THREshold:STATe?
Turns on the marker search threshold function. When this threshold function is ON, marker peak searches will ignore peaks below the threshold value.
CALCulate[1|2|3|4|5|6]:TPOWer[:DATA]?
Returns the total power of the specified trace. Trace A corresponds to CALCulate1, trace B to CALCulate2, and so on. Corrections to the total power are made for the slope and variation of the resolution bandwidth filter over the wavelength range of the trace. When the CALCulate:TPOWer:IRANge is ON, the total power is calculated over the upper and lower range limits; otherwise, the total power is calculated over the entire trace. Sending this query when the CALCulate:TPOWer:STATe is OFF will generate a "Settings conflict" error.
CALCulate[1|2|3|4|5|6]:TPOWer:IRANge:LOWer <numeric_value>[M|UM|NM|A|HZ|KHZ|MHZ|GHZ|THZ]
CALCulate[1|2|3|4|5|6]:TPOWer:IRANge:LOWer?
Sets the lower
Default units for the parameter are meters. Sending the command when the instrument is in a zero span will generate a ???Settings conflict??? error.

Remote Operation
CALCulate Subsystem Commands
CALCulate[1|2|3|4|5|6]:TPOWer:IRANge[STATe] OFF|ON|0|1
CALCulate[1|2|3|4|5|6]:TPOWer:IRANge[STATe]?
Turns the total power calculation range for all traces ON or OFF. Setting IRANge:STATe to ON will set the corresponding TPOWer:STATe to ON. Although there is a single range controlling the total power integration, the trace mean calculation, the marker search range, and the wavelength sweep range, there are four independent state settings for limiting the total power calculation, the trace mean, the marker search, and the wavelength sweep to the range. If all four states for the total power integration, the trace mean, the marker search, and the wavelength sweep range are OFF, setting the CALCu-
Sending the command when the instrument is in a zero span will generate a ???Settings conflict??? error.
CALCulate[1|2|3|4|5|6]:TPOWer:IRANge:UPPer <numeric_value>[M|UM|NM|A|HZ|KHZ|MHZ|GHZ|THZ]
CALCulate[1|2|3|4|5|6]:TPOWer:IRANge:UPPer?
Sets the upper
Default units for the parameter are meters. Sending the command when the instrument is in a zero span will generate a ???Settings conflict??? error.
CALCulate[1|2|3|4|5|6]:TPOWer:STATe OFF|ON|0|1
CALCulate[1|2|3|4|5|6]:TPOWer:STATe?
Turns the total power calculation for a trace ON or OFF. Only one total power calculation can be turned on at a time. For example, if a total power calcula- tion is being performed on trace A, turning a total power calculation for trace B ON will turn the calculation for trace A OFF. Turning this function ON in zero span generates a ???Settings conflict??? error.

Remote Operation
CALibration Subsystem Commands
CALibration Subsystem Commands
CALibration:ALIGn
Performs an automatic alignment of the instrument at the wavelength of the largest signal found in full span. This aligns the monochrometer output with the photodetector for improved amplitude accuracy. Sending this command with a marker on screen will generate a ???Settings conflict??? error. See page
CALibration:ALIGn:MARKer[1|2|3|4]
Performs an automatic alignment of the instrument at the wavelength of the specified marker. This aligns the monochrometer output with the photodetec- tor for improved amplitude accuracy. Sending this command without the spec- ified marker on will generate a ???Settings conflict??? error.
CALibration:ALIGn:EXTernal
Performs an alignment of the instrument using an external broadband source. The instrument performs an alignment at each of several wavelengths and stores the values in a wavelength alignment table. This results in improved amplitude accuracy.
CALibration:ALIGn:PRESET
Sets the alignment of the instrument to the preset
CALibration:DATE?
Returns the date of the most recent factory calibration.

Remote Operation
CALibration Subsystem Commands
CALibration:POWer
Performs a power calibration. The calibration is aborted if the power mea- sured on the input signal is more than 3 dB higher or 10 dB lower than the value specified in the CALibration:POWer:VALue command.
CALibration:POWer:DATE?
Returns the date of the most recent power calibration.
CALibration:POWer:STATe OFF|ON|0|1
CALibration:POWer:STATe?
Specifies whether or not the calibration power data is applied. Amplitude accuracy is only specified with power calibration ON.
CALibration:POWer:VALue <param>
CALibration:POWer:VALue?
Specifies the power to be used for calibration. Default units are set by the
UNITs:POWer command.
CALibration:POWer:WAVelength <numeric_value>[M|UM|NM|A|HZ|KHZ|MHZ|GHZ]
CALibration:POWer:WAVelength?
Specifies the wavelength of the signal used for the amplitude calibration.
CALibration:PRESet
Presets the calibration of the instrument to
CALibration:STATe OFF|ON|0|1
CALibration:STATe?
Specifies if the calibration data is applied or not. Amplitude accuracy and wavelength accuracy are only specified when calibration is ON. The response value is the logical AND of CALibration:POWer:STATe? and CALibra- tion:WAVelength:STATe?.

Remote Operation
CALibration Subsystem Commands
CALibration:WAVelength
Performs a wavelength calibration. If the wavelength measured on the input signal differs more than ??2.5 nm from the value specified in the CALibra- tion:WAVelength:VALue command, the calibration is aborted.
CALibration:WAVelength:DATE?
Returns the date of the most recent wavelength calibration.
CALibration:WAVelength:MARKer[1|2|3|4]
Performs a wavelength calibration using the wavelength of the marker as the reference. If the wavelength of the marker differs more than ??2.5 nm from the value specified in the CALibration:WAVelength:VALue command, the calibra- tion is aborted. If this marker is not ON, this command generates a ???Settings conflict??? error.
CALibration:WAVelength:STATe OFF|ON|0|1
CALibration:WAVelength:STATe?
Specifies whether or not the calibration wavelength data is applied. Wave- length accuracy is only specified with wavelength calibration ON.
CALibration:WAVelength:VALue <param>[M|UM|NM|A]
CALibration:WAVelength:VALue?
Specifies the wavelength for calibration. Default units for the parameter are meters.
CALibration:ZERO[:AUTO] OFF|ON|0|1|ONCE
CALibration:ZERO[:AUTO]?
Specifies whether or not autozeroing is enabled. Autozeroing measures and compensates for the dark current of the photodetector for improved ampli- tude accuracy. The ONCE parameter causes the dark current to be measured one time, and then the resulting correction is applied to all subsequent mea- surements. Autozeroing ON causes the dark current to be measured between sweeps, and then the resulting correction is applied to the next sweep.

Remote Operation
DISPlay Subsystem Commands
DISPlay Subsystem Commands
DISPlay[:WINDow[1]]:ANNotation[:ALL] ON|OFF|0|1
DISPlay[:WINDow[1]]:ANNotation[:ALL]?
Turns the screen annotation ON or OFF. Affects only the
DISPlay[:WINDow[1]]:TEXT:CLEar
Erases all text on the display resulting from previous use of the DISPlay[:WIN- Dow[1]]:TEXT:DATA command.
DISPlay[:WINDow[1]]:TEXT:DATA <string>|<data_block>
DISPlay[:WINDow[1]]:TEXT:DATA?
Writes text on the display in the Title area. Use the <data_block> parameter to send extended ASCII characters such as control codes and symbols.
DISPlay[:WINDow[1]]:TRACe:ALL[:SCALe][:AUTO]
Finds the largest input signal using trace A and sets the span and vertical scale to display that signal. This command performs the same function as the front- panel
The following defines the instrument state settings altered by Auto Measure. State settings that are not listed are not altered.
Because many instrument state setting are altered, it is recommended you use this command only to find unknown signals. It is not recommend this com- mand be used in the middle of a measurement routine.

Remote Operation
DISPlay Subsystem Commands

Remote Operation
DISPlay Subsystem Commands
For each marker, except marker 1:
Marker 1 is identical, except when the final span is
DISPlay[:WINDow[1]]:TRACe:ALL[:SCALe][:AUTO]:MARKer OFF|ON|0|1
DISPlay[:WINDow[1]]:TRACe:ALL[:SCALe][:AUTO]:MARKer?
Changes the DISPlay:WINDow:TRACe:ALL:SCALe:AUTO command to find the input signal closest to the marker and set span and vertical scale to view that signal.
DISPlay[:WINDow[1]]:TRACe:ALL[:SCALe][:AUTO]:OPTimize OFF|ON|0|1
DISPlay[:WINDow[1]]:TRACe:ALL[:SCALe][:AUTO]:OPTimize?
Changes the DISPlay:WINDow:TRACe:ALL:SCALe:AUTO command to opti- mize sensitivity after finding the input signal. Also sets single sweep mode.
DISPlay[:WINDow[1]]:TRACe:GRATicule:GRID[:STATe] OFF|ON|0|1
DISPlay[:WINDow[1]]:TRACe:GRATicule:GRID[:STATe]?
Turns the graticule ON or OFF.
DISPlay[:WINDow[1]]:TRACe[:STATe] TRA|TRB|TRC|TRD|TRE|TRF,OFF|ON|0|1
DISPlay[:WINDow[1]]:TRACe[:STATe]? TRA|TRB|TRC|TRD|TRE|TRF
Turns the trace display ON or OFF. Specifying any trace other than the ones listed will generate an ???Illegal parameter value??? error.

Remote Operation
DISPlay Subsystem Commands
DISPlay[:WINDow[1]]:TRACe:X[:SCALe]:AUTO:SPAN <numeric_value>[M|NM|UM]
DISPlay[:WINDow[1]]:TRACe:X[:SCALe]:AUTO:SPAN?
Specifies the final span after a DISPlay:WINDow:TRACe:ALL:SCALe:AUTO command.
DISPlay[:WINDow[1]]:TRACe:X[:SCALe]:AUTO:SPAN:AUTO ON|OFF|1|0
DISPlay[:WINDow[1]]:TRACe:X[:SCALe]:AUTO:SPAN:AUTO?
Specifies whether the final span after a DISPlay:WINDow:TRACe:ALL: SCALe: AUTO command should be set automatically, based on properties of the mea- sured signal.
DISPlay[:WINDow[1]]:TRACe:Y[:SCALe]:AUTO:PDIVision <numeric_value>[DB]
DISPlay[:WINDow[1]]:TRACe:Y[:SCALe]:AUTO:PDIVision?
Specifies the final vertical scale after performing a DISPlay:WIN-
Dow:TRACe:ALL:SCALe:AUTO command.
DISPlay[:WINDow[1]]:TRACe:Y[1|2][:SCALe]:AUTO:PDIVision:AUTO OFF|ON|0|1
DISPlay[:WINDow[1]]:TRACe:Y[1|2][:SCALe]:AUTO:PDIVision:AUTO?
Specifies whether the final vertical scale after a DISPlay:WIN- Dow:TRACe:ALL:SCALe:AUTO command should be adjusted automatically, based on signal properties. Y1 refers to the left (power) scale, and Y2 refers to the right (ratio) scale.
DISPlay[:WINDow[1]]:TRACe:Y[1|2][:SCALe]:LINear OFF|ON|0|1
DISPlay[:WINDow[1]]:TRACe:Y[1|2][:SCALe]:LINear?
Specifies whether the vertical scale is in linear units or in log units. Y1 refers to the left (power) scale, and Y2 refers to the right (ratio) scale.
Remote Operation
DISPlay Subsystem Commands
DISPlay[:WINDow[1]]:TRACe:Y[1|2][:SCALe]:PDIVision <numeric_value>[DB]
DISPlay[:WINDow[1]]:TRACe:Y[1|2][:SCALe]:PDIVision?
Specifies the dB per division of the vertical scale. Y1 refers to the left (power) scale, and Y2 refers to the right (ratio) scale.
The maximum value for the vertical scale is 20 dB per division for the power scale or the ratio scale. The minimum value is 0.01 dB per division. The Preset value is 10 dB per divi- sion.
DISPlay[:WINDow[1]]:TRACe:Y[1|2][:SCALe]:RLEVel <numeric_value>[DBM|W|UW|NW|MW|DB]
DISPlay[:WINDow[1]]:TRACe:Y[1|2][:SCALe]:RLEVel?
Specifies the power value of the reference level. Default units are set by the UNIT:POWer command for Y1 and the UNIT:RATio command for Y2.
The maximum value for the power reference level is the equivalent of +300 dBm. The minimum value is
The maximum value for the ratio reference level is 270 dB. The minimum value is
DISPlay[:WINDow[1]]:TRACe:Y[1|2}[:SCALe]:RPOSition <numeric value>
DISPlay[:WINDow[1]]:TRACe:Y[1|2][:SCALe]:RPOSition?
Selects the position at which the reference level is displayed. The top and bot- tom graticule lines correspond to 10 and 0, respectively. The default is 9.
DISPlay[:WINDow[1]]:TRACe:Y[:SCALe]:SPACing LINear|LOGarithmic
DISPlay[:WINDow[1]]:TRACe:Y[:SCALe]:SPACing?
Specifies the scaling of the vertical axis as logarithmic or linear. In LOG scale, the scale in dB per division is specified by the DISPlay[:WINDow[1]]:TRACe :Y[:SCALe]:PDIVision command.

Remote Operation
FORMat Subsystem Commands
FORMat Subsystem Commands
FORMat[:DATA] REAL[,64]|ASCii
FORMat[:DATA]?
Specifies the trace data format used during data transfer via

Remote Operation
HCOPy Subsystem Commands
HCOPy Subsystem Commands
HCOPy:DATA?
Returns the currently defined printer output as an indefinite length block. After removing the #0 prefix and newline suffix, this block can be saved by the controller and sent directly to a suitable printer.
HCOPy:DESTination ???SYSTem:COMMunicate:INTernal???|???SYStem:COMMunicate:CENtronics???
HCOPy:DESTination?
Selects the I/O port for hard copy output. This affects subsequent presses of the Print key and the HCOPy[:IMMediate] command.
HCOPy[:IMMediate]
The entire screen is output to the port defined by the HCOPy:DESTination command. This is equivalent to pressing the Print key.

Remote Operation
INITiate Subsystem Commands
INITiate Subsystem Commands
INITiate:CONTinuous OFF|ON|0|1
INITiate:CONTinuous?
Specifies repeat or single sweep.
INITiate[:IMMediate]
Initiates a new measurement sweep.

Remote Operation
MEMory Subsystem Commands
MEMory Subsystem Commands
MEMory:STATe[:EXTended]?
Returns extended state information as an indefinite length block.

Remote Operation
MMEMory Subsystem Commands
MMEMory Subsystem Commands
MMEMory:CATalog? [INTernal|FLOPpy]
Lists all files in the current directory. The return data will be formatted as:
<mem_used>,<mem_free> {,<file listing>}
Each <file listing> indicates the name, type, and size of one file in the direc- tory list:
<file_name>,<file_type>,<file_size>
MMEMory:DATA <file_name>,<data_block>
MMEMory:DATA? <file_name>
Stores <data_block> in the memory location <file_name>. The query response is the <data_block> stored in <file_name>, where <data_block> is an indefi- nite block.
MMEMory:DELete <file_name> [,INTernal|FLOPpy]
Deletes the specified file.
MMEMory:INITialize [FLOPpy]
Formats a disk in the instrument???s 3.5 inch disk drive.
MMEMory:LOAD:TRACe TRA|TRB|TRC|TRD|TRE|TRF,<file_name> [,INTernal|FLOPpy]
Loads the specified trace from mass storage.
MMEMory:STORe:TRACe TRA|TRB|TRC|TRD|TRE|TRF,<file_name> [,INTernal|FLOPpy]
Stores the specified trace to mass storage.

Remote Operation
SENSe Subsystem Commands
SENSe Subsystem Commands
[SENSe:]BANDwidth|BWIDth[:RESolution] <numeric_value>[M|NM|UM|A]
[SENSe:]BANDwidth|BWIDth[:RESolution]?
Sets the resolution bandwidth. Available resolution bandwidths are 10 nm, 5 nm, 2 nm, 1 nm, and either 0.07 nm or 0.06 nm. The narrowest resolution bandwidth in 0.7 nm on the HP 86140A and 86143A. It is 0.06 nm on the HP 86142A and 86145A.
In the AUTO coupled setting, the resolution bandwidth is controlled by the chosen wave- length span and the value set for [SENSe:]BANDwidth|BWIDth[:RESolution]:RATio.
[SENSe:]BANDwidth|BWIDth[:RESolution]:AUTO OFF|ON|0|1
[SENSe:]BANDwidth|BWIDth[:RESolution]:AUTO?
Couples the resolution bandwidth to the wavelength span. SENSe:BAND- width:AUTO ON sets the resolution bandwidth to span ??? resolution band- width ratio.
The Preset state of the resolution bandwidth coupling is AUTO.
[SENSe:]BANDwidth|BWIDth[:RESolution]:RATio <numeric_value>
[SENSe:]BANDwidth|BWIDth[:RESolution]:RATio?
Specifies the ratio of the resolution bandwidth to the span. This parameter is multiplied by the span width to determine the automatic setting of the resolu- tion bandwidth. The default ratio is .01.

Remote Operation
SENSe Subsystem Commands
[SENSe:]BANDwidth|BWIDth:VIDeo <numeric_value> [HZ|KHZ|MHZ|GHZ]
[SENSe:]BANDwidth|BWIDth:VIDeo?
Specifies the bandwidth of the
[SENSe:]BANDwidth|BWIDth:VIDeo:AUTO OFF|ON|0|1
[SENSe:]BANDwidth|BWIDth:VIDeo:AUTO?
The [SENSe:]BANDwidth|BWIDth:VIDeo:AUTO command enables and disables automatic coupling of the video bandwidth.
Video bandwidth filtering occurs after detection of the light. In the autocou- pled mode, the video bandwidth has an extremely wide range. This allows the optical spectrum analyzer to avoid unnecessary filtering that would reduce the sweep speed more than required.
Normally, the video bandwidth is coupled to the sensitivity. Manually entering a video bandwidth breaks this coupling. The video bandwidth can be manually set from 100 MHz to 3 kHz, or the bandwidth of the currently selected tran- simpedance amplifier, whichever is less.
The following functions affect video bandwidth:
???Changing the sensitivity value.
???Changing the reference level.
???Turning autoranging ON or OFF.
The range of video bandwidth available in Auto mode is much greater than can be set manually from the front panel. A lower value of video bandwidth requires a longer sweep time. Because of the interdependence between the video bandwidth and sensitivity, it is recommended that either the sensitivity or the video bandwidth be changed, whichever is the most important to the measurement task being performed.
Because of the interdependence of sensitivity and video bandwidth, these parameters cannot be set individually. If one of the parameters is set manually, the other is forced into Auto coupled mode and set by the instrument. Set either the desired sensitivity or the desired video bandwidth, depending on which parameter is most important to the current measurement task.
The Preset state of the video bandwidth coupling is AUTO.
Remote Operation
SENSe Subsystem Commands
[SENSe:]CHOP[:STATe] OFF|ON|0|1
[SENSe:]CHOP[:STATe]?
Turns the spectrum analyzer chop mode ON or OFF. Chop mode increases dynamic range for long sweep times by subtracting ambient light.
[SENSe:]CORRection:RVELocity:MEDium AIR|VACuum
[SENse:]CORRection:RVELocity:MEDium?
Determines whether the wavelengths used and displayed are referenced to air or vacuum.
[SENSe:]GORDer[:AUTO] OFF|ON|0|1
[SENSe:]GORDer[:AUTO]?
Specifies the spectrum analyzer grating order mode. When ON, allows the instrument to select the best reflection order for the wavelength range. When OFF causes the instrument to use the
[SENSe:]POWer[:DC]:RANGe:AUTO OFF|ON|0|1
[SENSe:]POWer[:DC]:RANGe:AUTO?
Turns the automatic ranging feature ON or OFF. For improved dynamic range, automatic ranging changes the input range during the sweep.
Note
It is recommended this function be in AUTO mode.
[SENSe:]POWer[:DC]:RANGe:LOCK OFF|ON|0|1
[SENSe:]POWer[:DC]:RANGe:LOCK?
Locks the transimpedance amplifier to the currently selected range.
[SENSe:]POWer[:DC]:RANGe:LOWer <numeric_value>[DBM|W|UW|NM|MW]
[SENSe:]POWer[:DC]:RANGe:LOWer?
Specifies the desired value for sensitivity. Default units are set by the
UNITs:POWer command.
Remote Operation
SENSe Subsystem Commands
The maximum value for Sensitivity is +300 dBm. The minimum value is the value that causes the sweep time to become 1000 seconds, and is an attribute of each individual optical spectrum analyzer. The minimum value will always be less than the values for sensitivity shown in the Specifications section of the User???s Guide.
[SENSe:]POWer[:DC]:RANGe:LOWer:AUTO OFF|ON|0|1
[SENSe:]POWer[:DC]:RANGe:LOWer:AUTO?
Turns the automatic setting of sensitivity ON or OFF. Specifying a value for sen- sitivity with the [SENSe]POWer[:DC]:RANGe:LOWer command will turn Auto
OFF.
[SENSe:]SWEep:POINts <numeric_value>
[SENSe:]SWEep:POINts?
Sets the number of the data points acquired during a sweep. The minimum number of data points is three and the maximum is 10001.
[SENSe:]SWEep:TIME <numeric_value>[US|MS|S]
[SENSe:]SWEep:TIME?
Specifies the time in which the spectrum analyzer sweeps the displayed wave- length range.
[SENSe:]SWEep:TIME:AUTO OFF|ON|0|1
[SENSe:]SWEep:TIME:AUTO?
When this function is ON, the sweep time is coupled to the trace length and the span.
[SENSe:][WAVelength:]CENTer <numeric_value>[M|NM|UM|A|HZ|KHZ|MHZ|GHZ]
[SENSe:][WAVelength:]CENTer?
Specifies the center wavelength. The start and stop wavelength and, if neces- sary, the span are adjusted so that:
Remote Operation
SENSe Subsystem Commands
and
Span
Center = Stop ???
2
With Wavelength Limit Off, the minimum value for the Center Wavelength is nominally 350.1 nm. The maximum value is 1999.9 nm. These limits are valid for wavelengths ref- erenced in air or vacuum.
With Wavelength Limit On, the minimum value for the Center Wavelength is nominally 600.1 nm. The maximum value is 1699.9 nm. These limits are valid for wavelengths ref- erenced in air or vacuum.
The Preset value for Wavelength Limit is On. The Preset value for Center Wavelength is 1150 nm.
[SENSe:][WAVelength:]CENTer:STEP:AUTO OFF|ON|0|1
[SENSe:][WAVelength:]CENTer:STEP:AUTO?
When ON, the step size is automatic. When OFF, the step size is fixed. The value is set by the [SENSe:][WAVelength:]CENTer:STEP[:INCRement] com- mand.
[SENSe:][WAVelength:]CENTer:STEP[:INCRement] <numeric_value>[M|NM|UM|A]
[SENSe:][WAVelength:]CENTer:STEP[:INCRement]?
Specifies the center wavelength step size.
[SENSe:][WAVelength:]LIMit OFF|ON|0|1
[SENSe:][WAVelength:]LIMit?
Specifies whether the span is limited to the specified range of 600 to 1700 nm.
[SENSe:][WAVelength:]OFFSet <numeric_value>[M|NM|UM|A]
[SENSe:][WAVelength:]OFFSet?
Specifies the wavelength offset. This is the offset between the measured wavelength and the displayed wavelength.

Remote Operation
SENSe Subsystem Commands
[SENSe:][WAVelength:]SPAN <numeric_value>[M|NM|UM|A]
[SENSe:][WAVelength:]SPAN?
Specifies the wavelength span. The start and stop wavelength and, if neces- sary, the center wavelength are adjusted so that:
Span = 2( Center ??? Start)
and
Span = 2( Stop ??? Center)
The minimum value for Wavelength Span is 0.2 nm.
With Wavelength Limit Off, the maximum value for Wavelength Span is 1650 nm.
With Wavelength Limit On, the maximum value for Wavelength Span is 1100 nm.
The Preset value for Wavelength Limit is On. The Preset value for Wavelength Span is 1100 nm.
[SENSe:][WAVelength:]SPAN:FULL
Sets the wavelength span of the spectrum analyzer to full span.
[SENSe:][WAVelength:]SRANge:LOWer <numeric_value>[M|NM|UM|A|HZ|KHZ|MHZ|GHZ]
[SENSe:][WAVelength:]SRANge:LOWer?
Sets the lower limit for the wavelength sweep range. Setting this value when SENSe:WAVelength:SRANge:STATe is OFF will automatically turn SENSe:WAVelength:SRANge:STATe ON. The range used for the wavelength sweep range is the same range used for the total power integration, the trace mean range, and the marker search range. Changing the range with this com- mand will change all four ranges.
Sending the command when the instrument is in a zero span will generate a ???Settings conflict??? error.
Default units for the parameter are meters. Frequency units are allowed.

Remote Operation
SENSe Subsystem Commands
[SENSe:][WAVelength:]SRANge[:STATe] OFF|ON|0|1
[SENSe:][WAVelength:]SRANge[:STATe]?
Turns the wavelength sweep range ON or OFF. When the sweep range is ON, the instrument will only sweep between the upper and lower sweep range limits. There is a single range controlling the total power integration, the trace mean calculation, the marker search range, and the wavelength sweep range, but there are four independent state settings for limiting the total power integra- tion, the trace mean, the marker search, and the wavelength sweep to the range. If all four states for the total power integration, the trace mean, the marker search, and the wavelength sweep range are OFF, setting SENSe:WAVelength:SRANge:STATe to ON, will initialize
Sending the command when the instrument is in a zero span will generate a ???Settings conflict??? error.
[SENSe:][WAVelength:]SRANge:UPPer <numeric_value>[M|NM|UM|A|HZ|KHZ|MHZ|GHZ]
[SENSe:][WAVelength:]SRANge:UPPer?
Sets the upper limit for the wavelength sweep range. Setting this value when SENSe:WAVelength:SRANge:STATe is OFF will automatically turn SENSe:WAVelength:SRANge:STATe ON. The range used for the wavelength sweep range is the same range used for the total power integration, the trace mean range and the marker search range. Changing the range with this com- mand will change all four ranges.
Sending the command when the instrument is in a zero span will generate a ???Settings conflict??? error. Default units for the parameter are meters. Fre- quency units are allowed.

Remote Operation
SENSe Subsystem Commands
[SENSe:][WAVelength:]STARt <numeric_value>[M|NM|UM|A|HZ|KHZ|MHZ|GHZ]
[SENSe:][WAVelength:]STARt?
Specifies the start wavelength. The center wavelength and span are adjusted so that:
Span
Start = Center ???
2
and
Span
Stop = Center +
2
If the instrument is in zero span, this command sets the center wavelength to the value specified.
With Wavelength Limit Off, the minimum value for the Start Wavelength is nominally 350 nm. The maximum value is 1999.8 nm. These limits are valid for wavelengths refer- enced in air or vacuum.
With Wavelength Limit On, the minimum value for the Start Wavelength is nominally 600 nm. The maximum value is 1699.8 nm. These limits are valid for wavelengths refer- enced in air or vacuum.
The Preset value for Wavelength Limit is On. The Preset value for Start Wavelength is 600 nm.
Remote Operation
SENSe Subsystem Commands
[SENSe:][WAVelength:]STOP <numeric_value>[M|NM|UM|A|HZ|KHZ|MHZ|GHZ]
[SENSe:][WAVelength:]STOP?
Specifies the stop wavelength. The center wavelength and span are adjusted so that:
Span
Start = Center ???
2
and
Span
Stop = Center +
2
If the instrument is in zero span, this command sets the center wavelength to the value specified.
With Wavelength Limit Off, the minimum value for the Stop Wavelength is nominally 350.2 nm. The maximum value is 2000 nm. These limits are valid for wavelengths refer- enced in air or vacuum.
With Wavelength Limit On, the minimum value for the Stop Wavelength is nominally 600.2 nm. The maximum value is 1700 nm. These limits are valid for wavelengths refer- enced in air or vacuum.
The Preset value for Wavelength Limit is On. The Preset value for Stop Wavelength is 1700 nm.

Remote Operation
SOURce[n] Subsystem Commands
SOURce[n] Subsystem Commands
SOURce[n]:PULSe:DCYCle <numeric_value>
SOURce[n]:PULSe:DCYCle?
Sets the duty cycle of the sync output. This is equivalent to the
TRIGger[:SEQuence]:OUTPut:PULSe:DCYCle command.
SOURce[n]:PULSe:WIDTh <numeric_value>[S|MS|US|NS]
SOURce[n]:PULSe:WIDTh?
Sets the pulse width of the sync output. This is equivalent to the TRIGger[:SEQuence]:OUTPut:PULSe:WIDTh command.

Remote Operation
STATus Subsystem Commands
STATus Subsystem Commands
STATus:OPERation:CONDition?
Queries the contents of the operation condition register.
STATus:OPERation:ENABle <int_value>
STATus:OPERation:ENABle?
Sets or queries the contents of the operation enable register.
STATus:OPERation[:EVENt]?
Queries the contents of the operation event register. This query reads the con- tents of the register and then clears it.
STATus:OPERation:NTRansition <int_value>
STATus:OPERation:NTRansition?
Sets or queries the contents of the operation negative transition register.
STATus:OPERation:PTRansition <int_value>
STATus:OPERation:PTRansition?
Sets or queries the contents of the operation positive transition register.
STATus:PRESet
Clears the event registers and sets all bits in the enable registers.
STATus:QUEStionable:CONDition?
Queries the contents of the questionable condition register.

Remote Operation
STATus Subsystem Commands
STATus:QUEStionable:ENABle <int_value>
STATus:QUEStionable:ENABle?
Sets or queries the contents of the questionable enable register.
STATus:QUEStionable:EVENt?
Queries the contents of the questionable event register and then clears it.
Remote Operation
SYSTem Subsystem Commands
SYSTem Subsystem Commands
SYSTem:DATE?
Queries the date of the
SYSTem:ERRor[:NEXT]?
Queries the earliest entry in the error queue, thus deleting it. The *CLS com- mand clears the error queue.
SYSTem:HELP:HEADers?
Returns a list of all commands and queries implemented by the instrument.
SYSTem:PON[:TYPE] PRESet|LAST
SYSTem:PON[:TYPE]?
Selects the state of the optical spectrum analyzer when it is turned on.
SYSTem:PRESet
Performs an instrument preset, setting the instrument to a known state. See page
SYSTem:TIME?
Queries the time of the

Remote Operation
SYSTem Subsystem Commands
SYSTem:TZONe:NAME?
Returns the time zone used by the
The time zone must be one of the following:
SYSTem:VERSion?
Returns the version of SCPI with which it is compatible.
Remote Operation
TRACe Subsystem Commands
TRACe Subsystem Commands
TRACe[:DATA]:X:STARt? TRA|TRB|TRC|TRD|TRE|TRF
Returns the start value for the
TRACe[:DATA]:X:TIME:SSTop TRA|TRB|TRC|TRD|TRE|TRF <numeric_value>[S|MS|US]
This command sets the start and stop values for the
Changing the
TRACe[:DATA]:X:TYPE? TRA|TRB|TRC|TRD|TRE|TRF
This query reads the
The trace names defined for the instrument are: TRA, TRB, TRC, TRD, TRE, and TRF. Specifying any other will generate an ???Illegal parameter value??? error.

Remote Operation
TRACe Subsystem Commands
TRACe[:DATA]:X:[WAVelength]SSTop TRA|TRB|TRC|TRD|TRE|TRF,
<numeric_value>[M|UM|NM|A|HZ|KHZ|MHZ|GHZ],<numeric_value>[M|UM|NM|A|HZ|KHZ|MHZ|GHZ]
Sets the start and stop values for the
Changing the
TRACe[:DATA]:X:STOP? TRA|TRB|TRC|TRD|TRE|TRF
Returns the stop value for the
TRACe[:DATA][:Y]? TRA|TRB|TRC|TRD|TRE|TRF
Returns the

Remote Operation
TRACe Subsystem Commands
TRACe[:DATA][:Y][:POWer] TRA|TRB|TRC|TRD|TRE|TRF,<data_block>
|<numeric_value>{,<numeric_value>}
Sets the
This command should be used where trace data represents power. The trace data format to be used with this command is determined by the FORMat sub- system.
TRACe[:DATA][:Y]:RATio TRA|TRB|TRC|TRD|TRE|TRF,<data_block>
|<numeric_value>{,<numeric_value>}
Sets the
This command should be used when the trace data represents a power ratio (unitless number). The trace data format to be used with this command is determined by the FORMat subsystem.
TRACe:EXCHange TRA,TRB|TRC|TRD|TRE|TRF
TRACe:EXCHange TRB, TRC
Exchanges both the
The TRACe:FEED:CONTrol of the two traces is set to NEVer before the data is exchanged. Both
Changing the

Remote Operation
TRACe Subsystem Commands
TRACe:FEED:CONTrol TRA|TRB|TRC|TRD|TRE|TRF,ALWays|NEVer
TRACe:FEED:CONTrol? TRA|TRB|TRC|TRD|TRE|TRF
Controls how often the specified trace accepts new data. Setting the TRACe:FEED:CONTrol command to ALWays will allow the trace to always accept new data whenever data is available from the FEED. This is equivalent to turning on the trace update from the front panel.
Setting the TRACe:FEED:CONTrol command to NEVer will cause no new data to be fed into the trace. This is equivalent to turning off the trace update from the front panel.
When switching from NEVer to ALWays, all the valid data from the data source is immediately copied into the trace. If, for example:
???the instrument is in single sweep mode.
???TRA has SENSe:DATA as the FEED and NEVer as the FEED:CONTrol.
???SENSe:DATA contains valid measurement data
Setting the TRACe:FEED:CONTrol command from NEVer to ALWays for TRA will immediately copy the SENSe:DATA into trace A. If the instrument was in continuous sweep mode, and a sweep was in progress, setting the CONTrol command from NEVer to ALWays would immediately copy all the valid SENSe:DATA for the partial sweep.
TRACe:POINts TRA|TRB|TRC|TRD|TRE|TRF,<numeric_value>
TRACe:POINts? TRA|TRB|TRC|TRD|TRE|TRF
Sets the number of data points to be used in the trace. Use only for download- ing data with trace subsystem commands. Use SENSe:SWEep:POINts for changing the measurement trace length. Refer to ???[SENSe:]SWEep:POINts <numeric_value>??? on page

Remote Operation
TRIGger Subsystem Commands
TRIGger Subsystem Commands
TRIGger[:SEQuence]:DELay <numeric_value>[S|MS|US|NS]
TRIGger[:SEQuence]:DELay?
Specifies the trigger delay used to start a measurement.
TRIGger[:SEQuence]:OUTPut OFF|ON|AUTO
TRIGger[:SEQuence]:OUTPut?
Controls the ADC trigger output. When OFF the signal will be a TTL LOW. When ON the signal will be a TTL HIGH. When AUTO is specified the signal will go HIGH before the sampling interval of the detector and go LOW after the sampling interval of the detector.
TRIGger[:SEQuence]:OUTPut:PULSe:DCYCle <numeric_value>
TRIGger[:SEQuence]:OUTPut:PULSe:DCYCle?
Sets the duty cycle of the sync output. This is equivalent to the
SOURce[n]:PULSe:DCYCle command.
TRIGger[:SEQuence]:OUTPut:PULSe:WIDTh <numeric_value>[S|MS|US|NS]
TRIGger[:SEQuence]:OUTPut:PULSe:WIDTh?
Sets the pulse width of the sync output. This is equivalent to the
SOURce[n]:PULSe:WIDTh command.
TRIGger[:SEQuence]:SLOPe POSitive|NEGative|EITHer
TRIGger[:SEQuence]:SLOPe?
Specifies the polarity of triggering used to start a measurement. Specifying the slope sets the trigger source to INTernal.

Remote Operation
TRIGger Subsystem Commands
TRIGger[:SEQuence]:SOURce IMMediate|EXTernal|INTernal
TRIGger[:SEQuence]:SOURce?
Specifies the source, or type, of triggering used to start a measurement. Set- ting the source to anything other than INTernal sets the slope to EITHer.

Remote Operation
UNIT Subsystem Commands
UNIT Subsystem Commands
UNIT:POWer DBM|W|AUTO
UNIT:POWer?
Specifies the amplitude units for the input, output, and display of the active window and sets the UNIT:RATio units to the corresponding setting.
UNIT:RATio DB|LINear|AUTO
UNIT:RATio?
Specifies units for the input and output of values that represent power ratios. These commands are:
CALCulate:MARKer[1|2|3|4]:FUNCtion:BWIDth|BANDwidth:NDB
DISPlay:WINDow:TRACe:Y:SCALe:AUTO:PDIVision
DISPlay:WINDow:TRACe:Y:SCALe:PDIVision
TRACe:DATA:Y?
This command also sets UNIT:POWer to the corresponding setting.
Remote Operation
HP 71450 Series Commands to HP 86140 Series Equivalents
HP 71450 Series Commands to HP 86140 Series Equivalents
The following table provides a list of the HP 71450 series commands and the SCPI equivalent commands for the HP 86140 series analyzers.
Table

Remote Operation
HP 71450 Series Commands to HP 86140 Series Equivalents
Table

Remote Operation
HP 71450 Series Commands to HP 86140 Series Equivalents
Table
Remote Operation
HP 71450 Series Commands to HP 86140 Series Equivalents
Table

Remote Operation
HP 71450 Series Commands to HP 86140 Series Equivalents
Table

Remote Operation
HP 71450 Series Commands to HP 86140 Series Equivalents
Table

Remote Operation
HP 71450 Series Commands to HP 86140 Series Equivalents
Table

Remote Operation
HP 71450 Series Commands to HP 86140 Series Equivalents
Table

Remote Operation
HP 71450 Series Commands to HP 86140 Series Equivalents
Table

Remote Operation
HP 71450 Series Commands to HP 86140 Series Equivalents
Table

Remote Operation
HP 71450 Series Commands to HP 86140 Series Equivalents
Table

Remote Operation
HP 71450 Series Commands to HP 86140 Series Equivalents
Table

Remote Operation
HP 71450 Series Commands to HP 86140 Series Equivalents

Status Listings
Overview
Overview

Status Listings
Overview
The following table lists the error numbers and their definitions.

Status Listings
Error Reporting Behavior
Error Reporting Behavior
Errors are displayed in an
Status errors are displayed with a descriptive line in the
Warnings and notices are displayed in a status line at the bottom of the screen. They are cleared when any

Status Listings
These error messages and descriptions were copied from the SCPI 1997 Vol- ume 2: Command reference. The sentences enclosed in brackets ???[ ]??? are copied from the error descriptions in the SCPI reference. References are also made to IEEE 488.2 sections for further clarification of events.
Not all the available SCPI error messages were utilized in the optical spectrum analyzer. Only those pertinent to the instrument were implemented.
Note that some of the error messages do not contain descriptions or help mes- sages. These error numbers are reserved for future expansion. This document is subject to further change and development.
Standards related information
Further information on the Standard Commands for Programmable Instru- ments (SCPI) standard is available from the SCPI consortium.
Contact:
Fred Bode, Executive Director
SCPI Consortium
8380 Hercules Drive, Suite P3
La Mesa, CA 91942
Phone: (619)
FAX: (619)
CompuServe Number: 76516,254
Fbode@vxinl.com
For more detailed information on the IEEE 488.2 Standard, order a reference copy.

Status Listings
Contact:
The Institute of Electrical and Electronics Engineers, Inc. 345 East 47th Street
New York, New York
Standard SCPI errors
All positive numbers are
Error/event numbers
The
Command errors
An <error/event number> in the range
occurrence of any error in this class shall cause the command error bit (bit 5) in the event status register (IEEE 488.2, section 11.5.1) to be set.
One of the following events has occurred:
???An IEEE 488.2 syntax error has been detected by the parser. That is, a control-

Status Listings
listening formats or whose type is unacceptable to the device.
???An unrecognized header was received. Unrecognized headers include incorrect
???A Group Execute Trigger (GET) was entered into the input buffer inside of an IEEE 488.2 <PROGRAM MESSAGE>.
Events that generate command errors shall not generate execution errors,
Table

Status Listings
Table


Status Listings
Table
Status Listings
Execution errors
An <error/event number> in the range
One of the following events has occurred:
???A <PROGRAM DATA> element following a header was evaluated by the device as outside of its legal input range or is otherwise inconsistent with the device???s capabilities.
???A valid program message could not be properly executed due to some device condition.
Execution errors shall be reported by the device after rounding and expres- sion evaluation operations have taken place. Rounding a numeric data ele- ment, for example, shall not be reported as an execution error. Events that generate execution errors shall not generate Command Errors,
Table

Status Listings
Table

An <error/event number> in the range

Status Listings
488.2, section 11.5.1) to be set. Events that generate
Table
Query errors
An <error/event number> in the range
One of the following is true:
???An attempt is being made to read data from the output queue when no output is either present or pending.
???Data in the output queue has been lost.
Events that generate query errors will not generate command errors, execu- tion errors, or

errors. This code indicates only that a Query Error as defined in IEEE 488.2, 11.5.1.1.7 and 6.3 has occurred.]

Status Listings
OSA Notices
OSA Notices
System
The OSA system changed a setting and generated a warning that the opera- tion was performed.
Table

Status Listings
OSA Warnings
OSA Warnings
Table

Status Listings
OSA Warnings
Table

Status Listings
OSA Warnings
Table

Status Listings
OSA Warnings
Table
Status Listings
OSA Warnings
Table

Status Listings
OSA Warnings
Table

Status Listings
OSA Warnings
Table

Status Listings
OSA Warnings
Table

Status Listings
OSA Warnings
Table

Status Listings
OSA Warnings
Table

Status Listings
OSA Warnings
Table

Status Listings
Table


Status Listings
Table

Status Listings
Table


Status Listings
OSA Status Errors
OSA Status Errors
Table

Status Listings
OSA Errors
OSA Errors
Table

Status Listings
OSA Errors
Table

Status Listings
Firmware Errors
Firmware Errors
Table

Status Listings
Firmware Errors

6
Cleaning Connections for Accurate Measurements
Reference

Reference
Options and Accessories
Options and Accessories
Table
Certificate of Calibration (included)
Alternative Connector Interface:
Reference
Options and Accessories
Table
a.Contact your local field representative for availability.
b.Always use HP paper. Use of other thermal paper may degrade image quality and damage the printer head.
c.HP N1031A BenchLink software allows transfer of measurement results over an
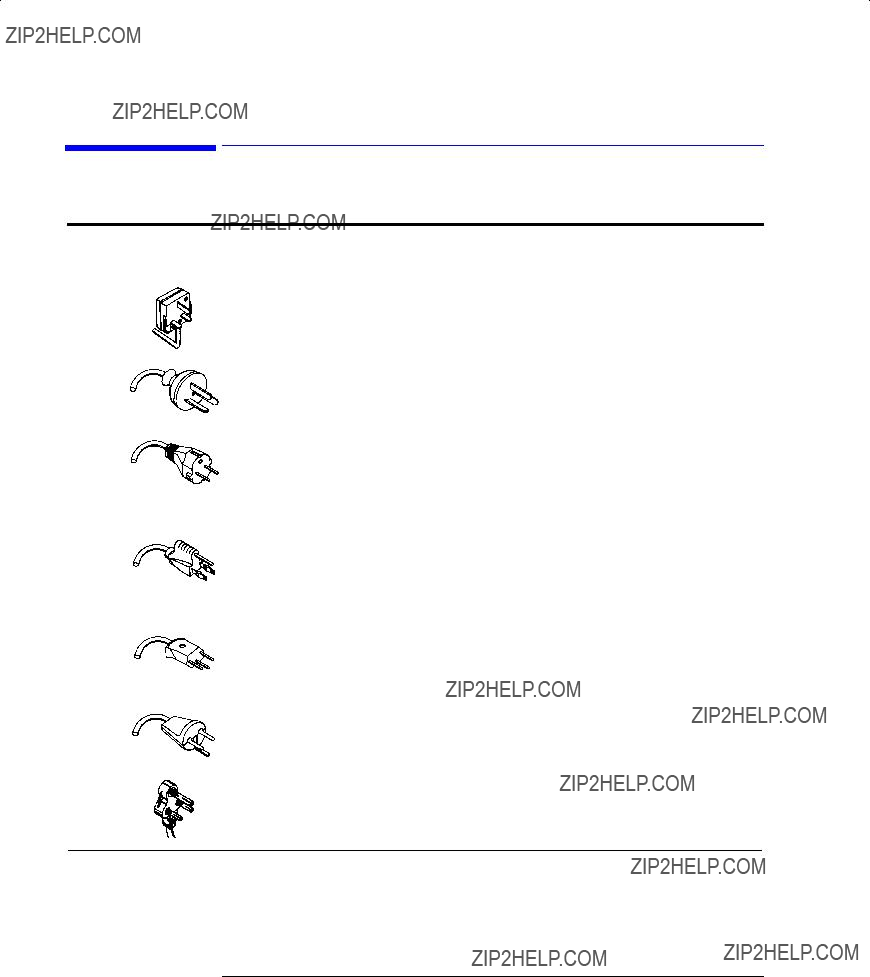
Reference
AC
AC
India
*Part number shown for plug is the industry identifier for the plug only. Number shown for cable is the HP part number for the complete cable including the plug.

*Part number shown for plug is the industry identifier for the plug only. Number shown for cable is the HP part number for the complete cable including the plug.
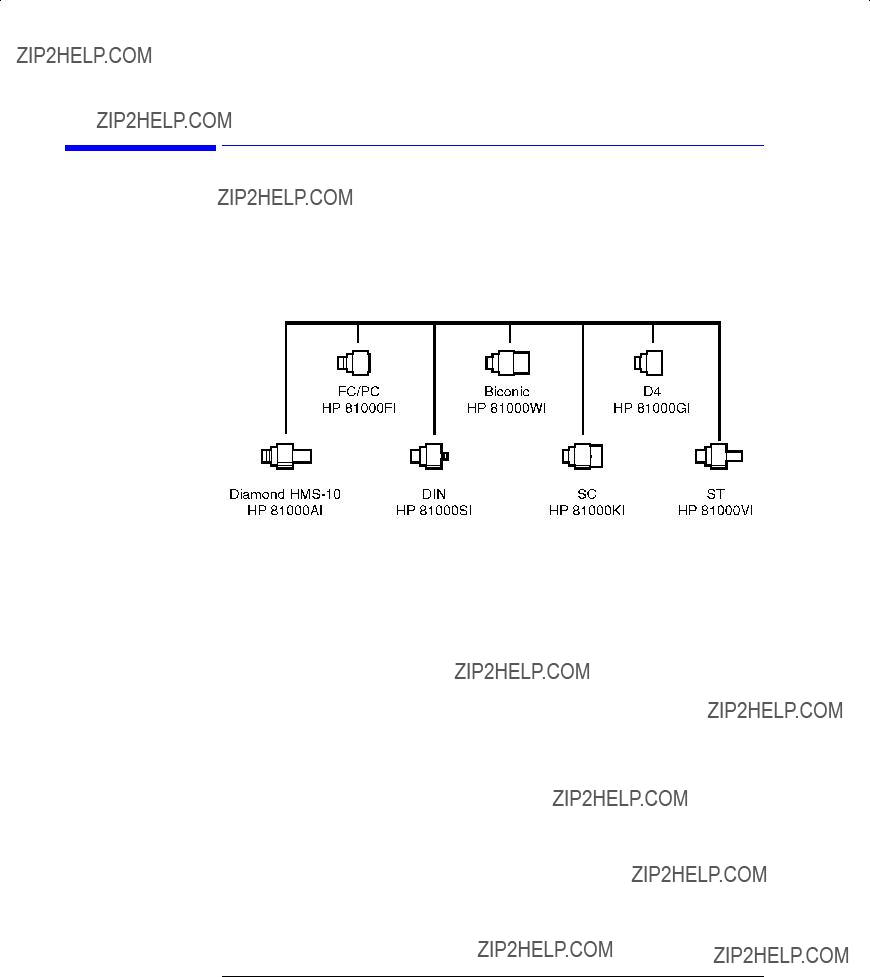
Reference

Reference
Printer Head Cleaning Procedure
Printer Head Cleaning Procedure
W A R N I N G
Lint from normal use of the printer may eventually collect on the printer head and degrade print quality. Use the procedure provided in this section to clean the printer head.
This servicing procedure is for use by qualified personnel only. To avoid electrical shock, do not perform this procedure unless you are qualified to do so.
C A U T I O N
Station
Electrostatic discharge (ESD) can damage or destroy the printer. Therefore, this procedure must always be performed at a
Figure
Table
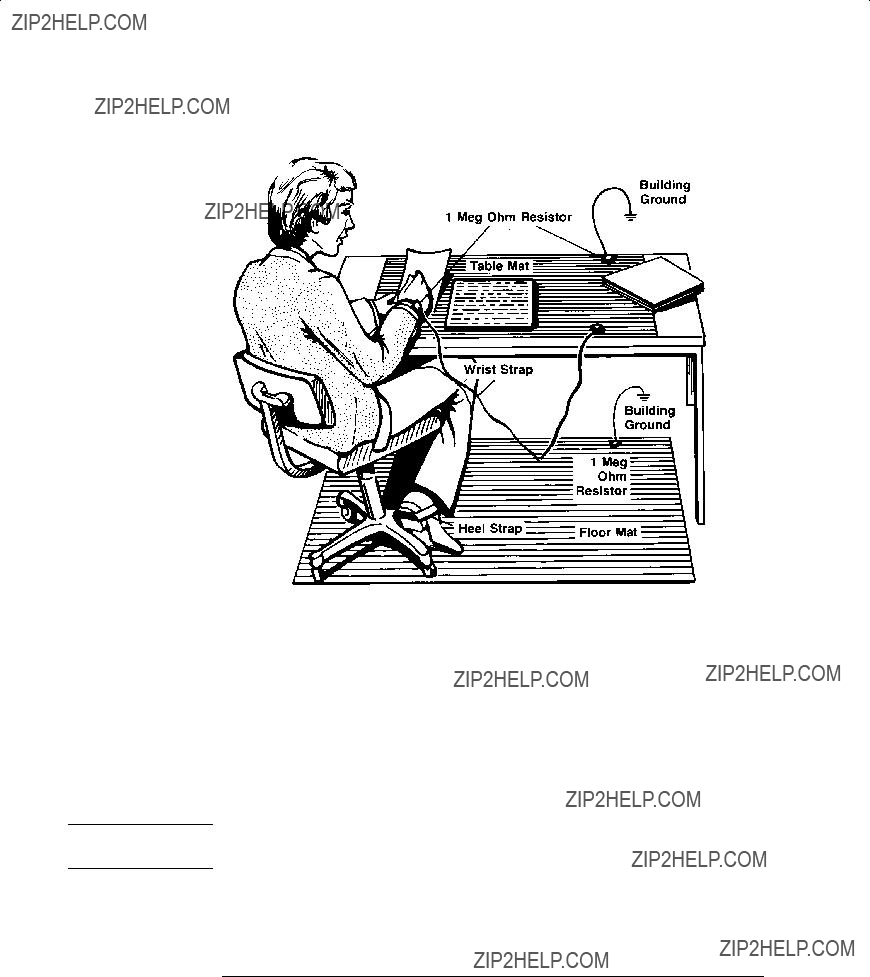
Procedure
C A U T I O N
Reference
Printer Head Cleaning Procedure
Figure
1Turn off the HP
2Place the instrument at a
3Use a coin or screwdriver to open the printer door that is located on the top of the instrument.
Avoid dropping the coin or screwdriver, used to open the printer door, into the printer assembly.
4Lift up the paper latch as shown in the following diagram, and remove the paper.

Reference
Printer Head Cleaning Procedure
5Unscrew the retaining screw that secures the
6Lift the printer head lever to the vertical position. Then, tilt the lever towards the instrument???s rear panel to rotate the printer head up.
7Clean the printer head using a cotton swab and isopropyl alcohol.
8After the printer head has thoroughly dried, use the printer head lever to return the printer head to its original position.
9Replace and secure the
10Replace the printer paper, and close the printer access door.

Reference
Cleaning Connections for Accurate Measurements
Cleaning Connections for Accurate
Measurements
Advances in measurement capabilities make connectors and connection tech- niques more important than ever. Damage to the connectors on calibration and verification devices, test ports, cables, and other devices can increase downtime and expense.
Refer to ???Cleaning Optical Connectors??? on page
Many times an instrument must be serviced to replace a damaged connector. Thousands of dollars and hours, or even days, of lost time can be avoided if better care is given to the
What you???ll find in this section

Reference
Cleaning Connections for Accurate Measurements
Choosing the Right Connector
A critical, but often overlooked, factor in making a good lightwave measure- ment is the selection and care of the
The system tolerance for reflection and insertion loss must be known when selecting a connector from the wide variety currently available. Some items to consider when selecting a connector are:
???How much insertion loss can be allowed?
???Will the connector need to make multiple connections? Some connectors are better than others, and some are very poor for making repeated connections.
???What is the reflection tolerance? Can the system take reflection degradation?
???Is an
???Is repeatability tolerance for reflection and loss important? Do your specifica- tions take repeatability uncertainty into account?
???Will a connector degrade the return loss too much, or will a fusion splice be re- quired? For example, many DFB lasers cannot operate with reflections from connectors. Often as much as 90 dB isolation is needed.
Over the last few years the FC/PC style connector has emerged as the most popular connector for
However, many instrument specifications require tighter tolerances than most connectors, including the FC/PC can deliver. These instruments cannot toler- ate connectors with the large

Reference
Cleaning Connections for Accurate Measurements
Universal adapters to Diamond HMS_10.
The
Staking Groove (Fixing oper.)
Secondary Staking (Active C entering)
Nic kel Silver (Cu/Ni/Zn) (Soft center)
Tungsten Carbide
(Hard Case)
125 um Fiber (Centered to about
0.2 microns)
Figure
The nickel silver allows an active centering process that permits the glass fiber to be moved to the desired position. This process first stakes the nickel silver to fix the fiber in a
The soft core, while allowing precise centering, is also the chief liability of this connector. The soft material is easily damaged. Care must be taken to mini- mize excessive scratching and wear. While minor wear is not a problem if the glass face is not affected, scratches or grit can cause the glass fiber to move out of alignment. Also, if unkeyed connectors are used, the nickel silver can be pushed onto the glass surface. Scratches, fiber movement, or glass contamina- tion will cause loss of signal and increased reflections, resulting in poor return loss
Reference
Cleaning Connections for Accurate Measurements
Inspecting Connectors
Because
Figure
Figure

Reference
Cleaning Connections for Accurate Measurements
Figure
Repeated connections made without removing loose particles, or using improper cleaning tools can lead to physical damage of the glass fiber endface, as shown in Figure
Figure
The cure for these problems is disciplined connector care. as described in the following list and in ???Cleaning Connections for Accurate Measurements??? on page

Reference
Cleaning Connections for Accurate Measurements
Guidelines
Use the following guidelines to achieve the best possible performance when making measurements on a
???Keep connectors covered when not in use.
???Use dry connections whenever possible.
???Never use metal or sharp objects to clean the connector and never scrape the connector.
???Avoid matching gel and oils.
While these often work well on first insertion, they are great dirt magnets. The oil or gel grabs and holds grit that is then ground into the fiber endface. Also, some early gels were designed for use with the FC,
???When inserting a
???Avoid over tightening connections.
Unlike common electrical connections, tighter is not better. The purpose of the connector is to bring the endfaces of two fibers together. Once they touch, tightening only causes a greater force to be applied to the delicate endfaces. With some connectors, the end can set itself
???Keep connections covered when not in use.

Reference
Cleaning Connections for Accurate Measurements
???Use fusion splices on the more permanent critical nodes. Choose the best con- nector possible. Replace connecting cables regularly. Frequently measure the return loss of the connector to check for degradation, and clean every connec- tor, every time.
All connectors should be treated like the
Measuring insertion loss and return loss
Consistent measurements with your lightwave equipment are a good indica- tion that you have good connections. Since return loss and insertion loss are key factors in determining optical performance they can be used to determine connector degradation. A smooth, polished fiber end should produce a good return loss measurement. The quality of the polish establishes the difference between the ???PC??? (physical contact) and the ???Super PC??? connectors. Most connectors today are physical contact which make
If you test your cables and accessories for insertion loss and return loss upon receipt, and retain the measured data for comparison, in the future you will be able to tell if any degradation has occurred. Typical values are less than 0.5 dB of loss, and sometimes as little as 0.1 dB of loss with high performance con- nectors. Return loss is a measure of reflection: the less reflections the better. The larger the return loss, the smaller the reflection. The most physically con- tacting connectors have return losses better than 50 dB, although 30 to 40 dB is more common.

C A U T I O N
C A U T I O N
Reference
Cleaning Connections for Accurate Measurements
Visual inspection of fiber ends
Visual inspection of fiber ends can be helpful. Contamination or imperfections on the cable end can be detected, as well as cracks or chips in the fiber itself. Use a microscope with 100?? to 200?? magnification to inspect the entire end face for contamination, raised metal, or dents in the metal as well as any other imperfections. Inspect the fiber for cracks and chips. Visible imperfections not touching the fiber core may not affect performance, unless the imperfections keep the fibers from contacting.
Cleaning Optical Connectors
The connectors on the instrument are not easily cleaned. Before connecting cables to the lightwave instrument, it is very important they are cleaned following the procedures in this section.
The procedures in this section provide the proper steps for cleaning fiber- optic cables and HP universal adapters. The initial cleaning, using alcohol as a solvent, gently removes any grit and oil. If a

Reference
Cleaning Connections for Accurate Measurements
Table
Table
1Apply pure isopropyl alcohol to a clean
2Clean the ferrules and other parts of the connector while avoiding the end of the fiber.
3Apply isopropyl alcohol to a new clean
4Clean the fiber end with the swab or lens paper.
Do not scrub during this initial cleaning because grit can be caught in the swab and become a gouging element.
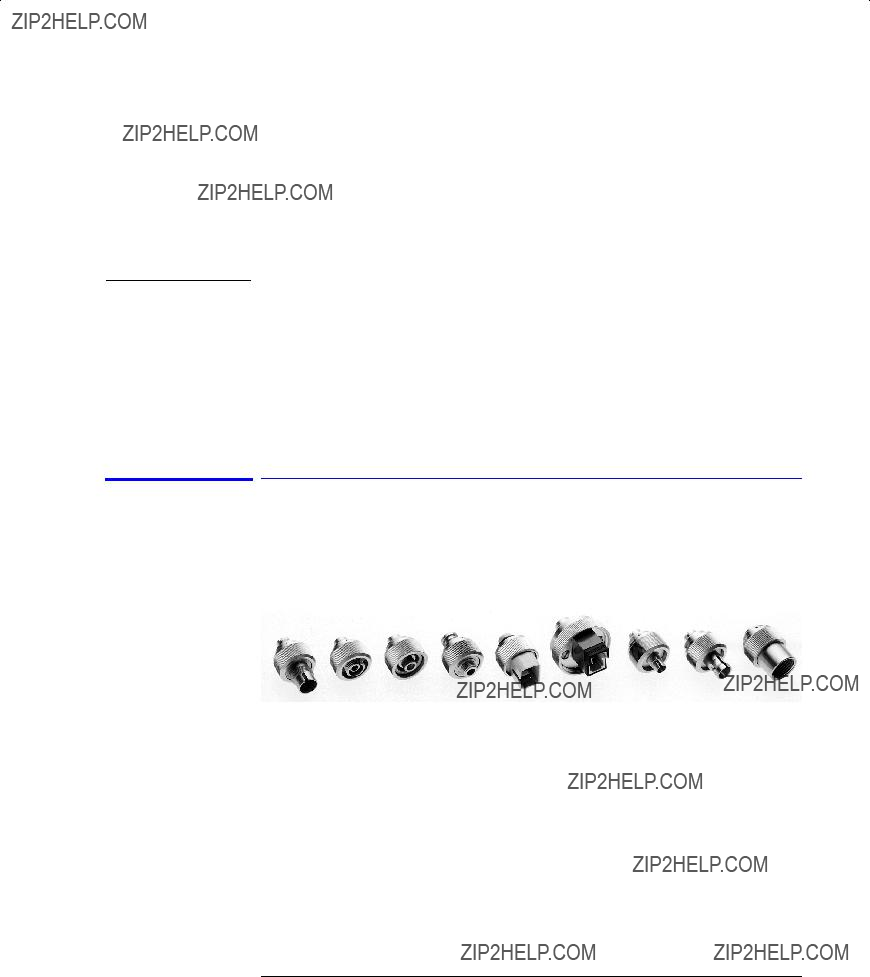
Reference
Cleaning Connections for Accurate Measurements
5Immediately dry the fiber end with a clean, dry,
6Blow across the connector end face from a distance of 6 to 8 inches using filtered, dry, compressed air. Aim the compressed air at a shallow angle to the fiber end face.
Nitrogen gas or compressed dust remover can also be used.
7As soon as the connector is dry, connect or cover it for later use.
If the performance after the initial cleaning seems poor, try cleaning the con- nector again. Often a second cleaning will restore proper performance. The second cleaning should be more arduous, with a scrubbing action.
Cleaning an adapter
The
Figure
1Apply isopropyl alcohol to a clean foam swab.
Cotton swabs can be used as long as no cotton fibers remain after cleaning. The foam swabs listed in the introduction to this section are small enough to fit into adapters.
Although foam swabs can leave filmy deposits, these deposits are very thin, and the risk of other contamination buildup on the inside of the adapters greatly outweighs the risk of contamination by foam swabs.
2Clean the adapter with the foam swab.


Reference
Returning the Instrument for Service
Returning the Instrument for Service
The instructions in this section show you how to properly package the instru- ment for return to a
If the instrument is still under warranty or is covered by an HP maintenance contract, it will be repaired under the terms of the warranty or contract (the warranty is at the front of this manual). If the instrument is no longer under warranty or is not covered by an HP maintenance plan,
When an instrument is returned to a
When describing the failure, please be as specific as possible about the nature of the problem. Include copies of additional failure information (such as the instrument failure settings, data related to instrument failure, and error mes- sages) along with the original cal data disks and the instrument being returned.
Please notify the service office before returning your instrument for service. Any special arrangements for the instrument can be discussed at this time. This will help the HP service office repair and return your instrument as quickly as possible.
Preparing the instrument for shipping
1Write a complete description of the failure and attach it to the instrument. Include any specific performance details related to the problem. The following

C A U T I O N
C A U T I O N
Reference
Returning the Instrument for Service
information should be returned with the instrument.
???Type of service required.
???Date instrument was returned for repair.
???Description of the problem:
???Whether problem is constant or intermittent.
???Whether instrument is
???Whether instrument is
???Instrument settings required to reproduce the problem.
???Performance data.
???Company name and return address.
???Name and phone number of technical contact person.
???Model number of returned instrument.
???Full serial number of returned instrument.
???List of any accessories returned with instrument.
???The original cal data disks.
2Cover all front or
Cover electrical connectors to protect sensitive components from electrostatic damage. Cover optical connectors to protect them from damage due to physical contact or dust.
Instrument damage can result from using packaging materials other than the original materials. Never use styrene pellets as packaging material. They do not adequately cushion the instrument or prevent it from shifting in the carton.
They may also cause instrument damage by generating static electricity.
3Pack the instrument in the original shipping containers. Original materials are available through any
???Wrap the instrument in antistatic plastic to reduce the possibility of damage caused by electrostatic discharge.
???For instruments weighing less than 54 kg (120 lb), use a
???The carton must be large enough to allow approximately 7 cm (3 inches) on all sides of the instrument for packing material, and strong enough to accom- modate the weight of the instrument.
???Surround the equipment with approximately 7 cm (3 inches) of packing ma- terial, to protect the instrument and prevent it from moving in the carton. If packing foam is not available, the best alternative is
Reference
Returning the Instrument for Service
Sealed Air Corporation (Commerce, California 90001). Air Cap looks like a plastic sheet filled with air bubbles. Use the pink (antistatic) Air Cap??? to reduce static electricity. Wrapping the instrument several times in this ma- terial will protect the instrument and prevent it from moving in the carton.
4Seal the carton with strong nylon adhesive tape.
5Mark the carton ???FRAGILE, HANDLE WITH CARE???.
6Retain copies of all shipping papers.
Reference
Before returning an instrument for service, call the HP Instrument Support Center at (800)
U.S. FIELD OPERATIONS

Taiwan
(886 2)

Reference

7
Specifications and Regulatory
Information

Specifications and Regulatory Information
Specifications and Regulatory Information
Specifications and Regulatory Information
This chapter contains specifications and characteristics for HP 86140 series optical spectrum analyzers.
The specifications in this chapter apply to all functions autocoupled over the temperature range 0?? C to +55?? C and relative humidity < 95% (unless other- wise noted). All specifications apply after the instrument???s temperature has been stabilized after 1 hour continuous operation and the
Calibration Cycle This instrument requires periodic verification of performance. The instrument should have a complete verification of specifications at least once every two years.

Specifications and Regulatory Information
Definition of Terms
Definition of Terms
Characteristics The distinction between specifications and characteristics is described as fol- and specifications lows:


Specifications and Regulatory Information
Specifications
Specifications

Specifications and Regulatory Information
Specifications

Specifications and Regulatory Information
Specifications
a.With applied input fiber 9/125 ??? m.
b.Temperature range 20?? to 30?? C.
c.Resolution of 10 nm is available in first order only.
d.Sensitivity is defined as signal value >6 ?? RMS noise value.
e.Temperature range 0?? to 30?? C.
f.For resolution ??? 0.1 nm.
g.Excluding amplitude errors at low power levels due to noise.
h.Between 1350 nm and 1420 nm absorption of light by atmospheric moisture affects flatness.
i.For resolution ??? 0.2 nm.
j.At room temperature.
k.Excluding multiple order grating response.
l.Depends on the quality of the attached connector.

Specifications and Regulatory Information
Specifications
General Specifications
a. Floppy disk and printer operating temperature range 0?? C to 45?? C.
Option 004/005 EELED Sources

Specifications and Regulatory Information
Regulatory Information
Regulatory Information
???Laser Classification: This product contains an FDA Laser Class I (IEC Laser Class 1) laser.
???This product complies with 21 CFR 1040.10 and 1040.11.
Notice for Germany: Noise Declaration
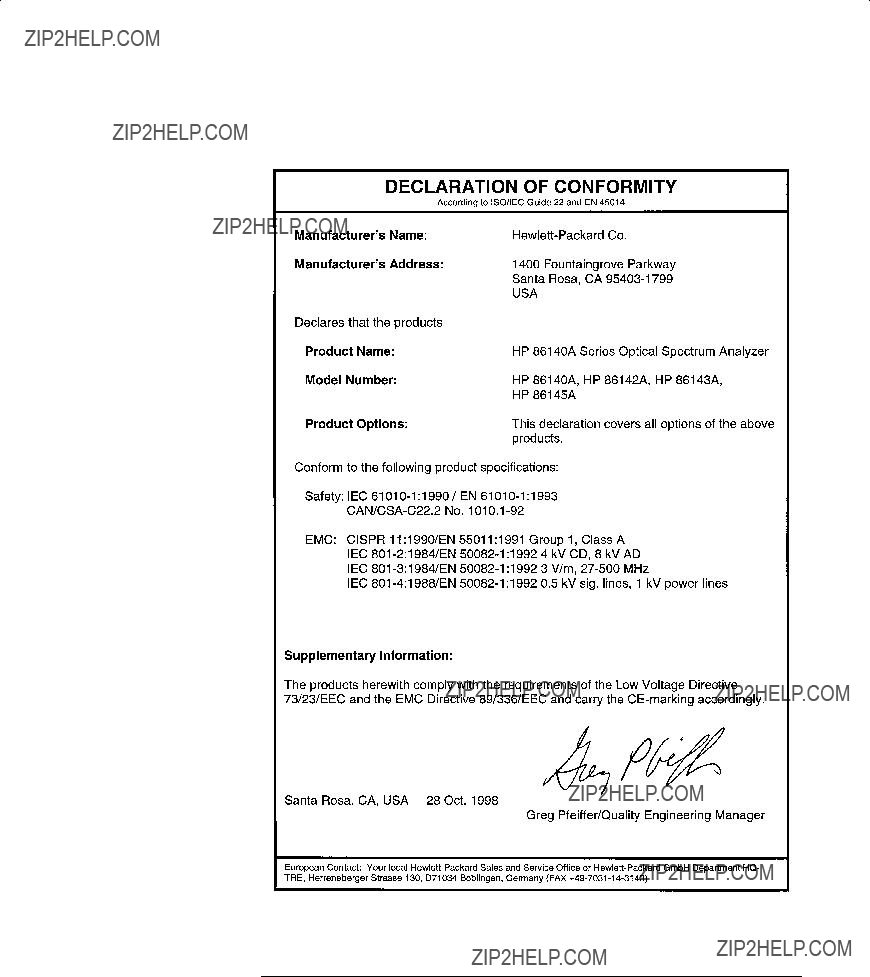
Specifications and Regulatory Information
Regulatory Information

Specifications and Regulatory Information
Regulatory Information

Index
A
absolute accuracy,
connecting,
accuracy absolute/differential,
active
area, moving,
marker, automatic measurement,
Active Marker.... softkey,
ADC trigger softkeys,
adding parameters in commands,
Adv Service Functions.... softkey,
automatic,
All Math Off softkey,
accuracy,
calibration. See power calibration units, setting,
vertical scale,
amplitude settings,
peak to reference level,
vertical amplitude scale,
Applications menu,
zero, setting,
Auto Align key,
Auto Measure Setup.... softkey,
alignment,
automeasure, defaults,
B
backup internal memory,
interpolation, setting,
Bandwidth not found message,
ADC trigger,
sweep time,
video bandwidth,
C
CALCulate subsystem commands,
amplitude See calibration, power cycle,
date, viewing,
wavelength,
care of fiber optics, iii,
case sensitivity in commands,
with markers,

Index

error messages
Bandwidth not found,
Exchange Menu.... softkey,
external trigger,
F
factory
power calibration date,
wavelength calibration date,
adapters,
connectors, covering,
File menu,
firmware revision, displaying,
floppy disk
deleting a file,
FORMat subsystem commands,
HP 86143/5,
Index
G
Gated softkey,
grating order mode, setting,
H
HCOPy subsystem commands,
Hold <trace> softkey,
HP 86140/2 front and rear panels,
I
IEC Publication 1010, iii IEEE 488.2 standard,
insertion loss, connectors,
addressing over
powering up,
integrate between line markers,
internal memory,
Internal softkey,
interpolation, normal/delta marker,
L
laser classification,

Index
Index
OPTICAL INPUT connector,
Options menu,
OSA
Backup Utility screen,
Restore Utility screen,
OSA Extended State.... softkey,
output
queue,
overview of the front panel,
P
package contents,
parameters, adding command,
end of each sweep, setting,
using markers,
PEAK SEARCH softkey,
Pit Search softkey,
pit search, performing,
cords,
Power Cal Setup.... softkey,
amplitude, setting,
Power On State softkey,
changing the paper,
head cleaning,
Printer Setup.... softkey,
display,
OSA State panel,
command trees,
programming examples,
initialization/simple measurement,
total power measurement,
Q
R
rear panel
HP 86140/2,
HP 86143/5,
Recall Menu.... softkey,
with markers,
remote commands/front panel functions,

Index
remote interface automatic alignment,
automatic measurement,
Repeat Sweep softkey,
Res BW softkey,
restore internal memory,
S
safety information, iii Save Menu.... softkey,
deleting a file,
internal memory backup/restore,
recalling in Fast Recall mode,
saving in Fast Save mode,
Save/Recall menu,
equivalent to HP 71450 command,
search between line markers,
Search Mode.... softkey,
semicolon, use in commands,
optimizing,
See also sweep time, video bandwidth Sensitivity softkey,
service,
Service Menu.... softkey,
settings conflict error message,
Setup panel overview,
shipment, checking package content,
short form commands,
Show Notices/Errors/Warnings softkeys,
Single Sweep softkey,
SOURce subsystem commands,
Span softkey,
span, wavelength,
Start WL softkey,
accessories,
STATus subsystem commands,
Stop WL softkey,
between line markers,
indicator light,
Sweep Limit softkey,
See also sensitivity, video bandwidth Sweep Time softkey,
Synch Out softkey,
active area, moving,

Index
displaying notices/errors/warnings,
grating order mode,
power calibration,
set time/date,
wavelength calibration,
SYSTem subsystem commands,
T
time
displaying,
title, displaying,
active, setting,
Trace Integ softkey,
TRACe subsystem commands,
active trace,
math functions,
X- and
Trigger Delay softkey,
tuning repeatability,
U
UNIT subsystem commands,
Update <trace> softkey,
power cal date,
wavelength calibration date,
V
vertical
amplitude scale,
See also sensitivity, sweep time Video BW softkey,
View <trace> softkey,
W
warnings, displaying,
calibration,
calibration, setting values,
limits, setting,
peak,
span, setting,

Index
start/stop,
Wavelength Cal Setup.... softkey,
center wavelength,
centering the peak wavelength,
span,
start wavelength,
Wavelength Limit softkey,
white space characters in commands,
X
Y
Z
ZERO NOW softkey,
zero span,
zeroing the instrument,