POWER LEADER TM
PMCS 6.11a Interface Toolkit
Installation Guide
GE Power Management Control System 6.11a
POWER LEADER TM
PMCS 6.11a Interface Toolkit
Installation Guide
GE Power Management Control System 6.11a
Notice
The information contained in this document is subject to change without notice. GE makes no warranty of any kind with regard to this material, including, but not limited to, the implied warranties of merchantability and fitness for a particular purpose. GE shall not be liable for errors contained herein or incidental consequential damages in connection with the furnishing, performance, or use of this material.
This document contains proprietary information which is protected by copyright. All rights are reserved. No part of this document may be photocopied or otherwise reproduced without consent of GE.
Copyright ??2000 - 2002 by GE. Published in a limited copyright sense, and all rights, including trade secrets, are reserved.
Document Edition - First 5/96 Second 5/97 Third 1/98 Fourth 06/98 Fifth 03/99 Sixth 07/99 Seventh 03/00 Eighth 10/00 Ninth 02/01 Tenth 06/01 Eleventh 01/02
The following are products of General Electric Company:
Electronic Power Meter 3710 , Electronic Power Meter 3720, Electronic Power Meter 7300, Electronic Power Meter 7330, Electronic Power Meter 7500, Electronic Power Meter 7600, and Electronic Power Meter 7700 are products of Power Measurement Limited.
Multilin 269+ Motor Management Relay?? is a registered trademarks of Multilin Inc., and Multilin SR489 Generator Management Relay??? and Multilin SR745 Transformer Management Relay??? are trademarks of Multilin Inc.
Microsoft, Microsoft Access, Microsoft Excel, Microsoft PowerPoint, Microsoft Visual Basic, and
Wonderware is a registered trademark of WonderWare Corporation. Wonderware InTouch and NetDDE are trademarks of WonderWare Corporation.
US Pat Nos 5,768,148; 5,764,155; 5,862,391

Introduction
Welcome
The PMCS Interface Toolkit is a POWER LEADER Power Management Control System (PMCS) version 6.11a tool that provides a custom toolkit to efficiently create flexible, accurate, and friendly user interfaces to your power management data. With the PMCS Wizards (accurate graphical representations of power management devices and other commonly encountered objects), you can create applications to provide a customized interface that accurately represents physical, electrical, and geographical plant layouts. The wizards can significantly cut new system development time, providing results in less than an hour.
The PMCS Interface Toolkit allows you to create
The Toolkit, which consists of the Wonderware InTouch development environment coupled with GE???s wizards, is easy to use, taking advantage of
Here???s what you???ll find in this guide:
???Chapter 2 explains the kinds of PMCS Wizards, their use and configuration ??? Small Faceplate wizards, Large Faceplate wizards, Tabular Data Screen wizards, One- Line wizards, Elevation wizards, and Floor Plan wizards.
???Chapter 3 illustrates the use of the GE wizards described in Chapter 2 to create animated displays of the facility floor plan, switchgear elevations, and system one- line diagrams.
???Chapter 4 gives an example of application development, using the wizards described in Chapters 2 and 3 to create an actual PMCS application.
???Chapter 5 describes the functions available with each of the GE Large Faceplate wizards. These wizards are accurate graphical representations
1

of power management devices, complete with working controls that are linked to the corresponding devices in your facility.
???Chapter 6 describes the Tabular Data wizards. These wizards list the data and setpoints of power management devices in a tabular format. Simply point and click to select the appropriate tab of information to display and view the related data.
The examples and references in this guide enable you to create custom interfaces for your PMCS system, and allow you to access power management data in the way that best suits you.
How should I use this manual?
How you use this book depends on your level of expertise with Wonderware
InTouch. Consult the table below to determine where you should start.
Conventions
You will find this book easy to use if you look for these simple conventions:
???Boldface type indicates the name of an item you need to select.
???Monospace type indicates an example or text that is displayed on the screen.
???UPPERCASE type indicates a file name, command name, or acronym.
About the Interface Toolkit
The Interface Toolkit consists of the Wonderware InTouch development environment and a special set of wizards developed for use with the power management devices supported by PMCS.
Installation
To install the Interface Toolkit from the
When InTouch is successfully installed, you must add the PMCS wizards to InTouch???s library of available wizards.
To add the wizards to InTouch, start InTouch and enter Development mode. Pull down the Special menu and select Configure > Wizard.
3

From the InTouch Configuration menu, select Install Wizards.
The Wizard Installation dialog displays two list boxes, showing the currently installed wizards and the wizards available for installation. Select the desired wizards from the bottom box and click Install. When the installation is complete, click Done.
Exit from the InTouch Configuration dialog box by clicking OK. The PMCS wizards should now be loaded and ready for use.

Using and Configuring
PMCS Wizards
About the Wizards
The wizards contained in the PMCS Interface Toolkit allow you to quickly build accurate and friendly user interfaces with InTouch. In addition to the various wizards standard with InTouch development systems, the Interface Toolkit provides six types of powerful GE wizards:
???GE Small Faceplates
???GE Large Faceplates
???GE Tabular Screens
???GE
???GE Elevation Wizards
???GE Floor Plan Wizards
The
1.From InTouch, either create a new window or open an existing window to modify.
2.Select the wizards button  from the floating toolbars. The Wizard Selection dialog box pops up.
3.Select the class of wizard from the list of wizards on the left side of the Wizard Selection dialog. Several classes contain too many devices to fit on one palette and have been broken up into several palettes; for example; Small Faceplates 1 and Small Faceplates 2.
4.
5.Once the wizard has been placed,
The remainder of this chapter is devoted to describing and illustrating the various kinds of wizards included in the PMCS Interface Toolkit.
5

Small Faceplate Wizards
Usage
The Small Faceplate wizards are
Configuration
In development mode, after placing the Small Faceplate,

Enter the name of the window to open when the icon is clicked on during runtime.
7

Large Faceplate Wizards
Usage
Large Faceplate wizards are

Configuration
Place the Large Faceplate wizard into an open window, then
The figure shown below is the dialog for a typical wizard. Some wizards have additional features which may be configured. See the section titled Features of GE Large Faceplate Wizards for more details.
Enter the unique
Enter the application name of the PMCS DDE Server (GE32MODB or GE32MTCP) for most PMCS devices; ION_LINK for EPM 7700 devices).
Enter the minimum security level for enabling remote command functions.
Enter the name of the window to open when the device display is clicked on during runtime.
You can move and resize Large Faceplate wizards as desired.
Special Considerations
The button controls on the
EPM 7700
The EPM 7700 Large Faceplate Dialog box contains an extra field, which must be completed during configuration. The Node Name field requires that you enter the name of the computer running the Communications Server that connects to this particular device. Depending on the configuration of the EPM7700 network, this can be either the Primary node computer, or a computer setup as a "Full Station" Secondary node. Refer to
9

Also, the Application Name field must be completed as ION_LINK rather than GE32MODB or GE32MTCP for the EPM7700 device. The ION LINK program is installed during initial PMCS 6.11a setup if the EPM7700 software option is selected.
When configuring Wizards on Secondary nodes, the Application Name field entry does not follow the PMCS wizard convention of ???\\RemoteComputer\ION_LINK???. EPM7700 Secondary nodes run a local copy of the ION LINK server, thus the application name for EPM7700 Large Faceplate wizards is always ???ION_LINK??? whether the wizard is installed on the Primary node or a Secondary node. The Node Name entry determines if the wizard is on a Secondary node.
Finally, the EPM 7700 device type requires special InTouch scripting for the large faceplate wizard. Refer to the section at the end of this chapter titled Special Scripting Considerations for the EPM 7700.

Tabular Data Screen Wizards
Usage
Tabular Data Screen wizards contain organized, comprehensive, tabular layouts of device parameters including additional configuration and remote control features. Depending on the device, there may be multiple
Each Tabular Data Screen wizard contains buttons for activating the help file, trend window, setup window (if applicable), Event Logger, Waveform Capture, and for closing the window.
You can move and resize Tabular Data Screen wizards as desired.
Configuration
In development mode, after placing a wizard into an open window,
11

Enter the unique eight- character name matching the appropriate Topic in the PMCS DDE Server.
EPM 7700
Use the Group Name field to logically group devices, if desired. Enter the name of the group to which the device belongs.
Enter the application name of the PMCS DDE Server (GE32MODB or GE32MTCP).
Enter the minimum security level for enabling remote command and setup functions.
Enter the name of the window to be opened when the Trend button is clicked on during runtime.
Enter the name of the window to be opened when the Setup button is clicked on during runtime.
The EPM 7700 Tabular Data Dialog box is slightly different from the other PMCS device types, containing two extra fields and requiring minor differences in configuration. The Tabular Data Dialog for the EPM 7700 is shown below, followed by the special configuration requirements.
The Node Name field requires that you enter the name of the computer running the Communications Server that connects to this particular device. Depending on the configuration of the EPM7700 network, this can be either the Primary node computer, or a computer setup as a ???Full Station??? Secondary node. Refer to DEH-
40035, the GE 7700 Gateway Users Guide, and
Also, the Application Name field must be completed as ION_LINK rather than GE32MODB or GE32MTCP for the EPM7700 device. The ION LINK program is installed during initial PMCS setup if the EPM7700 software option is selected.
When configuring Wizards on Secondary nodes, the Application Name field entry does not follow the PMCS wizard convention of ???\\RemoteComputer\ION_LINK???. EPM7700 Secondary nodes run a local copy of the ION LINK server, thus the application name for EPM7700 Tabular Data Wizards is always ???ION_LINK??? whether the wizard is installed on the Primary node or a Secondary node. The Node Name entry determines if the wizard is on a Secondary node.
The Gateway Name field must be completed with GE77GTWY, the application name of the GE 7700 Gateway Server program. When configuring the EPM7700 Tabular wizard on a Secondary node, the Gateway Name does follow the PMCS wizard convention of ???\\RemoteComputer\GE77GTWY??? in the Gateway Name field, where ???RemoteComputer??? is the name of the PC where the GE 7700 Gateway application is running ??? the Primary Node. The following example shows a Tabular Data Dialog box as it would appear when configuring a Tabular Data wizard on a Secondary node. The Node Name field contains the name of the Primary Node computer, the Application Name field is ION_LINK (as it is for ALL EPM7700 wizards on ANY node) and the Gateway Name field points to the GE 7700 Gateway Server running on the Primary Node PC.
Finally, the EPM 7700 device type requires special InTouch scripting for the tabular data screen wizard. Refer to the section at the end of this chapter titled Special Scripting Considerations for the EPM 7700.
Refer to
369 Motor Management Relay
The 369 Motor Management Relay offers an optional Remote RTD module, which can provide support for up to 12 additional RTDs. Accordingly, the 369 Tabular
13

Data Dialog box has an extra field for indicating when the RRTD option is installed. Be sure to select the correct RRTD option when completing the 369's Tabular Data Dialog window. If you are not planning to use an RRTD module with your relay, select the "No" button. This minimizes the number of I/O tags created by the wizard, providing better performance.

Universal Relay
The Universal Relay device comes in several different models, and each model supports different capabilities, which are reflected by the various tabs available for each model. When configuring a Universal Relay device, you first select the UR Model, then choose which tabs will be displayed for the particular device.
The UR devices are also capable of communicating with a different type of PMCS DDE Server than the other PMCS Advanced Wizards. By selecting the UCA/MMS checkbox, you indicate that you wish the UR wizard to retrieve its data for display from the MMS Server whose name is entered in the Application Name field.
Complete the Application Name field; typically GE32MODB or GE32MTCP.
Special Note:
The UCA/MMS is not supported in this version. So don???t Check this checkbox.
Select the Model of UR which you are configuring. This determines the contents of the Available Tabs list.
Highlight the tabs you wish to display on the Tabular Data Screen wizard. Use the control key to select multiple tabs.
15

Usage
You can use
???Horizontal and Vertical Meter wizards display another window, such as a
???Transformer, Fuse, Ground Symbol, and Motor Symbol wizards have a discrete
???Horizontal and Vertical Relay wizards also have discrete
???Horizontal and Vertical Switch wizards have four discrete animations; two are color changes indicating the On/Off state of the device and two are used for a
???Circuit Breaker wizards have two discrete
???Lockout/Tagout symbols have discrete visibility animations for various tags. Refer to the section Using and Configuring PMCS Wizards: Lockout/Tagout Wizard for more information.
Configuration
In development mode, after placing the
???Line Size is a number between 1 and 20 that sets the pixel width of the lines in the wizard.
???Size configuration consists of three radio buttons (Small, Medium, and Large) that determine the overall size of the wizard on the screen.
Use the
Meter
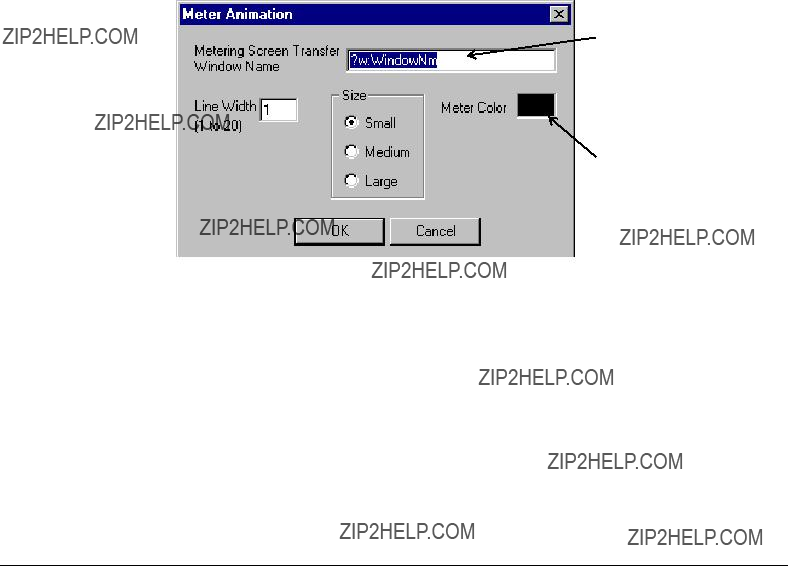
After placing a meter wizard in a window,
Enter the name of the window to open when the icon is clicked on during runtime.
Select the color of the meter wizard.
17

Transformer, Fuse, Ground, and Motor
Wizards
After placing a Fuse, Ground, or Motor wizard in a window,
Enter the name of the InTouch discrete tag that determines the state of the line colors during runtime.
Specify the colors of the lines when the Bus Status is On and Off. The wizard is displayed in the On Color when the Bus Status Tagname = 1, Off Color when the Bus Status Tagname = 0.
The dialog box for the Transformer wizard has an extra check box that specifies either an
Click on the check box to specify an

Horizontal and Vertical Relay
After placing a Horizontal or Vertical Relay wizard in a window,
Enter the name of the InTouch discrete tag that determines the color of the line to the right (or top) of the relay symbol during runtime.
Enter the name of the InTouch discrete tag that determines the color of the line to the left (or bottom) of the relay symbol during runtime.
Click the check box to display a slash through the contacts (normally closed contact).
Specify the colors of the wizard elements when the contact status and connection discrete tags are On or Off.
Enter the name of the InTouch discrete tag that determines the color of the relay symbol during runtime.
19
Horizontal and Vertical Switch
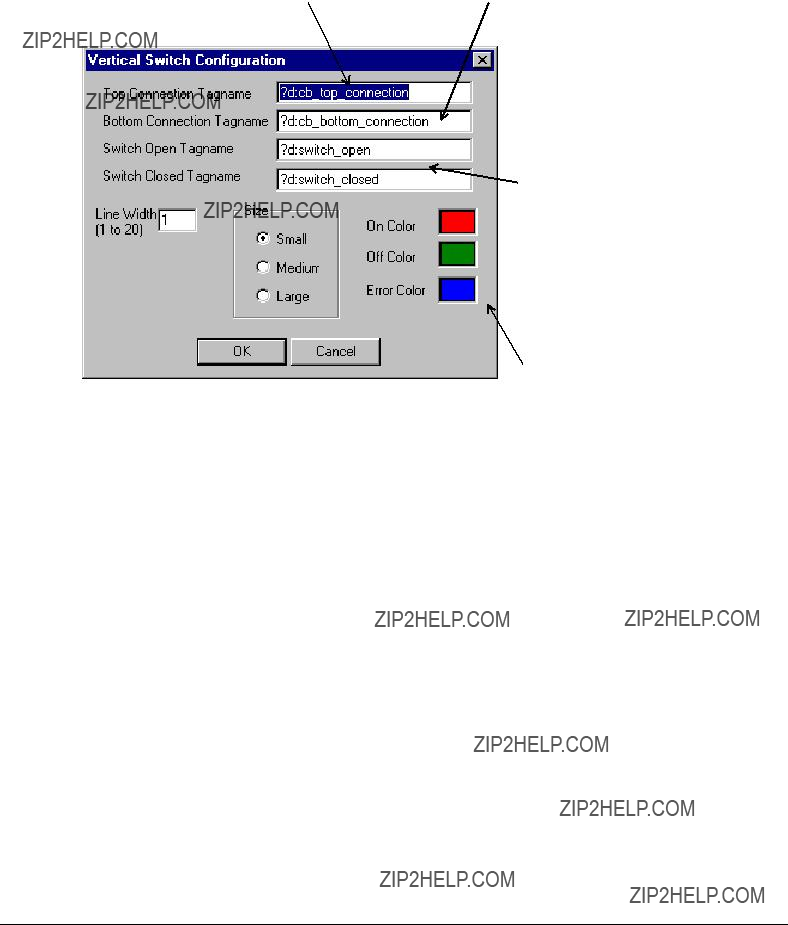
After placing a Horizontal or Vertical Switch wizard in a window,
Enter the name of the InTouch discrete tag that determines the color of the line to the right (or top) of the switch symbol during runtime.
Enter the name of the InTouch discrete tag that determines the color of the line to the left (or bottom) of the switch symbol during runtime.
Enter the names of the InTouch discrete tags that determine the state of the switch during runtime.
Specify the colors of the wizard elements when the connection and switch discrete tags are On and Off and when there is an Error condition. The switch symbol color is determined by the following logic:

Circuit Breaker
After placing a Horizontal or Vertical Circuit Breaker wizard in a window, double- click on it to display the dialog box shown below. Configure the wizard by entering the appropriate information into each of the boxes.
Enter text to display next to the breaker graphic during runtime (optional).
Enter the name of the InTouch discrete tag that determines the color of the line to the right (or top) of the breaker symbol during runtime.
Enter the name of the InTouch discrete tag that determines the color of the line to the left (or bottom) of the breaker symbol during runtime.
Enter the name of the InTouch analog tag that determines the color of the circuit breaker symbol, the state of the breaker, and the status text displayed next to the breaker icon during runtime.
Specify the colors of the wizard elements and status text for the breaker states during runtime.
See the table below for default status/color mappings.
The breaker status values and the associated default colors are listed in the table below. Error status indicates that the breaker status inputs create an indeterminate state for the breaker.
Breaker status values & display colors.
21

Elevation Wizards
Usage
Elevation wizards are graphical elements that represent switchgear components useful for creating
Configuration
After placing an Elevation wizard in an open window, it may be moved or resized, but no other configuration is possible. Elevation wizards are not provided with logic for opening another window.
Floor Plan Wizards
Usage
Floor Plan wizards are graphical elements that are useful for creating accurate representations of a facility layout. You can use a floor layout as an overview display of an entire plant, with animated areas for navigation to various switchgear elevation views or
Configuration
After placing a Floor Plan wizard in an open window, it may be moved or resized, but no other configuration is possible. Floor Plan wizards are not provided with logic for opening another window.
23
Toolbar Wizard
Usage
The Toolbar wizard is a navigational tool which allows the user to move between
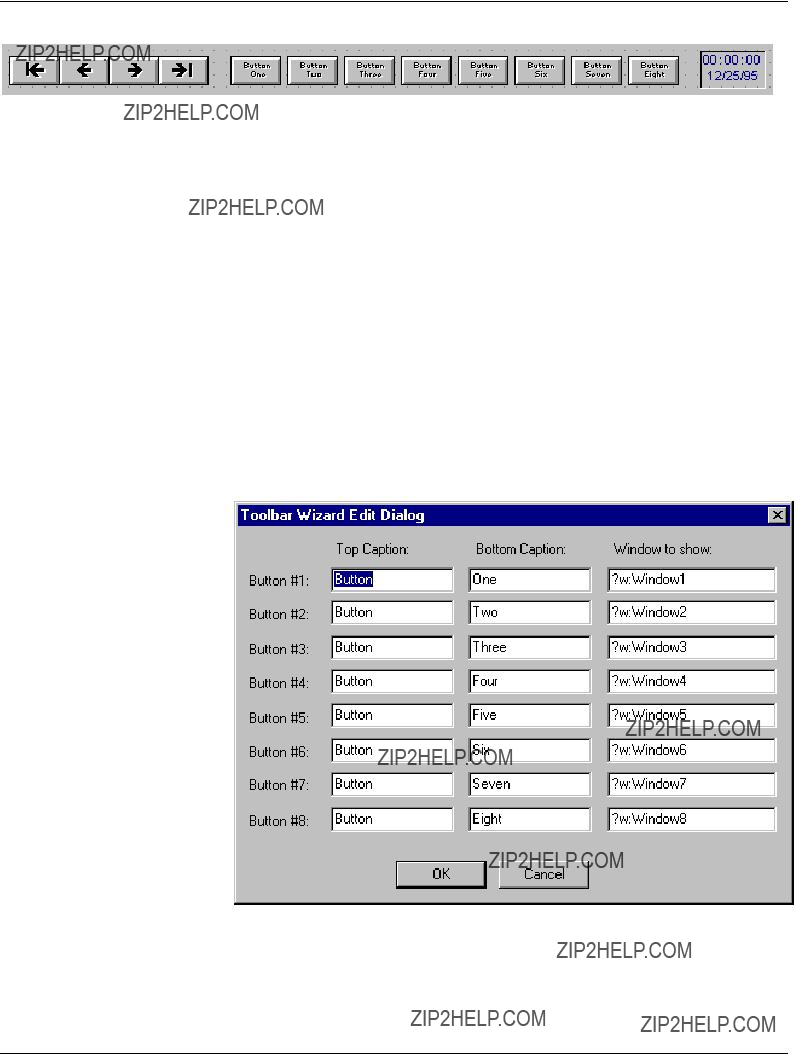
The first/last arrows jump to the first or last window in the windows list (see Configuration below); the inner forward and back arrows move to the next or previous window in the list. The window buttons to the right of the arrows provide quick access to the windows assigned to each button.
Configuration
The arrow buttons on the Toolbar wizard operate by maintaining a list of windows for access by the toolbar navigational controls. To allow a window to be added to the windows list when viewed by a user, a call to WLAddWindow( ) must be placed in the OnShow window script. This call must be placed in each window that you want to have on the window list.
The eight hot buttons are configured by double clicking on the wizard, and completing the Toolbar Wizard Edit dialog box:
For each button, you can set the top and bottom caption, and specify the window to be opened when that button is clicked.

Annunciator Panel Wizard
Usage
The Annunciator Panel wizard provides an
This wizard requires the PMCS Event Logger software to be installed and properly configured before it can be used, because it operates by monitoring special DDE tags which change state based on alarms or events recorded by the Event Logger.
The panel consists of an array of 48 buttons (six columns by eight rows), each of which may be labeled with up to three lines of text, and each of which is associated with a particular device (topic) at the PMCS DDE Server.
The annunciator panel wizard provides buttons for acknowledging alarms, resetting acknowledged alarms, and for viewing an alarm summary via the PMCS Event Logger.
Annunciator Panel Theory of Operation
The Annunciator Panel wizard provides a screen full of indicator tiles, each relating to a particular device, event, or group of events. These tiles are displayed in different colors to indicate different alarm conditions. The Annunciator Panel wizard monitors selected DDE items in the Event Logger and responds to changes of state in these items by changing the colors of individual indicator tiles. For example, you might configure a relay trip event to have a tile in the Annunciator Panel wizard. The wizard monitors a DDE tag at the Event Logger corresponding to the trip status of the relay and displays a grey indicator if the relay is operating properly, and a red indicator if the relay has tripped.
25

From the Event Logger???s perspective, there are two parts to configuring the Annunciator Panel. First, each DDE Item that will be displayed on the Annunciator Panel wizard must be added (using the Add Items dialog). For the example we???re discussing, we???ll assume you???ve created a DDE Item named Trip1. Each DDE item will connect to an individual tile in the Annunciator Panel wizard.
The second part consists of defining events which will turn individual DDE items ON or OFF. Each DDE item (or Annunciator Panel tile) can be turned on or off by any number of device events you define. The events are logically ORed together to determine ON or OFF conditions; i.e., if any of the events occurs, the DDE item is ON; if none of the events have occurred, the DDE item remains OFF.
We???ll continue the relay example we began above. For example, you might configure the Trip1 DDE Item to be ON if any of the following events occurs: the relay is tripped, or the relay reports an error condition, or the relay senses an overvoltage condition. The Annunciator Panel wizard displays a grey indicator tile for the relay for as long as the DDE item remains in the OFF condition. If the Annunciator Panel wizard sees the DDE Item change from OFF to ON, it reacts by changing the indicator tile from grey to red. The Event Logger Annunciator Panel logic will also change the state of a DDE Item in response to actions performed at the Annunciator Panel Wizard. The user can both acknowledge and reset individual Annunciator DDE Items. The following diagram shows the relationship of the Annunciator Panel wizard, the Event Logger, and the PMCS DDE Server.

In the upper illustration, the Event Logger watches for any of the three events configured to cause a change of state to the Trip 1 DDE Item. None of these three events have occurred, so the status of the Trip 1 DDE Item is at OFF. The Annunciator Panel wizard is monitoring the configured DDE Items at the Event Logger, but all DDE Items are ???OFF??? so the Annunciator Panel displays green indicator tiles.
In the lower illustration, the Event Logger has recorded a ???Trip??? event for the unit in question, and changed the state of the Trip 1 DDE Item to ???ON???. The Annunciator Panel wizard sees this change, and responds by changing the color of the annunciator panel tile for Relay 1 to red.
27

Each "Alarm indicator" as defined by the Event Logger will appear to InTouch as a DDE Integer item which can have the following values/states:
Each panel button displays one of five different colors, based on the states defined above. A fill color animation link controlled by an indirect integer tag is used to change colors. The fill color link is set as follows:
<= 9: Dark Grey
10
30
>= 40: Yellow

Configuration
Note: Prior to configuring an Annunciator Panel Wizard, you should have completed configuration of the Annunciator Panel Items at the PMCS Event Logger. Refer to
When the Annunciator Panel wizard is dropped, it appears as a blank panel of 48 indicators:
29
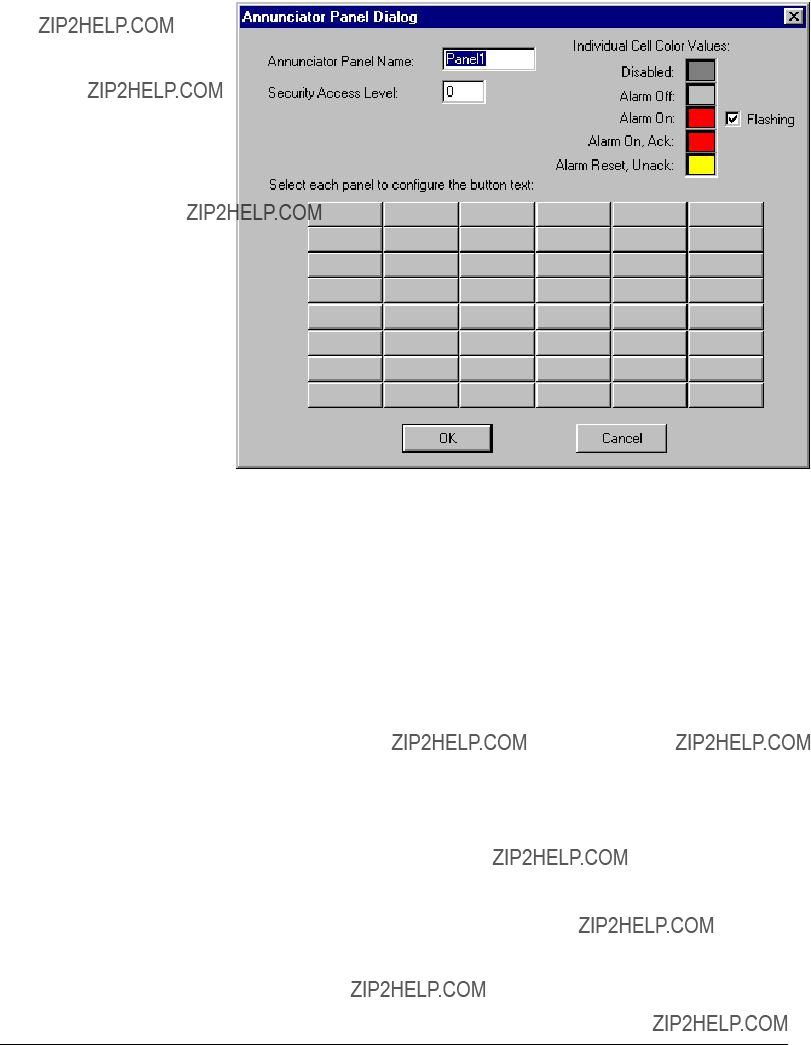
Dialog:
Complete the Annunciator Panel Name field (up to 8 characters), and the Security Access Level (level of security required to Reset any Acknowledged alarms. The color codes for different alarm states can be modified by clicking on each color. Note that the color codes apply to all 48 indicators on the annunciator panel wizard.
Finally, click on an indicator to display the configuration dialog for that individual button:

Enter the text to display on any of the three lines available for the selected button. It is not necessary to enter text on all three lines. Click OK when you have finished assigning text labels to the button.
As each annunciator panel button is labeled, the Annunciator Panel Dialog reflects these changes by showing the Row/Column coordinates of the labeled buttons:
When you have finished labeling your annunciator panel buttons, click OK to close the Annunciator Panel Dialog box. When you close this dialog box, InTouch automatically creates indirect analog tags for each panel button. These tags are named xxx_R1C1 through xxx_R8C6, where xxx is the name assigned to the wizard (for example, Panel1), and R1C1 indicates the row and column position on the annunicator panel.
31

Two steps remain after the wizard has been configured.
First, InTouch DDE Integer tags must be created for the DDE items configured in the Event Logger corresponding to the Alarm Panels. Make sure the DDE Item names created in InTouch match the DDE Item names configured in Event Logger. (If you are unsure of how to create DDE tags in InTouch, please refer to WonderWare???s documentation.) The DDE Access name for the Event Logger should be configured in InTouch as follows:
Second, an InTouch script must be written to associate the InTouch indirect tags created by the wizard with the InTouch DDE tags created for DDE Items in Event Logger. Typically, this script is placed in the InTouch ???On Startup??? application script.
An example of a simple script is shown below:
Panel1_R1C1.Name = ANN_P_1A.Name;
Panel1_R1C2.Name = ANN_P_1B.Name;
Panel1_R1C3.Name = ANN_P_2A.Name;
At
33

Troubleshooting Tips for the Annunciator Panel Wizard
???Make sure that all DDE Items associated with the annunciator panel have been created in the Event Logger.
???You must create associated InTouch DDE Integer Tags by hand in the InTouch tagname database. The DDE Access name for the tags should use ???EVENTLOG??? for the Application Name and ???SYSTEM??? for the Topic Name. Make sure the ???Request Initial Data??? option is selected for this DDE Access name.
???Check the WWLogger at runtime for possible DDE errors.
???Make sure your application script is mapping the proper DDE tags with the proper indirect tags.
???Make sure the Event Logger is running before starting InTouch Windowviewer.

Custom Table Wizard
Usage
The Tabular Data Screen wizards provide the ability to view extensive device data in tabular form. However, they do not allow you to select the data to view - you must view all the data presented and locate the particular data points you are interested in.
The Custom Table wizard differs from the Tabular Data wizards by providing an
Each table takes up approximately
Configuration
When the Custom Table wizard is dropped, it appears as a blank screen. Double- click on the wizard to display the Custom Table Dialog:
35

Begin configuring the Custom Table by completing the following fields:

EPM 7700 Users Only: When the EPM 7700 device type is selected, an additional field appears in the Custom Table Dialog box, adjacent to the Device Name (shown below).
The Node Name field requires that you enter the name of the computer on which the meter???s Communications Server is located, either the Primary Node or a Full Station Secondary Node. This field is required because the EPM 7700 does not use the same DDE Server as the rest of the standard PMCS devices, and the wizard must be directed to the location of the correct Communications Server for proper configuration of DDE topic names. For more information on configuring EPM7700 networks, refer to
PMCS Read This Book First.
Also, the Application name field must be completed as ION_LINK rather than GE32MODB or GE32MTCP for the EPM7700 device. The ION LINK program is installed during initial PMCS setup if the EPM7700 software option is selected.
When configuring Custom Tabular wizards on Secondary nodes, the Application Name field entry does not follow the PMCS wizard convention of ???\\RemoteComputer\ION_LINK???. EPM7700 Secondary nodes run a local copy of the ION LINK server; thus the application name is always ???ION_LINK??? whether the wizard is installed on the Primary node or a Secondary node.
Finally, the EPM 7700 device type requires special InTouch scripting for the custom tabular wizard. Refer to the section at the end of this chapter titled Special Scripting Considerations for the EPM 7700.
37

When these fields are completed, click the Select Multiple Tags button to select several tags at once, or click the Select Tag X button to assign tags one at a time. The Select Device Tags dialog appears:
The Select Device Tags dialog shows a list of all the
Select up to twelve tags from the list by clicking

You may select OK to select this table configuration, or you may edit the tags one at a time using the Select Tag X buttons (for instance, if you wish to change the order the tags appear in).
The tag descriptions and units may also be edited (useful for
Note for users of the MDP device type: This device uses a memory tag to scale many
of the data values displayed in the wizard.: "DeviceName_CTRatio" (where DeviceName is the name entered for the device within the wizard). The wizard creates this tag within InTouch (memory tag with a format type of "Real"). The InTouch application must provide a value for this tag (usually entered by the user at
Note for users of the EPM7300 device type: The custom table wizard will display
N/A for certain metering values when the PM Volts Mode parameter is set to Demo in the device. Please use the EPM 7300 Tabular Data Wizard to view these values when the device is in Demo mode.
39
System Statistics Wizard
Usage
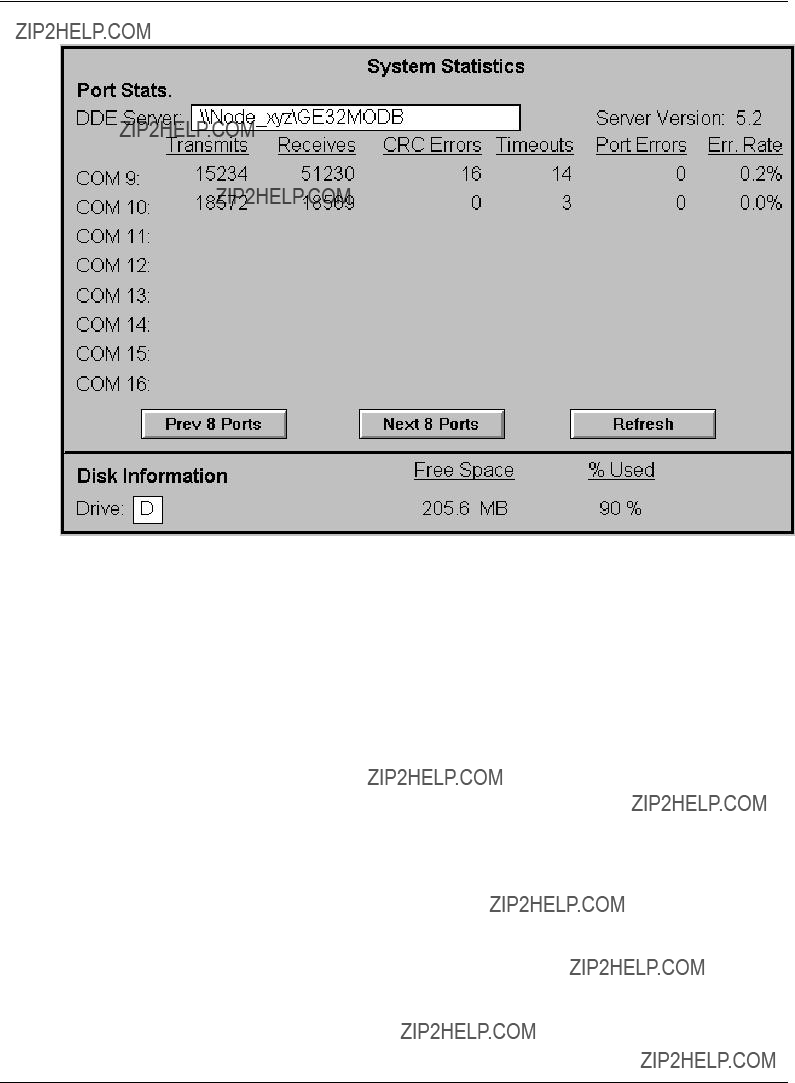
The System Statistics wizard is an informational tool which allows the user to view detailed statistics about the system, including port information from the DDE Server and disk information.
The wizard consists of a single screen displaying Port Statistics on the top portion and disk information on the bottom. Statistics on up to eight COM ports are displayed. The user may page forward or backward eight ports at a time by clicking the Prev 8 Ports or Next 8 Ports button.
Whenever a new DDE Server name is entered, the user must click the Refresh button to update the DDE links to correspond to the new parameters.
Configuration
When the wizard is dropped, the following dialog box appears:

The System Statistics wizard requires a name itself, and also the name of a DDE Server to access.
By default, the System Statistics wizard assumes that the DDE Server is located locally and is named GE32MODB. You may change this to access a DDE Server located on a networked PC by entering the name as \\NODENAME\SERVER, where NODENAME is the name of the host PC and SERVER is the name of the PMCS DDE Server, which will be GE32MODB.
During runtime, the default drive letter is C, corresponding to the local hard drive. You may change this value to any valid drive letter corresponding to either a fixed local drive or a mapped network drive.
41

Lockout/Tagout Wizard
Usage
The Lockout/Tagout provides a method for assigning danger or ground tag graphics to various
DEATH!
The Wizard consists of a single screen (shown above) displaying the presence or absence of danger and ground tags for a particular device. The user installs or removes Danger and/or Ground Tags using the Install/Remove buttons on the Tag Assignment window shown above. Any wizards belonging to the same Status Group will display Danger and/or Ground Tag indicators mirroring the tags installed in the Tag Assignment window.
Supported Devices
Several PMCS breaker management devices support the Lockout/Tagout Wizard in their Large Faceplate and Tabular Data Screen wizards. These devices are:
???750 / 760 Feeder Management Relay
Configuration
When Lockout/Tagout wizard is dropped and
Complete the following fields to configure the Lockout/Tagout Panel Display:
???Enter a name for this panel. The Panel Name is used to distinguish the tags used internally by a particular instance of a panel from other panels within an application. Each panel within an application should have a unique Panel Name.
???Enter the name of the Status Group associated with this Lockout/Tagout Panel. The Status Group is the name that links this panel to Lockout/Tagout Online Symbols and the breaker management device wizards that can support it. It is important to remember the Status Group assignment since it must be used to configure the associated Oneline Symbols and IED wizards.
???Enter the minimum Security Level required to add and remove Danger or Ground tag symbols within the application.
The second part of the Lockout/Tagout wizard that can be configured is the Oneline Tagout Symbol.
The Oneline Tagout Symbol is a small wizard for placement in oneline diagrams, to be associated with a circuit breaker. It displays the presence or absence of any Danger or Ground tag symbols assigned to the breaker symbol by the PMCS user. After dropping the Oneline Tagout Symbol wizard onto a oneline diagram, associate it with a particular circuit breaker and any other devices you wish to have the tags displayed at by making it a member of a Status Group. The Oneline Tagout Symbol Dialog box is displayed when you
43
Complete the following fields:
???Enter the name of the Status Group associated with this Lockout/Tagout symbol. The Status Group is the name that links this symbol to the Lockout/Tagout panel and the breaker management device wizards that can support it. It is important to remember the Status Group assignment since it must be used to configure the associated panel and IED wizards.
???Enter the name of the window to open when the Oneline Tagout Symbol wizard is clicked on during runtime. It should be the name of the window in which the Lockout/Tagout Panel is located.
Example of Lockout/Tagout Wizard
The following example may help clarify the use of the Lockout/Tagout wizard.
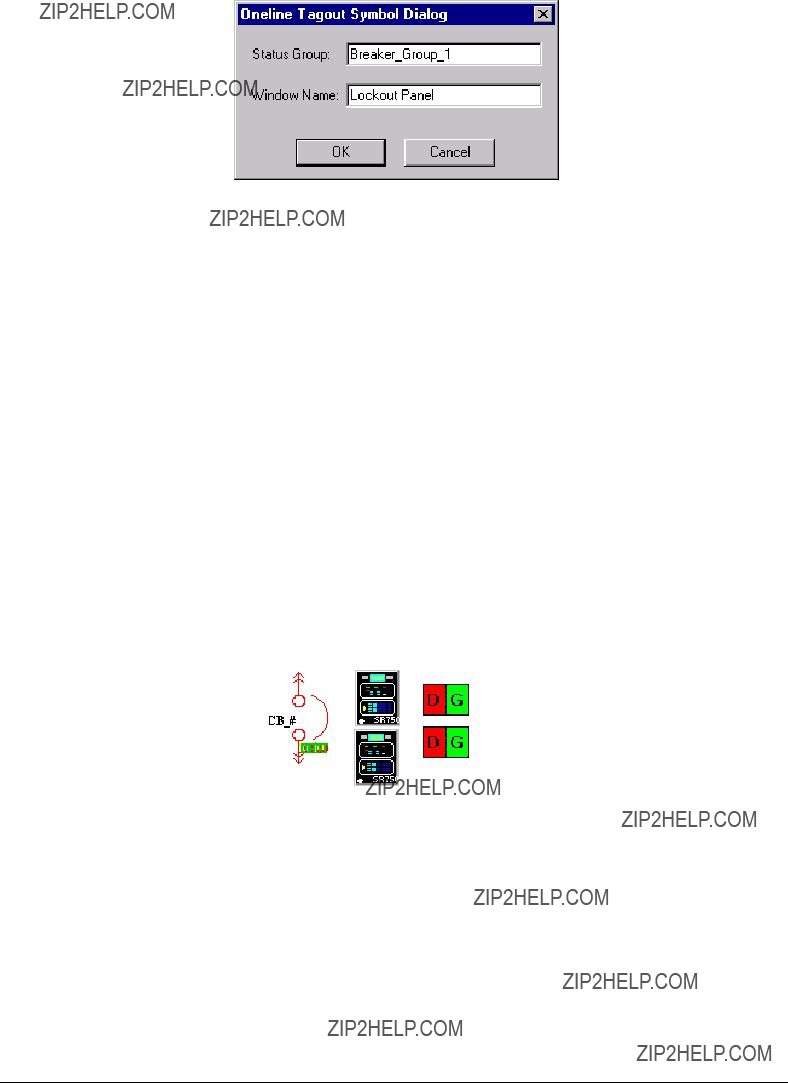
Suppose that we have a breaker being monitored by a redundant pair of ML 750/760 devices in our system. We wish to be able to display Lockout/Tagout symbols for this breaker.
We create a oneline diagram in InTouch which represents this configuration, placing the circuit breaker wizard, then each of the ML 750/760 small faceplate wizards, then a Lockout/Tagout wizard for each ML 750/760 device. It looks like this:
When configuring the Lockout/Tagout wizard in the oneline diagram, we complete the Oneline Tagout Symbol dialog as follows:
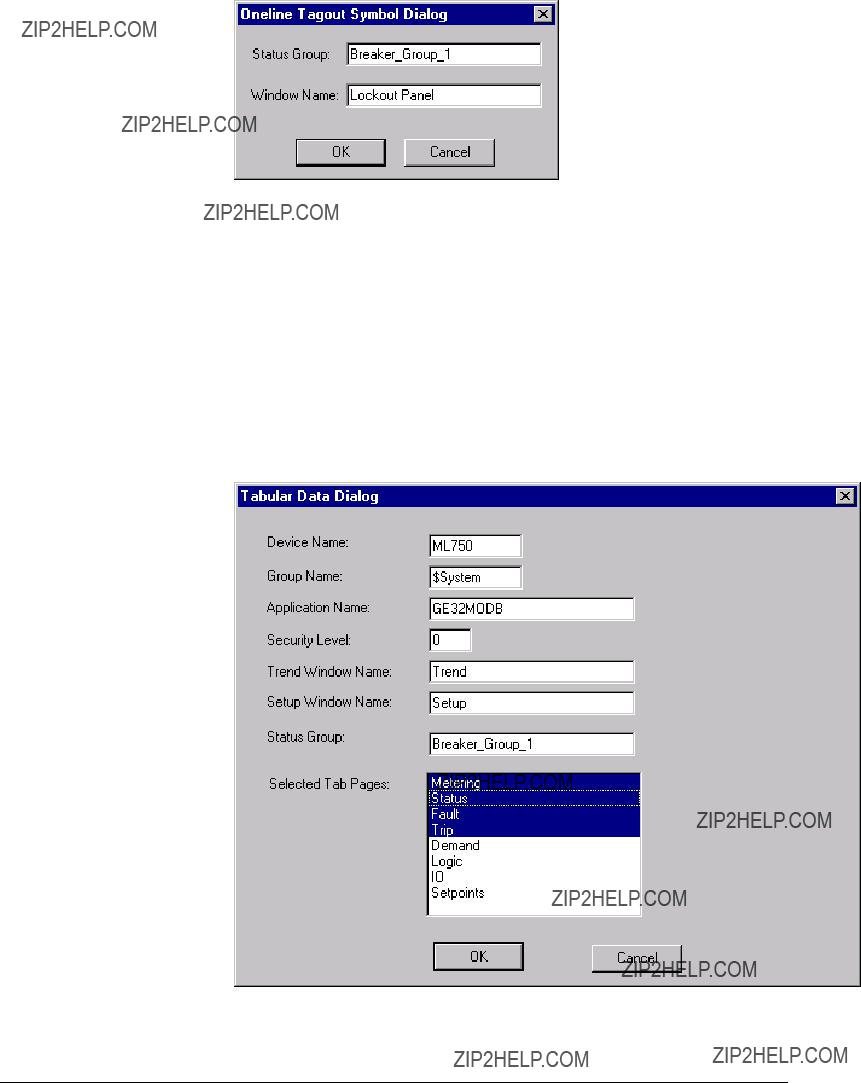
Breaker_Group_1 is the name of the Status Group we???ll assign to all wizards associated with this breaker; Tag Window is the name of the window we want to appear when someone clicks on the Oneline Tagout wizard during runtime.
Next, we create separate screens containing Large Faceplate wizards and Tabular Data screen wizards for each ML 750/760 device. While configuring each wizard, we make sure that each one is given the Status Group ???Breaker_Group_1???. This ensures that any Danger or Ground tag symbols present will be shown on any large faceplate, tabular data screen, or oneline wizards associated with this group. An example of the Tabular Data configuration dialog box is shown below; note that the Status Group field is assigned to Breaker_Group_1, the same Status Group as our Oneline Tagout Symbol wizard. Do not confuse the Status Group parameter with the Group Name parameter. The Group Name parameter is not used for configuring Lockout/Tagout Status Groups.
We drop and configure our Lockout/Tagout Wizard next; double clicking this wizard, the Lockout/Tagout Panel dialog appears:
45

We name the Lockout/Tagout panel Panel_1. We associate the Panel with the same Status Group as our other wizards, Breaker_Group_1. Finally, we set the minimum security level required to add or remove tags.
Now in Runtime mode, when the Tag Assignments dialog is displayed, it appears as follows:
Clicking Install Danger Tag checks our security level, and if we have sufficient access, displays a Danger Tag for the breaker as follows:
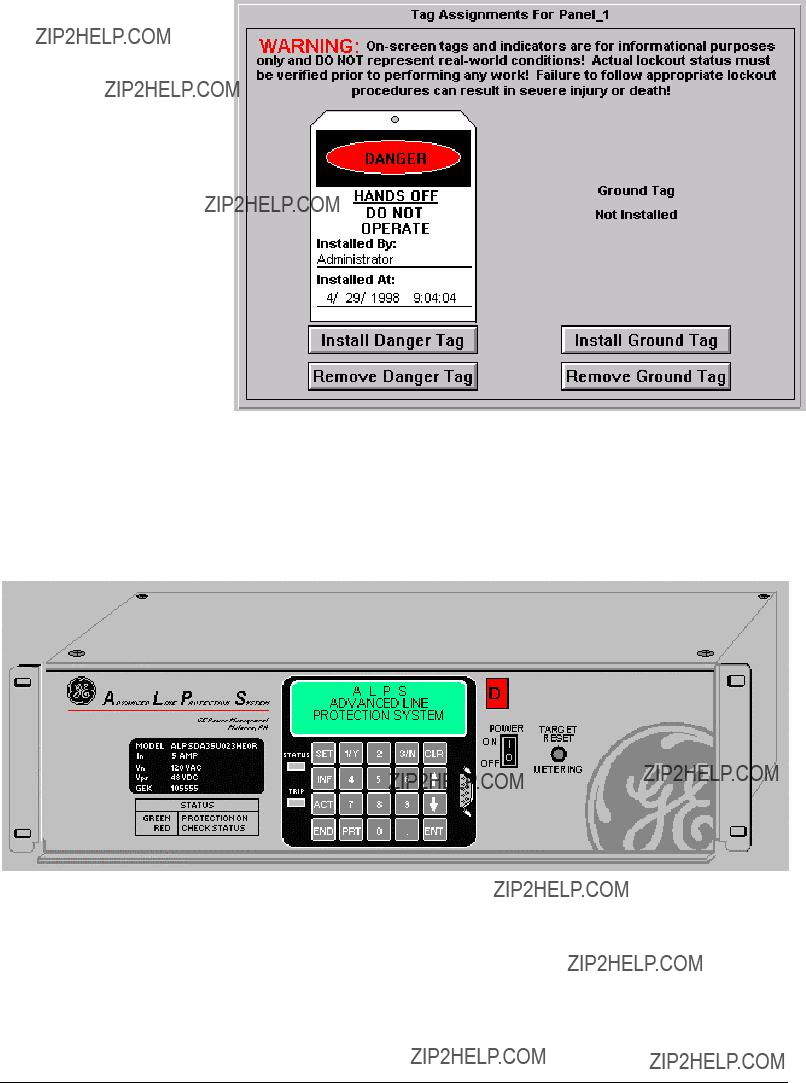
The Installed By field on the tag shows the name of the current operator who installed the tag; the Installed At field shows the time and date stamp of the tag???s installation.
When we view a wizard which belongs to this group, for example the Large Faceplate wizard of one of our ALPS devices, the Danger tag shows up as a red indicator with a ???D??? in it, as shown below:
47

Special Scripting Considerations for the EPM 7700
This section describes the special InTouch scripting which is required for the EPM 7700 device???s Large Faceplate, Tabular Data Screen, and Custom Tabular wizards. The EPM 7700 is a powerful and highly flexible device, supporting hundreds of discrete data items. This scripting is required due to the large number of DDE items available for this device type. For performance reasons, not all DDE items are kept active simultaneously by the EPM 7700 Tabular Data Screen wizard; at any given moment, DDE items which are not used may be disconnected to save the Server the additional overhead of monitoring unused items. The scripts described in this section automatically configure the DDE links used by the Tabular Data Screen wizard when it is displayed, and enable the Large Faceplate wizard to
NOTE: Failure to install these scripts for the Large Faceplate and Tabular Data
Screen wizards may result in faulty behavior of the wizard!
Templates for the required scripts are automatically installed in the InTouch directory when PMCS is installed with the EPM 7700 Software Components option selected. You may use the Notepad accessory program to open the files, then copy the text from the file to InTouch when appropriate.
There are three scripts described in this section. The first script is an InTouch Application Script that is required whenever a Large Faceplate or Tabular Data Screen wizard is installed for a given device. The purpose of this script is to provide communication status indication on the wizard. If the application script is not installed, the ???Communications Failed??? indicator on the Large Faceplate and Tabular Data wizards will not function. The second script, the EPM 7700 Large Faceplate/Custom Table Script, is an InTouch Window Script that must be applied to each Large Faceplate and Custom Tabular wizard window. This script ensures that any tags which were disabled by the Tabular Data wizard are properly restored when switching to a Large Faceplate or Custom Table screen. The third script, the Tabular Data Screen Script, also an InTouch Window Script, applies only to the EPM 7700 Tabular Data Screen wizard. Its purpose is to automatically initialize the wizard for optimum performance whenever its window is displayed.
Note that the application script is required whenever a Large Faceplate or Tabular wizard is installed. The Windows scripts are required whenever your application uses Tabular Data wizards.
Installing the Application Script
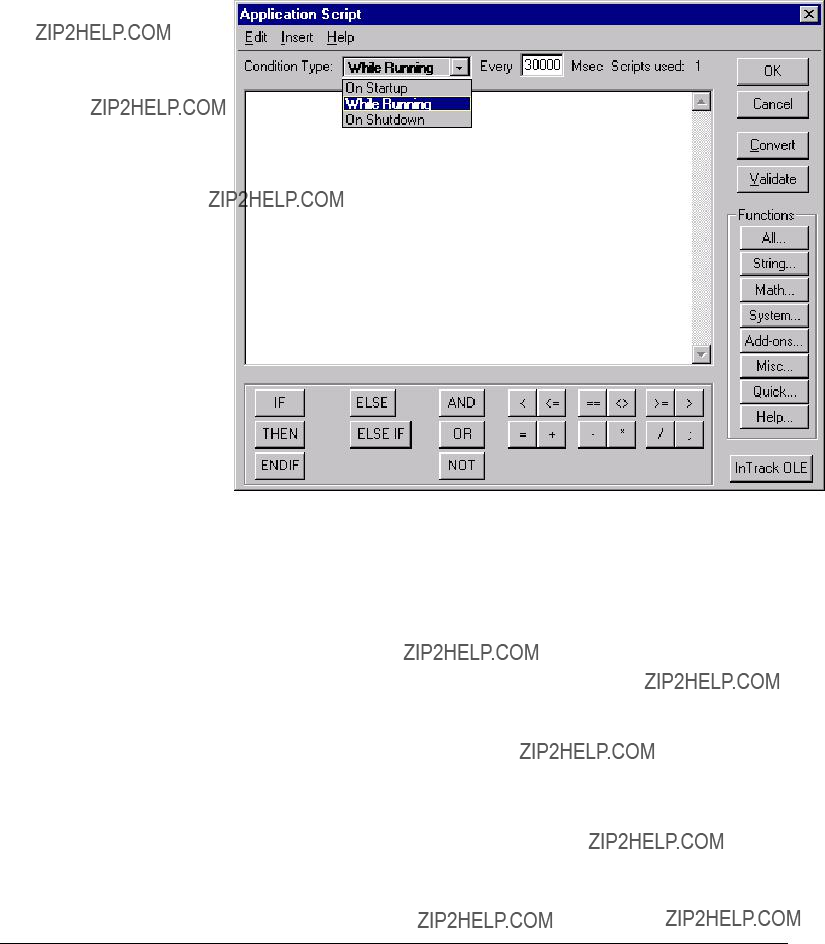
1.After configuring the EPM 7700 Large Faceplate wizard or Tabular Data Screen wizard, select ???Special \ Scripts \ Application Scripts?????? from the WindowMaker main menu. The Application Script Dialog box opens:
2.Select ???While Running??? from the Condition Type drop down list, and enter ???30000??? in the ???Every ??? Msec??? text box next to the Condition Type drop down list.
3.Use Notepad.exe to open the file ???EPM7700 Application Script.txt???, located in the Intouch directory of the PC. Select (highlight) all the file text and copy it to the clipboard using the
4.Switch back to WindowMaker and paste the clipboard contents into the Application Script dialog text box, using the
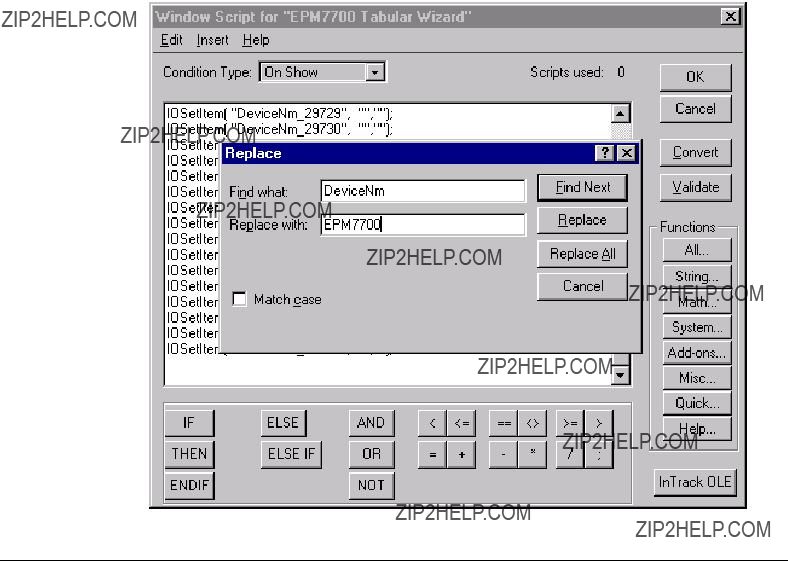
5.From the dialog box menu, select Edit \ Find??? to bring up the Replace dialog box as shown in the example below. In the ???Find What??? field, type in ???DeviceNm???. In the ???Replace With??? field type in the Device Name used to configure the Large Faceplate wizard. Click the ???Replace All??? button to modify the text, then click the Cancel button to close the Replace dialog.
49

1.Click the OK button to close the Application Script Dialog.
NOTE: The application script text is only needed once for each configured device. If you are installing more than one wizard for a particular EPM7700 device (for example, a Large Faceplate and a Tabular Wizard), you only need to copy the application script once. If you are installing more than one EPM7700 device in your InTouch application, the application script window must contain a copy of the application script text for each configured device. See the example below:

51
EPM 7700 Large Faceplate or Custom Table Wizard Scripting
Configuring the Large Faceplate/Custom Table Script
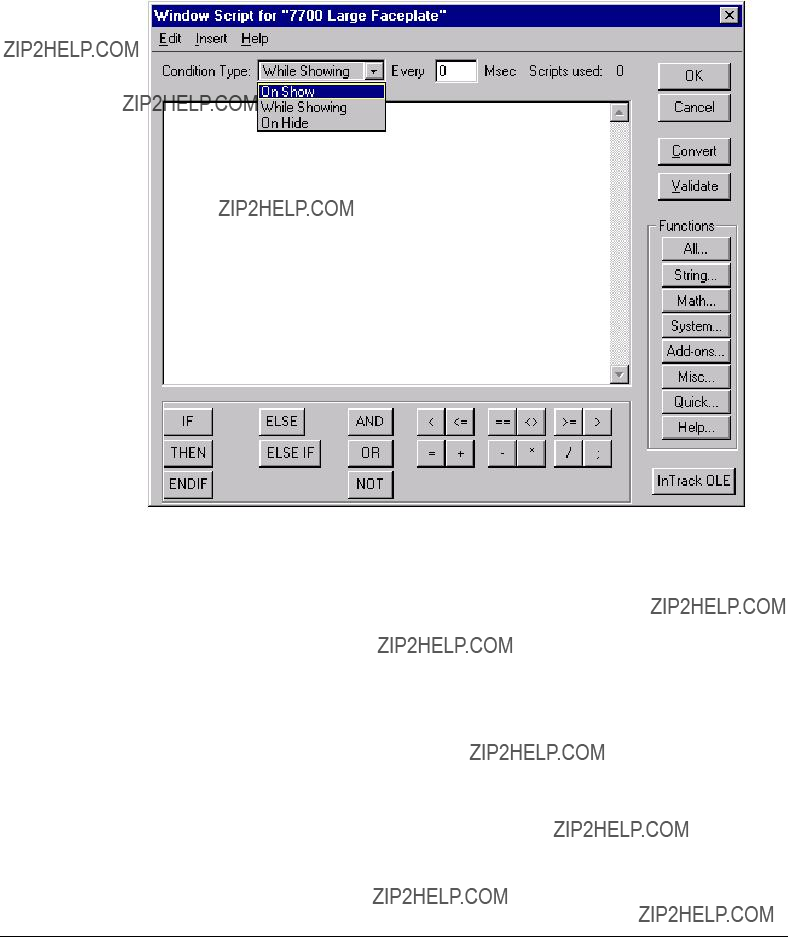
1.After configuring the Large Faceplate or Custom Table wizard, and with its window displayed, select ???Special \ Scripts \ Window Scripts??? from the WindowMaker main menu. The Window Script Dialog box opens:
2.Select "On Show" from the Condition Type drop down list.
3.Use Notepad.exe to open the file ???EPM7700
4.Select (highlight) all the file text and copy it to the clipboard using the
5.Switch to WindowMaker and paste the clipboard contents into the Window Script dialog text box, using the
6.From the dialog box menu, select Edit \ Find??? to bring up the Replace dialog box as shown in the following example. In the ???Find What??? field, type in ???DeviceNm???. In the ???Replace With??? field, enter the Device Name used to configure the Large Faceplate wizard. Click the ???Replace All??? button to modify the text. Click the Cancel button to close the Replace dialog. Click the OK button to close the Window Scripts Dialog.
53
EPM 7700 Tabular Data Screen Scripting
All EPM7700 Tabular wizards require the creation of a Window Script in InTouch. The Window Script automatically configures DDE Links used by the Tabular Wizard when it is displayed. The script must first be configured, then installed, per the following procedures.
Configuring the Tabular Data Screen Script
1.After configuring the Tabular wizard, and with its window displayed, select "Special \ Scripts \ Window Scripts??? from the WindowMaker main menu. The Window Script Dialog box opens.
2.Select ???On Show??? from the Condition Type drop down list.
3.Use the Notepad.exe accessory program to open the file ???EPM7700 Tabular Window Script.txt???, located in the Intouch directory of the PC. Select (highlight) all the file text and copy it to the clipboard using the
4.Switch back to WindowMaker and paste the clipboard contents into the Window Script dialog text box, using the
5.From the dialog box menu, select Edit \ Find??? to bring up the Replace dialog box, as shown in the example below. In the ???Find What??? field, type in ???DeviceNm???. In the ???Replace With??? field type in the Device Name used to configure the Tabular wizard. Click the ???Replace All??? button to modify the text. Click the Cancel button to close the Replace dialog. Click the OK button to close the Window Scripts Dialog.

Creating Floor Plans, Elevation
Views, and
Introduction
This chapter illustrates how to use the GE wizards described in Chapter 2 to create animated displays of the facility floor plan, switchgear elevations, and system one- line diagrams. These examples are typical, but are not intended to display the limits of creative system design.
Elevation Views
Elevation views of switchgear and switchboards are typically created first, because miniature bitmaps of the elevations can be conveniently placed in floor plans as navigation items.
To build an elevation view, place GE Elevation and Small Faceplate wizards into the window, as follows:
1.Place the appropriate cabinet.
2.Place panels onto the cabinet.
3.Add nameplates, louvers, handles, and fasteners to create the desired level of detail.
4.Place GE Small Faceplate wizards representing the components installed in the equipment on top of the elevation wizards, as shown in the figure on the following page.
5.Configure each of the Small Faceplate wizards to open a window containing an appropriate Large Faceplate or Tabular Data Screen for the device.
55

6.You can add additional navigation buttons (using standard InTouch controls) to open windows containing
7.If the switchgear shown in the elevation view is fed from or feeds another lineup, you can add buttons to navigate to elevation views representing those lineups.
Floor Plans
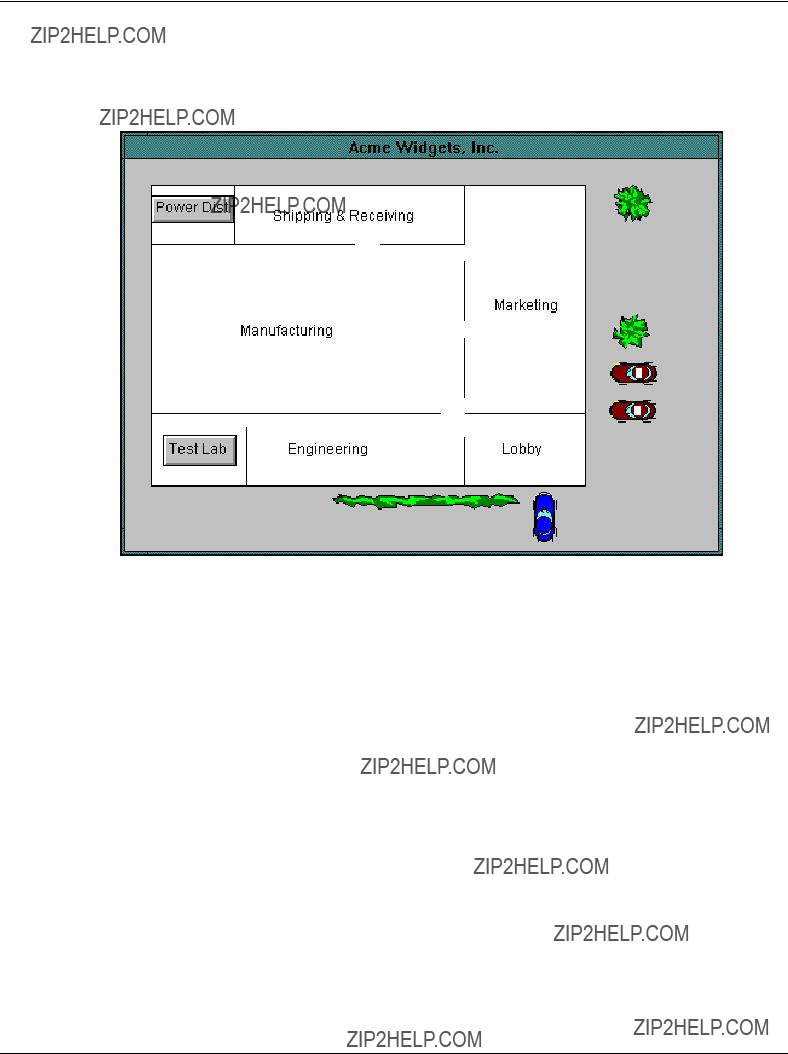
A floor plan should be a recognizable overhead representation of a facility. These windows are built using the GE Floor Plan wizards, described in Chapter 2. They can be made as detailed or as simple as desired. The example below shows an overview of a facility, showing all of the areas containing equipment.
You can link each of these areas in the main window to a more detailed window by adding a labeled navigation button (using standard InTouch controls) that is configured to show that window. In this way, you can provide paths to move up and down through a complete floor plan hierarchy.
Floor plans may be as detailed as you desire and may include miniature bitmaps of equipment elevations. The procedure for creating a miniature bitmap in a floor plan view is as follows:
1.In the floor plan window, use the toolbox to create a bitmap object with the desired size of the miniature switchgear.
2.Switch to the desired elevation window.
3.Select and copy the elevation view.
4.Switch back to the floor plan window.
5.In the floor plan window, use the Paste Bitmap command to insert the elevation view into the bitmap object.
6.
7.You can add additional buttons, using standard InTouch controls, to navigate to windows containing
57

Electrical
A
After the device wizards have been placed and configured, they may be connected by standard InTouch line graphics.
When a
To accurately animate your
An example of the scripting for this

{Set values of local discrete variables based on state of integer status of breaker. This section sets the breaker status memory discretes to true if the breaker???s analog status value is 3 (closed).}
brk1_s = (brk1 == 3 OR brk1 ==9); brk2_s = (brk2 == 3 OR brk1 ==9); brk3_s = (brk3 == 3 OR brk1 ==9); brk4_s = (brk4 == 3 OR brk1 ==9); brk5_s = (brk5 == 3 OR brk1 ==9); brk6_s = (brk6 == 3 OR brk1 ==9);
{set the bus status for the incoming feeds to the dependent bus above in the
distribution hierarchy. This section sets the dependencies of the bus pieces to other sections of the
bus1 = feed1; bus2 = feed2;
{set the bus status for the incoming feeds to the dependent bus above in the
distribution hierarchy. This section sets the dependencies of the bus pieces to other sections of the
bus1 = feed1; bus2 = feed2;
{reset internal bus pieces to off for computations }
bus3 = 0; bus4 = 0; bus5 = 0;
{set the bus status for the incoming feeds to the dependent bus above in the
distribution hierarchy. This section sets the dependencies of the bus pieces to other sections of the
bus1 = feed1; bus2 = feed2;
{reset internal bus pieces to off for computations }
bus3 = 0; bus4 = 0; bus5 = 0;
Sets the breaker status memory discretes to true if the breaker???s analog status value is 3 (closed).
Sets the dependencies of the bus pieces to other sections of the one- line diagram and resets the pieces of the bus located entirely on this screen to false.
IF???THEN statements traverse the hierarchy from top to bottom, left to right, and then bottom to top, right to left.
59

{set the bus status for the incoming feeds to the dependent bus below in the
distribution hierarchy. The IF_THEN statements in this section traverse the hierarchy from top to bottom, left to right, and then bottom to top, right to left.}
bus6 = 0; bus7 = 0;
{two main feeds }
IF (bus1 AND brk1_s) THEN bus3 = 1;
ENDIF;
IF (bus2 AND brk2_s) THEN bus4 = 1;
ENDIF;
{left to right across tie breaker } IF (bus3 AND brk3_s) THEN
bus4 = 1;
ENDIF;
IF (bus4 AND brk4_s) THEN bus5 = 1;
ENDIF;
{two outgoing feeders }
IF (bus3 AND brk5_s) THEN bus6 = 1;
ENDIF;
IF (bus5 AND brk6_s) THEN bus7 = 1;
ENDIF;
{back feed from two outgoing feeds } IF (bus7 AND brk6_s) THEN
bus5 = 1;
ENDIF;
IF (bus6 AND brk5_s) THEN bus3 = 1;
ENDIF;
{right to left across tie breaker } IF (bus5 AND brk4_s) THEN
bus4 = 1;
ENDIF;
IF (bus4 AND brk3_s) THEN bus3 = 1;
ENDIF;
{two incoming feeds }
IF (bus5 AND brk2_s) THEN bus2 = 1;
ENDIF;
IF (bus3 AND brk1_s) THEN bus1 = 1;
ENDIF;

Sample Application
Creating a basic interface
We???ve learned about the various parts and pieces of the Interface Toolkit; now let???s put it to work.
Suppose we have a very basic power management system installed at our corporate home office. The system consists of four trip units and a PQM (Power Quality Meter). We???d like to set up a computer in the front office to provide a front end to this system, allowing us to monitor all these devices at one station without having to walk back to the individual devices on the plant floor.
We plan the application on paper first so that we know how many screens to create and what each screen will look like. This will help us save time when in development by providing a starting point and a map of what we???re trying to create. This ???storyboard??? for our application looks something like this:
As shown above, for this basic application, we???ll need 12 screens ??? an introduction screen, a shot of the panelboard showing all five of our power management devices, and then a large faceplate and tabular screen for each device. We???ll link the Large Faceplate screen for each unit to the Small Faceplate wizard shown on the Panelboard screen, and, from the Large Faceplate, we can click on the device???s display to jump to the Tabular data screen for that device. To make it easier to navigate the screens, we???ll create extra buttons on the bottom of the Faceplate and Tabular screens that will jump back to the Panelboard screen.
With our plan in hand, and after completing the installation procedures described in Chapter 1, we???re ready to begin development. Launch InTouch and select the button to create a new file, then click the Development button.
61

First, we???ll create all our new windows and name them, then we???ll go back and flesh them out with their contents and add links between them. Create the following twelve windows:
Select the window named Main Screen, and use the Wonderware tools to sketch a floorplan of the facility, as shown below.
In the Manufacturing Floor area, we place a button labeled ???Click here to begin???,??? and give it an animation link to the window named Panelboard.
Select the Panelboard window. Use the PMCS Elevation wizards to create a
We???ll include a note about the panelboard???s location, describing where to find the real panel, and also a note of instruction: ???Click a device to see the large faceplate screen.???
Create the links to the device screens by
Next we???ll develop the device screens. For the purposes of this chapter, we???ll just walk through the two PQM screens. The development of the trip unit screens follows the same procedure.
Select the PQM_Face window, then use the Wonderware Button tool found on the Toolbox to create two new buttons, ???HOME??? and ???Go back to Panel.??? Use the Animation Links command to tie these buttons to the Main Screen and Panelboard windows, respectively. Now use the Wizards tool to place the PQM Large Faceplate wizard on the PQM_Face window. The screen should look similar to the following:
63
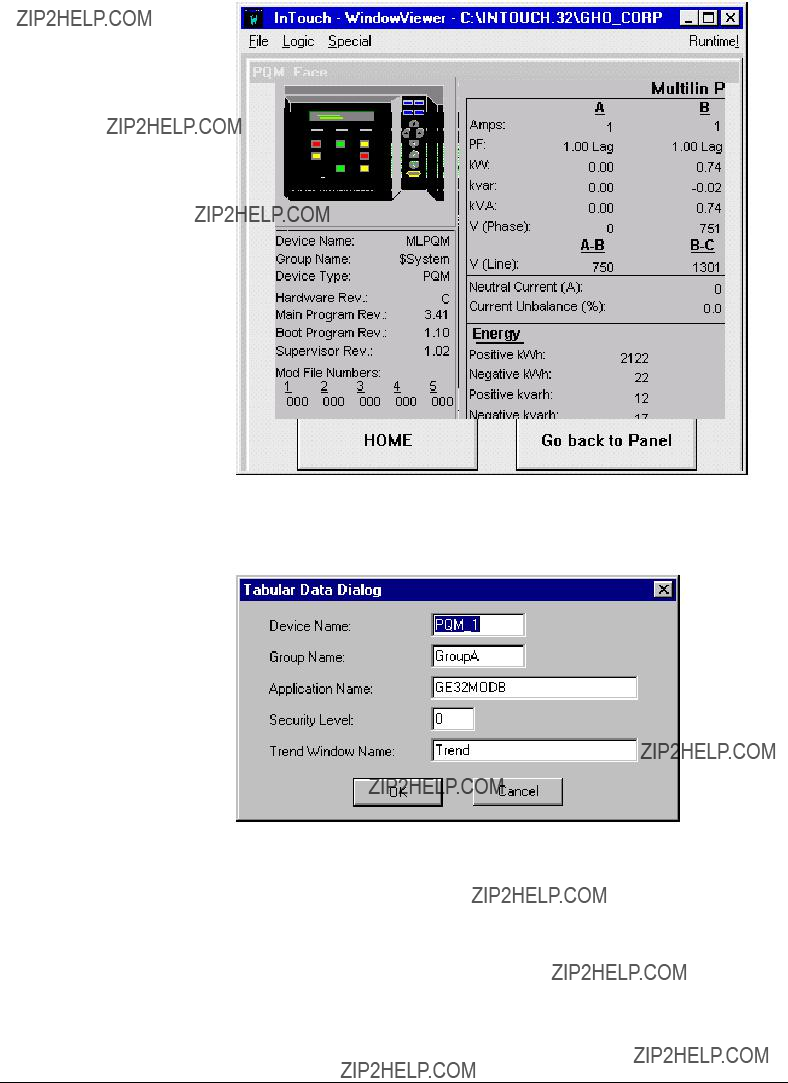
Now we???ll develop the PQM Tabular data screen. Select the PQM Tab window and use the Wizards tool to place the PQM Tabular Data wizard on the screen. Double click the wizard and fill in the Device Name and the Trending windows as shown below. Click OK.
Finally, add some navigation buttons to the Tabular screen for returning to the Main Screen (HOME), to the Panelboard (Go to Panel), or to the Large Faceplate screen (Go back to Faceplate). Link each button to the appropriate screen, and you???re all set!

Complete the application by developing the Faceplate and Tabular screens for each of the four trip units and that???s it ??? we???ve just developed a PMCS application using the GE Wonderware Wizards.
65

(This page left blank intentionally)

Features of GE Large Faceplate
Wizards
About the Large Faceplate Wizards
This chapter contains descriptions of the functions available with each of the GE Large Faceplate wizards. While a majority of the most popular data available at each device have been made available in the Wizards, some functions available with the actual devices are not provided in the Large Faceplate representations, such as the following:
???Test Mode or Simulation Mode on some devices is not fully supported
???Details on status/alarm/trips other than the information displayed by the front LEDs and a brief text message (see Tabular Data Screens for detailed status/alarm/trip information)
???Any flashing status messages which may be produced by a device
???Some actual values are not displayed on the Large Faceplate Wizard, but can be found on Tabular Data Screen Wizards
Users should be aware that not all values displayed by the GE Large Faceplate Wizards are automatically updated. Also, some rapidly changing values, especially those requiring calculation, cannot be displayed as rapidly on the wizard as on the actual device???s screen.
For a more detailed description of the functions of a device, see the user???s guide for that device.
67
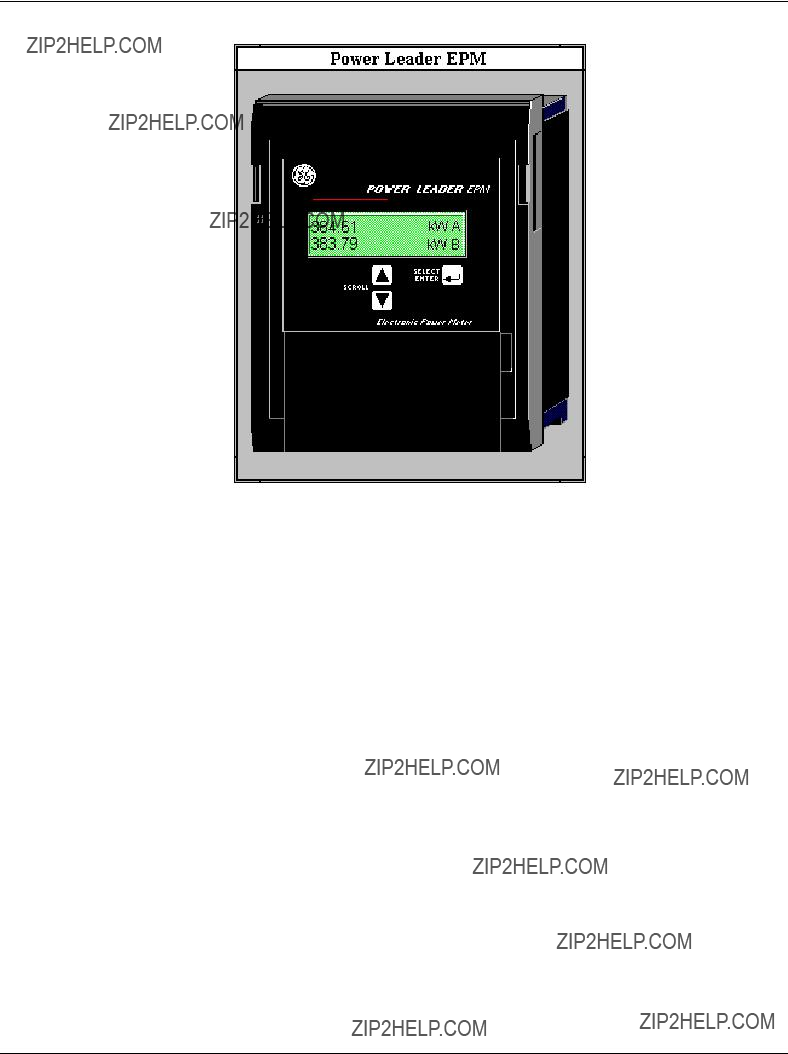
POWER LEADER EPM
The large faceplate representation of the POWER LEADER EPM provides the following animated functions:
Table 1. PLEPM Faceplate animated functions.
The electrical parameters and status information displayed by the EPM are listed below for both the normal and alternate scrolls. Note that the displayed parameters

differ depending on whether the EPM is configured as Wye or Delta. Please note that the Normal Scroll Delta and Alternate Scroll Delta lists contain several parameters marked with an asterisk; these parameters were included in the wizard for programming reasons, but are not valid for Delta configurations and should not be used.
69


Spectra MicroVersaTrip Trip Unit
The large faceplate representation of the Spectra MicroVersaTrip trip unit provides the following animated functions:
Table 2. Spectra MVT Faceplate animated functions.
71

Enhanced
The large faceplate representation of the Enhanced
Table 3.
73

Enhanced
The large faceplate representation of the Enhanced
Table 4.

75

POWER LEADER Meter
The large faceplate representation of the POWER LEADER Meter provides the following animated functions:
Table 5. PL Meter Faceplate animated functions.

77

Spectra ECM
The large faceplate representation of the Spectra ECM provides the following animated functions:
Table 6. Spectra ECM Faceplate animated functions.
The modes and the parameters available in each mode are as follows:

79

EPM 3710 Meter
The large faceplate representation of the EPM 3710 provides the following animated functions:
Table 7. EPM 3710 Faceplate animated functions.
The parameters displayed by the PHASE button are listed in the following table.
The parameters displayed by the FUNCTION button are listed in the following table. If any of the import or export values are zero, they are not displayed and the next nonzero value is shown. When any of these parameters are displayed, the AMPS portion of the display window is used to allow display of the complete value.

81

EPM 3720 Meter
The large faceplate representation of the EPM 3720 meter provides the following animated functions:
Table 8. EPM 3720 Faceplate animated functions.
The parameters displayed by the PHASE button are listed in the following table.
83

EPM 7700 Meter
The large faceplate representation of the EPM 7700 meter provides the following animated functions:
Table 9. EPM 7700 Faceplate animated functions.
The parameters displayed by the various data screen buttons are listed in the following table.

85

**NOTE: If the Sliding Demand Reset is initiated, or a SWD setup register is changed, SWD values are ???N/A??? in the meter until the number of

269 Plus Motor Management Relay
The large faceplate representation of the 269 Plus provides the following animated functions:
87

Table 10. 269+ Faceplate animated functions.
The following table lists the pages that can be accessed with the PAGE buttons, with the parameters available in each page that can be accessed with the LINE buttons.

89


91
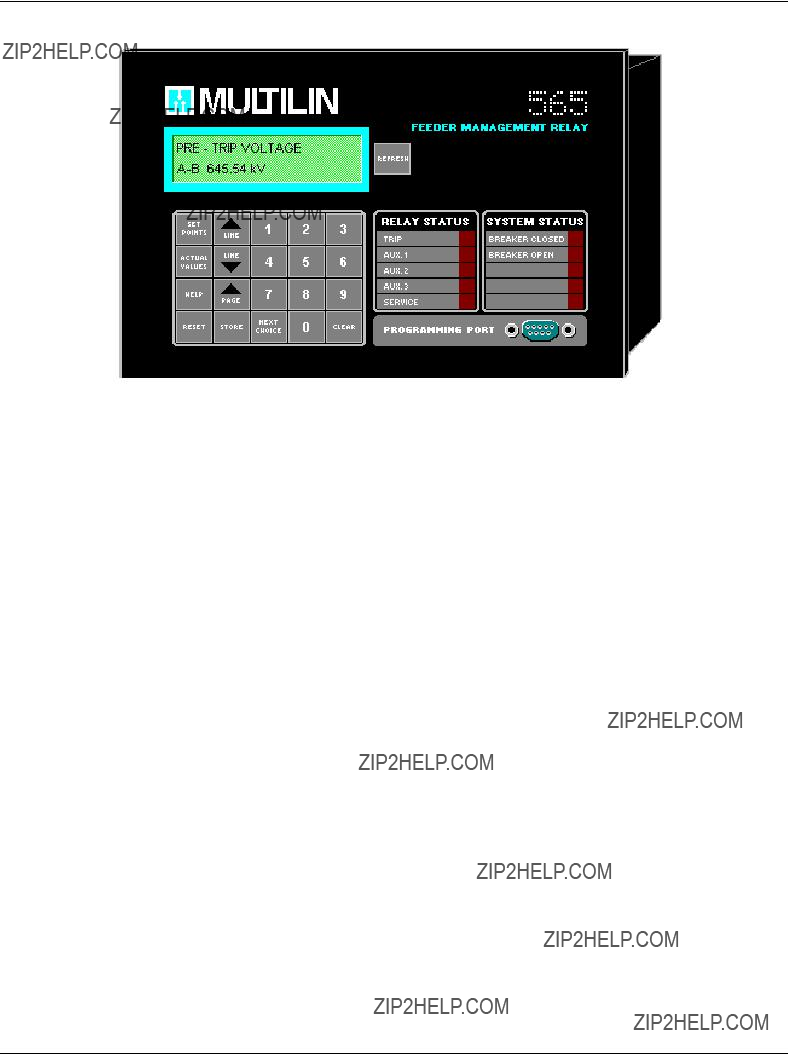
565 Feeder Management Relay
93


95


97

(This page left blank intentionally)

Features of Tabular Data Screen
Wizards
Introduction
This chapter describes the features available with tabular data screens. The set of features basic to all tabular data screens is described first, then any unique features are described for each device.
Features of Tabular Data Screens
The upper
The middle area on the
The buttons on the
???The Help button calls up the PMCS help file with regard to the current device.
???The Exit button closes the tabular data screen.
???The Events button starts or jumps to the PMCS Event Logger client program and displays its window in the foreground.
???The Trend button displays the trend window that was specified in the configuration dialog. The button will be disabled if no trend window was specified during configuration of the Wizard.
???The Wave button runs the PMCS Waveform Capture client program for that device. This button is only enabled for devices supporting waveform capture.
???The Setup button displays the trend window that was specified in the configuration dialog. The button will be disabled if no setup window was specified during configuration of the Wizard.
99

The right side of the screen contains a display of the device data. The tabs at the bottom enable you to select among the various data tables which can be displayed. The number of tabs (screens) varies according to the type and amount of data available from the device. The two main types of data are metering, which shows the data being monitored by the device, and setup, which is used to configure the device. Other tabs may be available depending on the device???s capabilities.
Some devices have push buttons that reset events or clear accumulated data; these will be discussed below in the individual device sections. These functions are represented by

Power Leader EPM
The Power Leader EPM Tabular Data Screen wizard provides the following command buttons:
Table 12. PLEPM Tabular data screen commands.
Another feature to bear in mind when working with the PLEPM tabular wizard is:
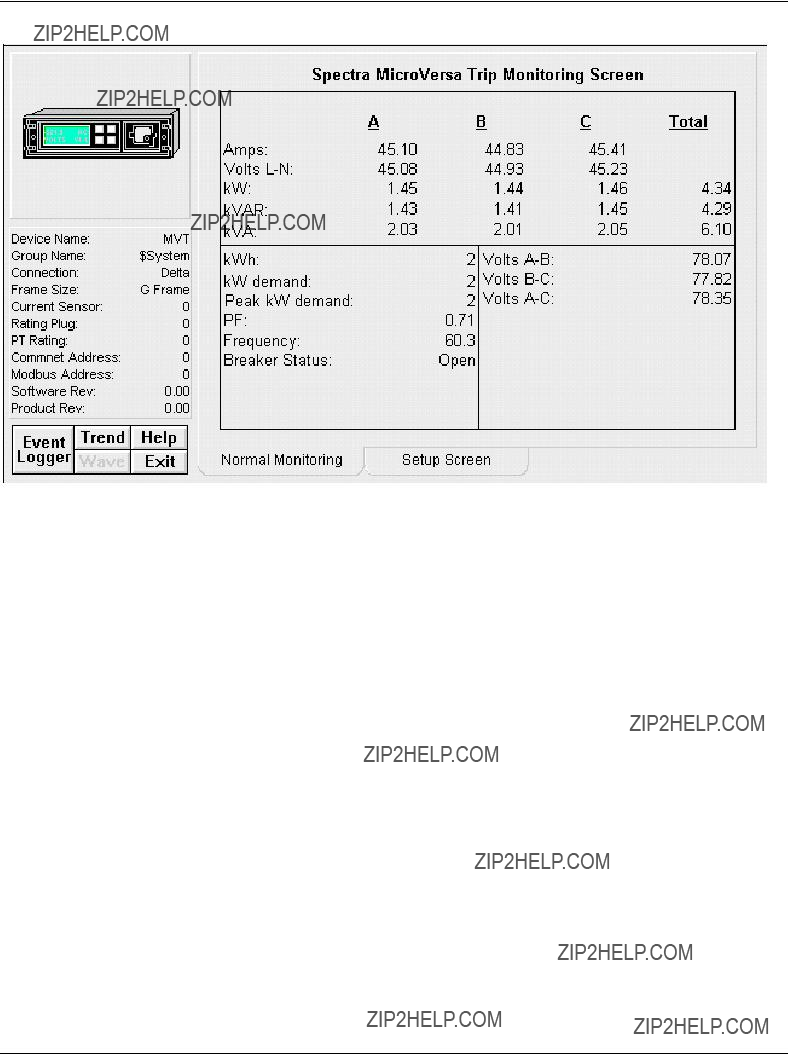
???The Normal Metering screen displays one of two tables depending on whether the meter is configured as Delta or Wye.
101
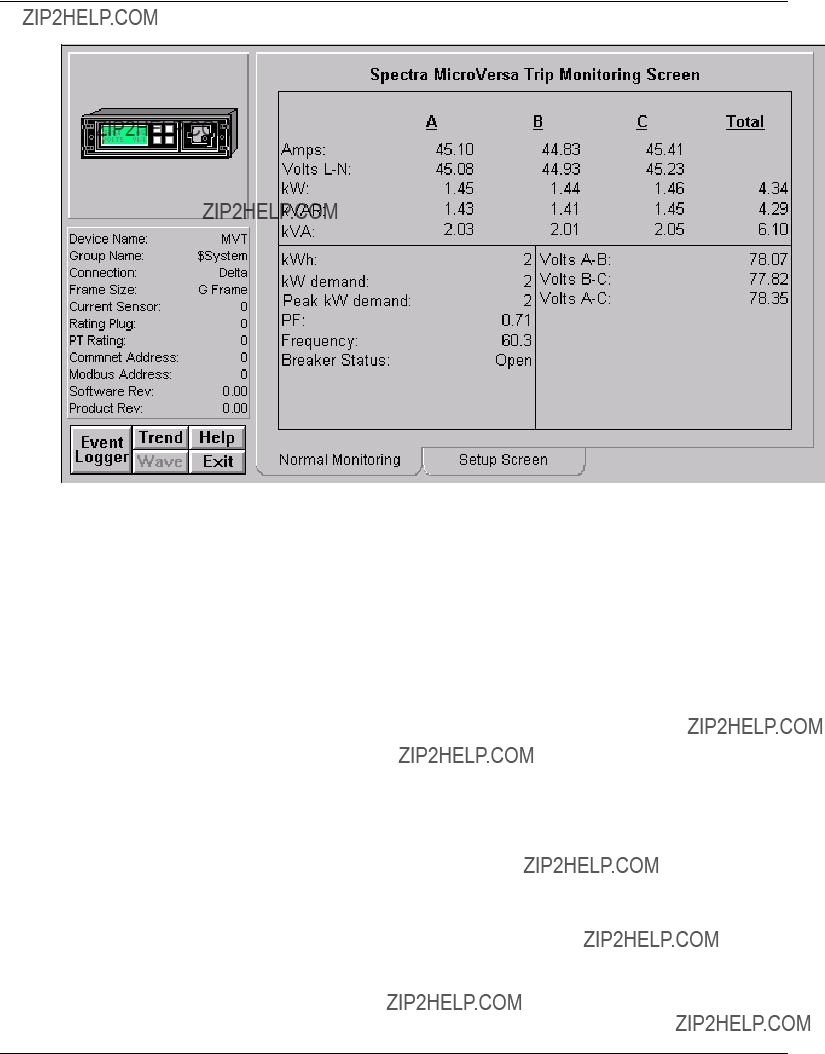
Spectra MicroVersaTrip
The Spectra MicroVersaTrip Tabular Data Screen wizard provides the following command buttons on the Setup screen:
Table 13. Spectra MVT Tabular data screen commands.
Another feature to bear in mind when working with the Spectra MicroVersaTrip tabular wizard is:
???The data entry field for the energy demand interval can be set to values of 5 to 60 minutes in increments of 5 minutes.
Enhanced
The Enhanced
Table 14.
103

Enhanced
The Enhanced
Table 15.

POWER LEADER Meter
The POWER LEADER Meter Tabular Data Screen wizard provides three push buttons on the Command screen:
Table 16. PL Meter Tabular data screen commands.
105
Spectra ECM
The Spectra ECM Tabular Data Screen wizard performs the following actions with push buttons on the Command screen:
Table 17. Spectra ECM Tabular data screen commands.

MDP Digital Overcurrent Relay
The feature to bear in mind when working with the MDP tabular wizard is:
???On the Setup screen, you must enter a value into the CT Ratio box. This value is multiplied by the values in the amp registers to convert the latter into user units. If you do not enter a value for the CT Ratio, the message ???CT Ratio has not been entered??? appears on the bottom of the Tabular Data Screen and on the Large Faceplate wizard.
Monitoring Tab
The MDP Monitoring Screen shows the following:
???Metering values of RMS Current, RMS Trip Current and Phase Trip Status
???Trip Time
???Status
???External Inputs
The message ???CT Ratios has not been entered!??? will appear when no CT Ratio entered on the Setup tab. Click on Setup Screen Tab to enter the CT Ratio.
107

Command Tab
The MDP Tabular Data Screen wizard has three command buttons:
Table 18. MDP Tabular data screen commands.
The MDP Command Screen shows 3 buttons:
???Open Breaker: Opens the Breaker
???Close Breaker: Closes the Breaker
???Reset Fault: Clears the Event Table in the MDP
The screen also shows the Breaker Status, for example OPEN.
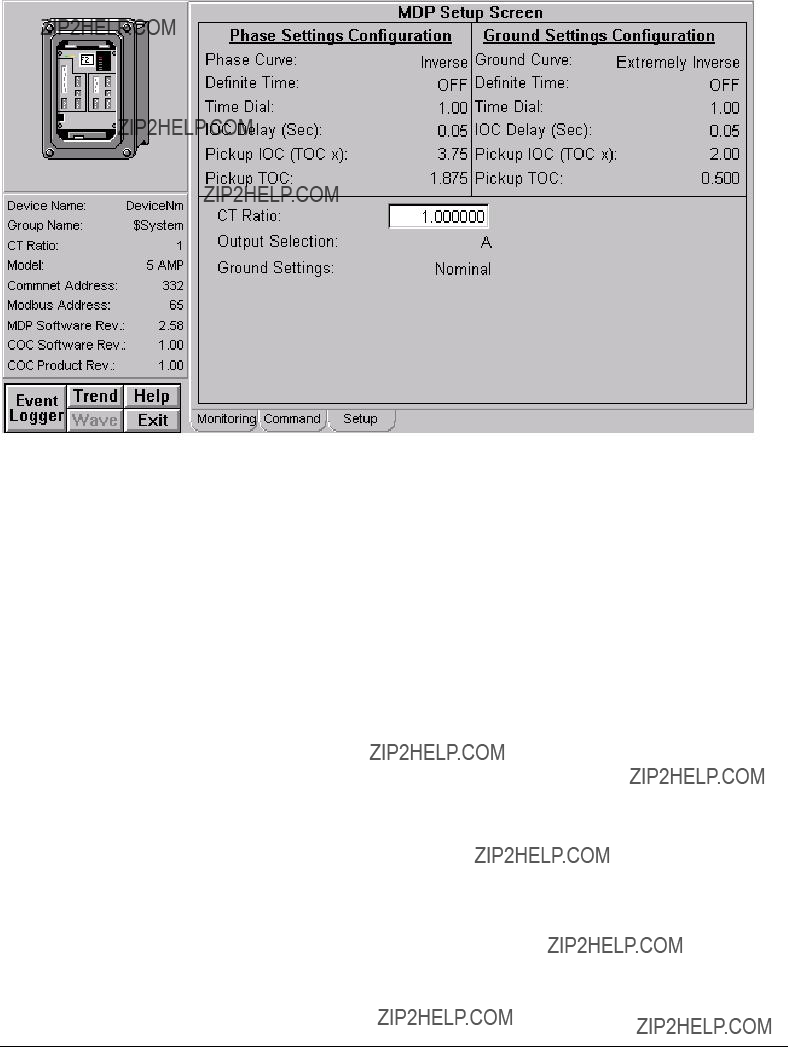
Setup Tab
The MDP Setup Screen shows:
???Phase Settings Configuration
???Ground Settings Configuration
You must enter CT Ratio in the relevant field.
109

PQM (Power Quality Meter)
All six function buttons under the Info box are enabled for the PQM.
The PQM Tabular Data Screen wizard has nine command buttons, described below.
Table 19. PQM Tabular data screen commands.
See the PQM Instruction Manual (Chapter 5, Actual Values) for information on the display of data values under different device configurations. Values not configured for use are displayed as N/A.
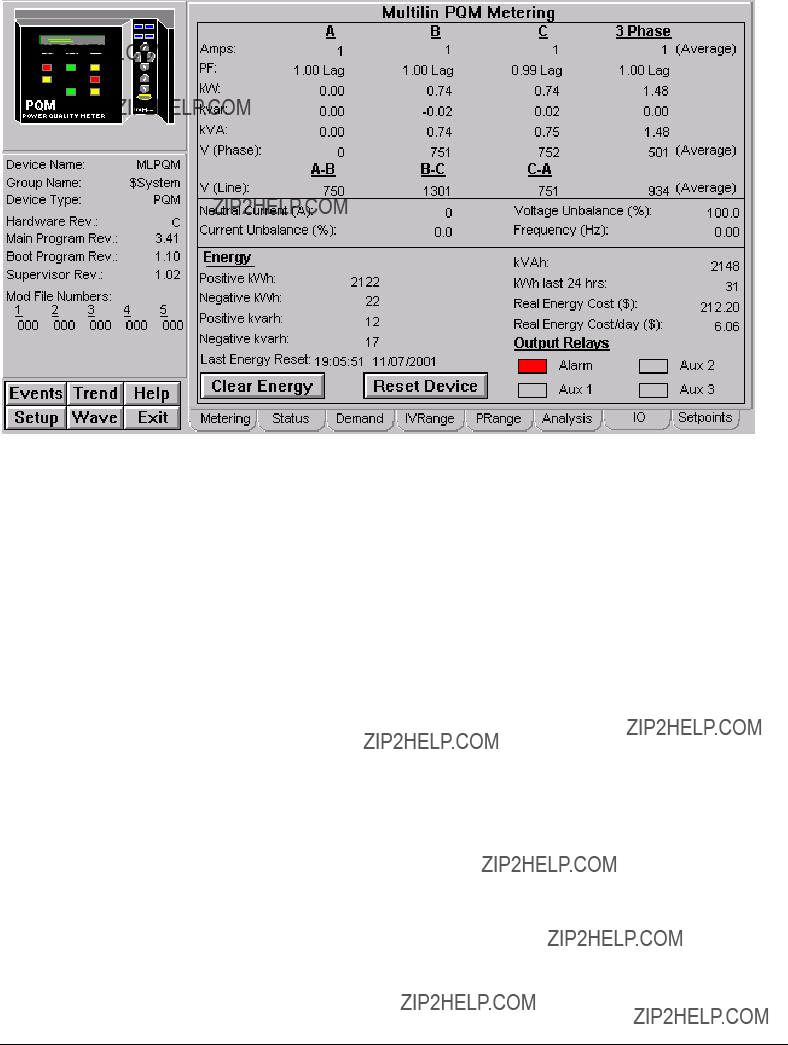
Metering Tab
The Multilin PQM Metering tab shows:
???Metering values: For A, B, C and 3 Phase
???Energy: In various values
???Output Relays: Alarm, Aux 1, Aux 2 and Aux 3
The Clear Energy button, when clicked, will clear all energy values. The Reset Device button, when clicked, will reset the Device.
111

Status Tab
The Multilin Status tab shows the status of Alarms, Aux1, Aux2, Aux3 Relays.
Demand Tab
The Multilin PQM Demand screen shows :
???Demand Current & Power
???Peak Demand
???Minimum and Maximum Frequency and their Time Stamps.
The Clear Max Demand Values button, when clicked, will clear all the maximum demand values. The Clear Frequency Values button, when clicked, will clear all the frequency values.
113

IV Range Tab
The Multilin PQM IV Range tab shows the Minumum and Maximum Current, Voltage Values.
The Clear Current Min/Max button, when clicked, will clear all the minimum and maximum values of the current. The Clear Voltage Min/Max button, when clicked, will clear all the minimum and maximum values of voltage.

P Range Tab
The Multilin PQM Power Range screen shows the Power minimum and maximum values.
The Clear Power Min/Max button, when clicked, will clear all the minimum and maximum values of the power.
115

Analysis Tab
The Multilin PQM Power Analysis screen shows:
???Power Quality Values
???Total Harmonic Distortion
???THD Max
The Clear Max THD Values button, when clicked, will clear all maximum THD values.

IO Tab
The Multilin PQM Inputs and Outputs screen shows:
???Digital Input Switches
???Output Relays
???Analog Input
???Switch Input Pulse Counters
The Reset Pulse Counter button, when clicked, will reset all the pulse counter values.
117

Setpoints Tab
The Multilin PQM System Setpoints screen shows:
???Current Demand Type
???Current Demand Time Interval (m)
???Power Demand Type
???Power Demand Time Interval (m)
???Energy Cost Per kWh (cents)
???Neutral Current Sensing
???Analog Input Main Relay
???Analog Input Alt Relay
???Switch A Function
???Switch B Function
???Switch C Function
???Switch D Function

Motor Manager II (MMII)
Five of the six function buttons under the Info box are enabled for the MMII; the
Wave button is not supported for the MMII.
The MMII Tabular Data Screen wizard has four command buttons, described below.
Table 20. MMII Tabular data screen commands.
See the MMII's Instruction Manual (Chapter 5, Actual Values) for information on the display of data values under different device configurations. Values not configured for use are displayed as N/A.
119

EPM 3710 Meter
The EPM 3710 Tabular Data Screen wizard provides the following special features:
???The Normal Metering Values screen has a label that displays either kVA Demand or Amps Demand, depending on how the meter is configured.
???The Setpoints screen has two scroll buttons that determine which setpoint is displayed.
???The Setup tab contains a field "Iout Key" corresponding to the Iout Key display on the actual device. On the actual device, this field displays text messages such as "Voltage A" or "Current C". In the Tabular Data Screen wizard, these messages are presented as a numeric code and must be referenced against the following table.

EPM 3720 Meter
The EPM 3720 Tabular Data Screen wizard has several special features. You can use the Setup 1, Setup 2, and Setpoints screens to change the meter configuration. Values displayed in white boxes are changeable. Some are changed by clicking on the displayed value, while others provide scroll buttons, and some have both.
???The Download and Refresh buttons on the Setup 1 and Setup 2 screens upload and download the values for all of the setup parameters.
???The Download and Refresh buttons on the Setpoints screen upload and download all of the setpoints from the device.
???The Reset Energy Integrators and Reset All Min/Max buttons on the Setup 1 screen provide the named functions.
???The Sliding Demand tab supports downloading of up to 10 sliding demand measurements to the device. See Appendix B for information on setting the sliding demand keys.
To change setpoints at the device, first press the Refresh button to upload current setpoint values from the device (otherwise the defaults are shown and used for download). Modify setpoints as desired, then press the Download button to send all setpoints to unit.
When you first open the EPM 3720 Tabular Data Screen, you may see values of zero in all fields. The EPM 3720 Tabular Data Screen requires some user interaction (such as pressing a key) to update its values.
121

EPM 7300 Meter
The EPM 7300 Tabular Data Screen wizard has several special features. You can use the Setup screen to change the meter configuration. Values displayed in white boxes are changeable. Some are changed by clicking on the displayed value, while others are changed by clicking on the associated scroll button. The Download and Refresh buttons on the setup screen upload and download all of the setpoints from the device.
To change setpoints at the device, first press the refresh button to upload current setpoint values from the device (otherwise the defaults are shown and used for download). Modify setpoints as desired, then press the download button to send all setpoints to the unit.
The EPM 7300 Tabular Data Screen???s command buttons are described below:
Table 21. EPM 7300 Tabular data screen commands.
Metering Tab
The 7300 ION Normal Metering Values screen shows the metering values:
???A, B and C
???Three Phase Values
???Voltage Imbalance
???Current Imbalance
???Frequency (Hz)
???Phase Reversal
???Energy
The Reset Energy button will reset the energy.
123

Min/Max Tab
The 7300 ION Min/Max/Demand Values screen shows:
???Minimum and maximum metering values
???Digital Outputs
1.By clicking on the Text box provided, a popup box will be appeared where text can be entered.
2.By clicking on Force ON and Force OFF the status can be seen as ON or OFF respectively.
???Sliding Window Demand and Predicted Windows Demand
The Reset Sliding Demand button, when clicked, will reset all Sliding Demand values in the device. The Reset Min/Max button, when clicked, will reset all Min/Max values in the device.

Setup Tab
The 7300 ION Setup screen shows various setup values of the device such as Volts Mode, Phase Order, PT Secondary and CT Secondary.
The Download button, when clicked, will download all relevant values in the device.
The Refresh button, when clicked, will refresh all the values coming from the device.
125

EPM 7330 Meter
The EPM 7330 Tabular Data Screen wizard has several special features. You can use the Setup screen to change the meter configuration. Values displayed in white boxes are changeable. Some are changed by clicking on the displayed value, while others are changed by clicking on the associated scroll button. The Download and Refresh buttons on the setup screen upload and download all of the setpoints from the device.
To change setpoints at the device, first press the refresh button to upload current setpoint values from the device (otherwise the defaults are shown and used for download). Modify setpoints as desired, then press the download button to send all setpoints to the unit.
The EPM 7330 Tabular Data Screen???s command buttons are described below:
Table 22. EPM 7330 Tabular data screen commands
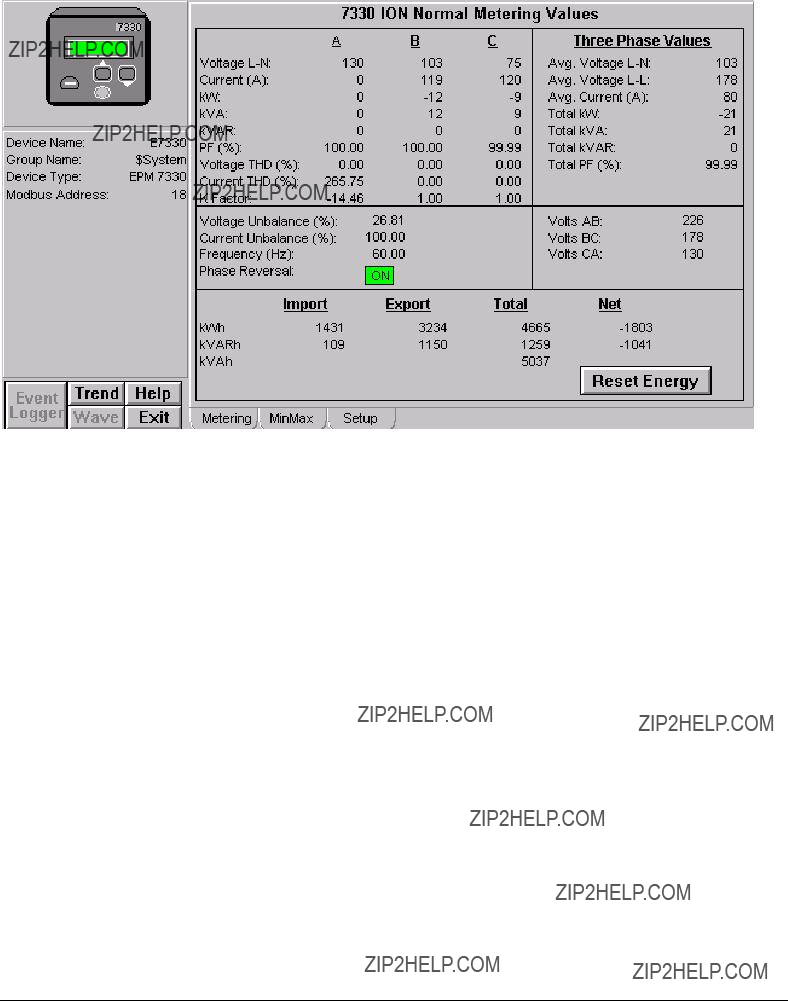
Metering Tab
The 7330 ION Normal Metering Values screen shows the metering values:
???A, B and C
???Three Phase Values
???Voltage Imbalance
???Current Imbalance
???Frequency (Hz)
???Phase Reversal
???Energy
The Reset Energy button will reset the energy.
127

Min/Max
The 7330 ION Min/Max/Demand Values screen shows:
???Minimum and maximum metering values
???Digital Outputs
1.By clicking on the Text box provided, a popup box will be appeared where text can be entered.
2.By clicking on Force ON and Force OFF the status can be seen as ON or OFF respectively.
???Sliding Window Demand and Predicted Windows Demand
The Reset Sliding Demand button, when clicked, will reset all Sliding Demand values in the device. The Reset Min/Max button, when clicked, will reset all Min/Max values in the device.

Setup Tab
The 7330 ION Setup screen shows various setup values of the device such as Volts Mode, Phase Order, PT Secondary and CT Secondary.
The Download button, when clicked, will download all relevant values in the device.
The Refresh button, when clicked, will refresh all the values coming from the device.
129
EPM 7500/7600 Meter
The EPM 7500/7600 Tabular Data Screen wizard has several special features. You can use the Setup screen to change the meter configuration. Values displayed in white boxes are changeable. Some are changed by clicking on the displayed value, while others are changed by clicking on the associated scroll button. The Download and Refresh buttons on the setup screen upload and download all of the setpoints from the device.
To change setpoints at the device, first press the refresh button to upload current setpoint values from the device (otherwise the defaults are shown and used for download). Modify setpoints as desired, then press the download button to send all setpoints to the unit.
In the following pages, each of the 7500/7600 Meter???s Tabular Data Screen Wizards??? tabs will be displayed and detailed.
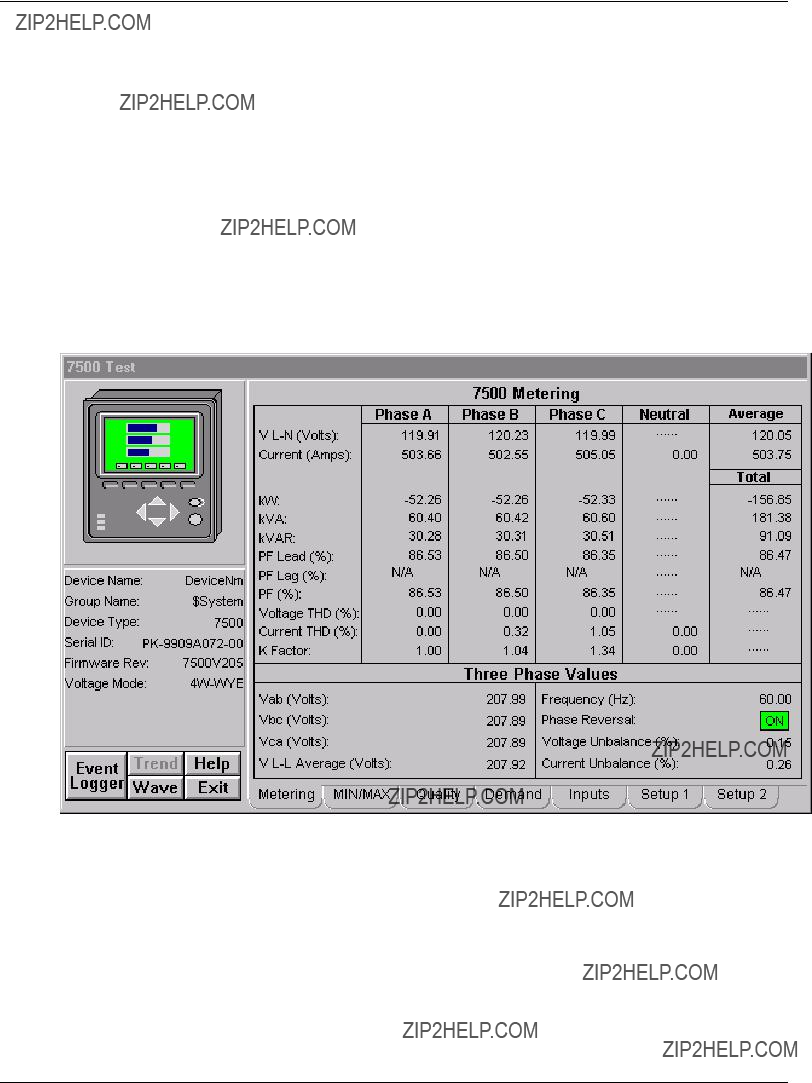
Metering Tab
EPM 7500/7600 Meter - Metering Data Screen
The Metering tab displays the following metered values from the EPM 7500/7600.
???Vln A, B: n/a when Voltage Mode is DELTA
???Vln C: n/a when Voltage Mode is DELTA or SINGLE
???Vln Avg: n/a when Voltage Mode is DELTA
???Vll AB
???Vll BC, CA, and Avg: n/a when Voltage Mode is SINGLE
???I A, B, Neutral, and Avg

???I C: n/a when Voltage Mode is SINGLE
???KW A, B: n/a when Voltage Mode is DELTA
???KW C: n/a when Voltage Mode is DELTA or SINGLE
???KW Total
???KVA A, B: n/a when Voltage Mode is DELTA
???KVA C: n/a when Voltage Mode is DELTA or SINGLE
???KVA Total
???KVAR A, B: n/a when Voltage Mode is DELTA
???KVAR C: n/a when Voltage Mode is DELTA or SINGLE
???KVAR Total
???Power Factor Lead A, B: n/a when Voltage Mode is DELTA or PF is Lagging
???Power Factor Lead C: n/a when Voltage Mode is DELTA or SINGLE or PF is Lagging
???Power Factor Lead Total: n/a when PF is Lagging
???Power Factor Lag A, B: n/a when Voltage Mode is DELTA or PF is Leading
???Power Factor Lag C: n/a when Voltage Mode is DELTA or SINGLE or PF is Leading
???Power Factor Lag Total: n/a when PF is Leading
???Power Factor Total A, B: n/a when Voltage Mode is DELTA
???Power Factor Total C: n/a when Voltage Mode is DELTA or SINGLE
???Power Factor Total
???Total Harmonic Distortion ??? Voltage A, B, and C: n/a when Source is n/a.
???Total Harmonic Distortion ??? Current A, B, C, and Neutral: n/a when Source is n/a.
???K Factor A, B, C, and Neutral: n/a when Source is n/a.
???Vab, Vbc, Vca
???Voltage Unbalance
???Current Unbalance
???Frequency
???Phase Reversal (On, Off) : n/a when Voltage Mode is SINGLE
131

Min/Max Tab
EPM 7500/7600 Meter - Min/Max Tab
The Minimum/Maximum Values tab displays a variety of minimum and maximum values recorded by the EPM 7500/7600. Select Show Minimum or Show Maximum buttons to display either the minimum or maximum values for the displayed parameters. To reset all min/max values, select the Reset Min/Max button.
Min/Max values may be displayed for the following parameters:
Phase A, B, C, Neutral and Average Values
???Vln A, B: n/a when Voltage Mode is DELTA
???Vln C: n/a when Voltage Mode is DELTA or SINGLE
???Vln Avg: n/a when Voltage Mode is DELTA
???Vll AB
???Vll BC, CA, and Avg: n/a when Voltage Mode is SINGLE
???I A, B, Neutral, and Avg
???I C: n/a when Voltage Mode is SINGLE
???Total Harmonic Distortion ??? Voltage A, B, and C: n/a when Source is n/a.
???Total Harmonic Distortion ??? Current A, B, C, and Neutral: n/a when Source is n/a.
???K Factor A, B, C, and Neutral: n/a when Source is n/a.
???Vab, Vbc, Vca
???Power Factor Lead Total: n/a when PF is Lagging
???Power Factor Lag Total: n/a when PF is Leading
???Voltage Unbalance
???Frequency
Power Quality Tab
EPM 7500/7600 Meter - Power Quality Tab
The Power Quality tab displays the following power quality values from the EPM 7500/7600.
Symmetric Components
???Zero Sequence Phase and Magnitude for Current and Voltage
???Positive Sequence Phase and Magnitude for Current and Voltage
???Negative Sequence Phase and Magnitude for Current and Voltage
Disturbance Counts
???Sag / Swell Counter
Relative Setpoints
???Over KW Sliding Window Demand Status
???Over Current Phase A Status
???Over Current Phase B Status
???Over Current Phase C Status
???Over Voltage Unbalance Status
*Note: no color code is used for the Relative Setpoint Status.
The Power Quality tab also provides push buttons for performing the following commands:
Reset Sag Swell Disturbance Counter ??? Resets Sag Swell Counter.
133

Enable/Disable Sag Swell ??? Enables or Disables Sag Swell Tracking.
Enable/Disable Over KW SWD ??? Enables or Disables Over Real Power Sliding Window Demand for Relative Setpoint Tracking.
Enable/Disable Over Current ??? Enables or Disables Over Current for Phases A, B, and C for Relative Setpoint Tracking.
Enable/Disable Over Vunb ??? Enables or Disables Over Voltage Unbalance for Relative Setpoint Tracking.
Demand Tab
EPM 7500/7600 Meter - Demand Tab
The Demand tab displays the following demand values from the EPM 7500/7600.
Energy
???Real Energy Import, Export, Total, and Net
???Reactive Energy Import, Export, Total, and Net
???Apparent Energy Total
Demand
???Real Power Sliding Window Demand, Predicted Demand, and Thermal Demand
???Reactive Power Sliding Window Demand, Predicted Demand, and Thermal Demand
???Apparent Power Sliding Window Demand, Predicted Demand, and Thermal Demand
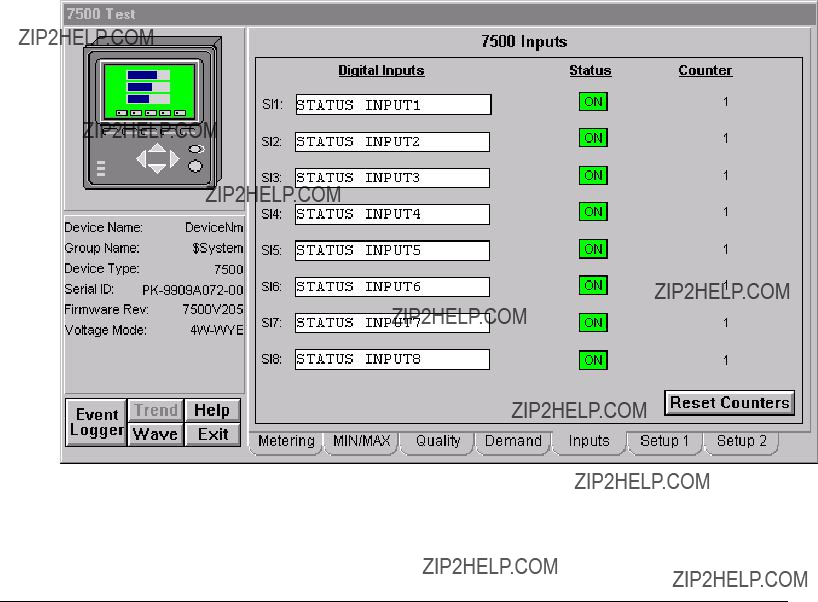
???Average RMS Current Sliding Window Demand, Predicted Demand, and Thermal Demand
Minimum/Peak Demand
???Minimum or Peak Real Power Sliding Window Demand, Total Demand, and Thermal Demand
???Minimum or Peak Reactive Power Sliding Window Demand, Total Demand, and Thermal Demand
???Minimum or Peak Apparent Power Sliding Window Demand, Total Demand, and Thermal Demand
The Demand tab also provides push buttons for performing the following commands: Reset Energy ??? Resets Energy Demand values identified above.
Reset SWD??? Resets Sliding Window Demand values identified above. Reset Thermal ??? Resets Thermal Demand values identified above. Reset Peak ??? Resets Peak Demand values identified above.
The Minimum/Peak panel's Show Maximum and Show Minimum buttons can be used to toggle the display between minimums and peaks.
Inputs Tab
EPM 7500/7600 Meter - Inputs Tab
The Inputs tab displays the following values from the EPM 7500/7600.
Digital Inputs
135
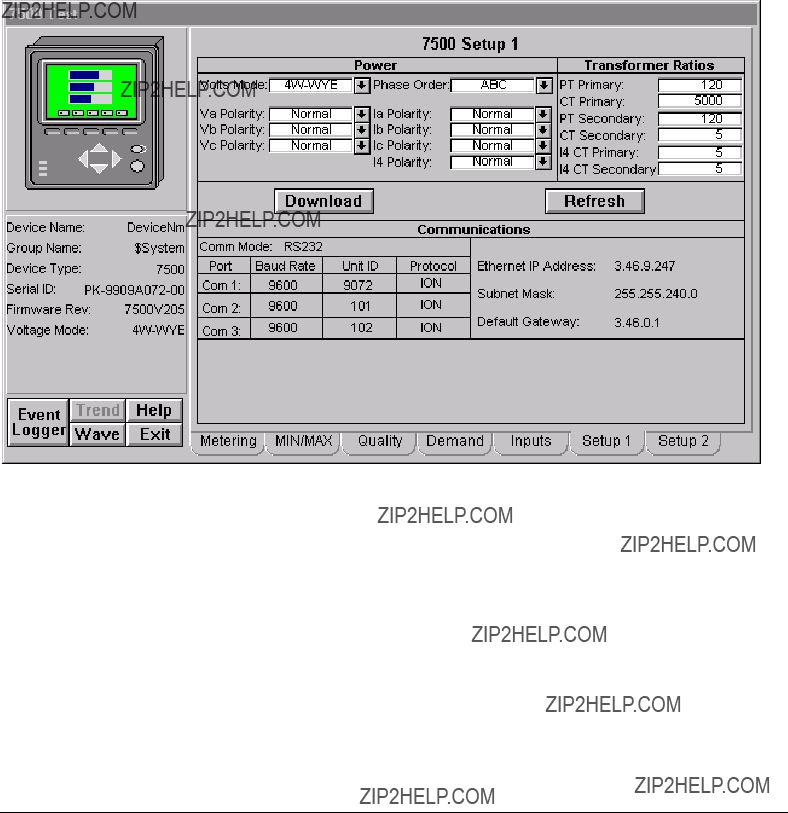
???Status (On, Off) for Status Inputs (SI)
???Counters for
The Inputs tab also provides push buttons for performing the following commands: Reset Counters ??? Resets Digital Input Status Counters for
The Inputs tab also provides retentive memory inputs for the following:
Digital Input Names for
Setup 1 Tab
EPM 7500/7600 Meter - Setup 1 Tab
The Setup 1 tab displays the following demand values from the EPM 7500/7600.
Power Settings
???Volts Mode
???Phase Order
???Voltage Polarity for A, B, and C
???Current Polarity for A, B, C, and Neutral
Transformer Ratio Settings
???PT and CT Primary
???PT and CT Secondary

???Neutral CT Primary and Secondary
Communications
???Baud Rate for Comm 1, 2, and 3.
???Unit ID for Comm 1, 2, and 3.
???Protocol for Comm 1, 2, and 3.
???Mode for Comm 1.
???IP Address, Subnet Mask, and Default Gateway.
The Setup 1 tab also provides push buttons for performing the following commands:
Download ??? Executes a script to check for values that have changed and downloads those values to the device via the GE 7700 Gateway.
Refresh ??? Executes a script to upload all of the meter values for the settings on the screen.
Note: Be sure to click the Refresh button prior to changing or downloading any settings to the EPM7500 or EPM7600, as the latest settings may not be displayed.
137
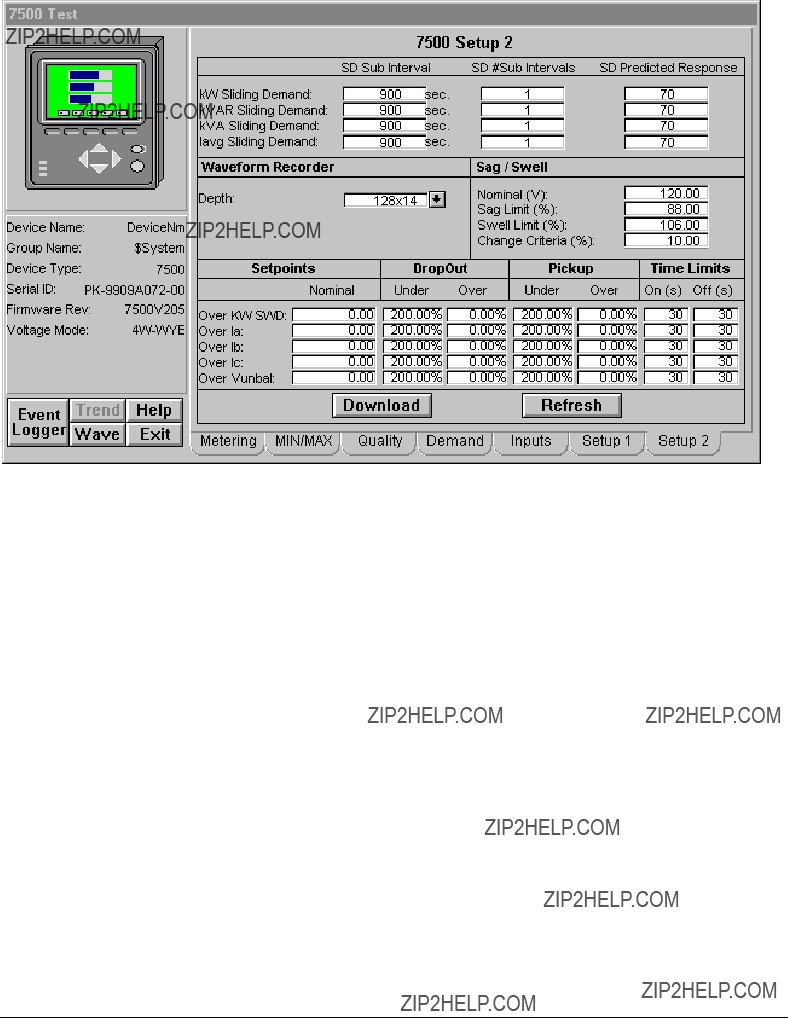
Setup 2 Tab
EPM 7500/7600 Meter - Setup 2 Tab
The Setup 2 tab displays the following demand values from the EPM 7500/7600.
Sliding Window Demand Settings
???Sliding Demand Sub Interval Settings for KW, KVAR, KVA, and Iavg.
???Sliding Demand Number of Sub Intervals for KW, KVAR, KVA, and Iavg.
???Sliding Demand Predicted Response for KW, KVAR, KVA, and Iavg.
Waveform Recorder Settings
???Depth of Waveform Recorder
Sag / Swell / Transient Settings
???Sag / Swell Nominal
???Sag Limit
???Swell Limit
???Change Criteria
Relative Setpoint Settings
???Nominal value for Over KW, Over Current, and Over Vunbal.
???Under Dropout for Over KW, Over Current, and Over Vunbal.
???Over Dropout for Over KW, Over Current, and Over Vunbal.
???Under Pickup for Over KW, Over Current, and Over Vunbal.

???Over Pickup for Over KW, Over Current, and Over Vunbal.
???Time On for Over KW, Over Current, and Over Vunbal.
???Time Off for Over KW, Over Current, and Over Vunbal.
The Setup 2 tab also provides push buttons for performing the following commands:
Download??? Executes a script to check for values that have changed and downloads those values to the device via the GE 7700 Gateway.
Note: Be sure to click the Refresh button prior to changing or downloading any settings to the EPM7500 or EPM7600, as the latest settings may not be displayed.
139

EPM 7700 Meter
The EPM 7700 Tabular Data Screen wizard has several special features. You can use the Setup screen to change the meter configuration. Values displayed in white boxes are changeable. Some are changed by clicking on the displayed value, while others are changed by clicking on the associated scroll button. The Download and Refresh buttons on the setup screen upload and download all of the setpoints from the device.
To change setpoints at the device, first press the refresh button to upload current setpoint values from the device (otherwise the defaults are shown and used for download). Modify setpoints as desired, then press the download button to send all setpoints to the unit.
In the following pages, each of the 7700 ION Meter???s Tabular Data Screen Wizards??? tabs will be displayed and detailed.
Metering Tab
EPM 7700 ION Meter - Metering Data Screen
The Metering tab displays the following metered values from the EPM 7700.
???Vln A, B: n/a when Voltage Mode is DELTA
???Vln C: n/a when Voltage Mode is DELTA or SINGLE
???Vln Avg: n/a when Voltage Mode is DELTA
???I A, B, Neutral, and Avg
???I C: n/a when Voltage Mode is SINGLE
???Vll AB
???Vll BC, CA, and Avg: n/a when Voltage Mode is SINGLE

???KW A, B: n/a when Voltage Mode is DELTA
???KW C: n/a when Voltage Mode is DELTA or SINGLE
???KW Total
???KVAR A, B: n/a when Voltage Mode is DELTA
???KVAR C: n/a when Voltage Mode is DELTA or SINGLE
???KVAR Total
???KVA A, B: n/a when Voltage Mode is DELTA
???KVA C: n/a when Voltage Mode is DELTA or SINGLE
???KVA Total
???Power Factor Lead A, B: n/a when Voltage Mode is DELTA or PF is Lagging
???Power Factor Lead C: n/a when Voltage Mode is DELTA or SINGLE or PF is Lagging
???Power Factor Lead Total: n/a when PF is Lagging
???Power Factor Lag A, B: n/a when Voltage Mode is DELTA or PF is Leading
???Power Factor Lag C: n/a when Voltage Mode is DELTA or SINGLE or PF is Leading
???Power Factor Lag Total: n/a when PF is Leading
???Power Factor Total A, B: n/a when Voltage Mode is DELTA
???Power Factor Total C: n/a when Voltage Mode is DELTA or SINGLE
???Power Factor Total
???Total Harmonic Distortion ??? Voltage A, B, and C: n/a when Source is n/a.
???Total Harmonic Distortion ??? Current A, B, C, and Neutral: n/a when Source is n/a.
???K Factor A, B, C, and Neutral: n/a when Source is n/a.
???Voltage Unbalance
???Current Unbalance
???Frequency
???Phase Reversal (On, Off) : n/a when Voltage Mode is SINGLE
141

Min/Max Tab
EPM 7700 ION Meter - Min/Max Tab
The Minimum/Maximum Values tab displays a variety of minimum and maximum values recorded by the EPM 7700. Select Show Minimum or Show Maximum buttons to display either the minimum or maximum values for the displayed parameters. To reset all min/max values, select the Reset Min/Max button.
Min/Max values may be displayed for the following parameters:
???Vln A, B: n/a when Voltage Mode is DELTA
???Vln C: n/a when Voltage Mode is DELTA or SINGLE
???Vln Avg: n/a when Voltage Mode is DELTA
???I A, B, Neutral, and Avg
???I C: n/a when Voltage Mode is SINGLE
???Vll AB
???Vll BC, CA, and Avg: n/a when Voltage Mode is SINGLE
???KW Total
???KVAR Total
???KVA Total
???Power Factor Lead Total: n/a when PF is Lagging
???Power Factor Lag Total: n/a when PF is Leading
???Power Factor Total Total
???Total Harmonic Distortion ??? Voltage A, B, and C: n/a when Source is n/a.
???Total Harmonic Distortion ??? Current A, B, C, and Neutral: n/a when Source is n/a.
???K Factor A, B, C, and Neutral: n/a when Source is n/a.
???Voltage Unbalance
???Frequency
Power Quality Tab
EPM 7700 ION Meter - Power Quality Tab
The Power Quality tab displays the following power quality values from the EPM 7700.
Disturbance Monitoring
???Sag / Swell Counter
???Transient Counter
???Over KW Sliding Window Demand Status
???Over Current Phase A Status
???Over Current Phase B Status
???Over Current Phase C Status
???Over Voltage Unbalance Status
*Note: no color code is used for the Relative Setpoint Status.
Symmetric Components
???Zero Sequence Magnitude for Current and Voltage
???Zero Sequence Phase for Current and Voltage
???Positive Sequence Magnitude for Current and Voltage
???Positive Sequence Phase for Current and Voltage
???Negative Sequence Magnitude for Current and Voltage
???Negative Sequence Phase for Current and Voltage
143

The Power Quality tab also provides push buttons for performing the following commands:
Reset Disturbance Counters ??? Resets Sag Swell and Transient Counters. Enable/Disable Sag Swell ??? Enables or Disables Sag Swell Tracking. Enable/Disable Transient ??? Enables or Disables Transient Tracking.
Enable/Disable Over KW ??? Enables or Disables Over Real Power Sliding Window Demand for Relative Setpoint Tracking.
Enable/Disable Over Amps ??? Enables or Disables Over Current for Phases A, B, and C for Relative Setpoint Tracking.
Enable/Disable Over Vunb ??? Enables or Disables Over Voltage Unbalance for Relative Setpoint Tracking.
Demand Tab
EPM 7700 ION Meter - Demand Tab
The Demand tab displays the following demand values from the EPM 7700.
Energy
???Real Energy Import, Export, Total, and Net
???Reactive Energy Import, Export, Total, and Net
???Apparent Energy Total
Sliding Window Demand (SWD)
???Real Power Sliding Window Demand and Predicted Demand
???Reactive Power Sliding Window Demand and Predicted Demand
???Apparent Power Sliding Window Demand and Predicted Demand

???Average RMS Current Sliding Window Demand and Predicted Demand
Thermal Demand
???Real Power Thermal Demand
???Reactive Power Thermal Demand
???Apparent Power Thermal Demand
???Average RMS Current Thermal Demand
The Demand tab also provides push buttons for performing the following commands: Reset Energy ??? Resets Energy Demand values identified above.
Reset SWD??? Resets Sliding Window Demand values identified above. Thermal Demand ??? Resets Thermal Demand values identified above.
Inputs Tab
EPM 7700 ION Meter - Inputs Tab
The Inputs tab displays the following values from the EPM 7700.
Digital Inputs
???Status (On, Off) for Status Inputs (SI)
???Counters for
Analog Inputs
???Zero Scale Setting for
145

???Full Scale Setting for
???Scaled Value for
The Inputs tab also provides push buttons for performing the following commands: Reset Counters ??? Resets Digital Input Status Counters for
The Inputs tab also provides retentive memory inputs for the following:
Digital Input Names for
Analog Input Names for
Setup 1 Tab
EPM 7700 ION Meter - Setup 1 Tab
The Setup 1 tab displays the following demand values from the EPM 7700.
Power Settings
???Volts Mode
???Phase Order
???Voltage Polarity for A, B, and C
???Current Polarity for A, B, C, and Neutral
Transformer Ratio Settings
???PT and CT Primary
???PT and CT Secondary
???Neutral CT Primary and Secondary

Communications
???Baud Rate for Comm 1, 2, and 3.
???Unit ID for Comm 1, 2, and 3.
???Protocol for Comm 1, 2, and 3.
???Mode for Comm 1.
???Ethernet Protocol, IP Address, Subnet Mask, and Default Gateway.
The Setup 1 tab also provides push buttons for performing the following commands:
Download ??? Executes a script to check for values that have changed and downloads those values to the device via the GE 7700 Gateway.
Refresh ??? Executes a script to upload all of the meter values for the settings on the screen.
Note: Be sure to click the Refresh button prior to changing or downloading any settings to the EPM7700, as the latest settings may not be displayed.
147

Setup 2 Tab
EPM 7700 ION Meter - Setup 2 Tab
The Setup 2 tab displays the following demand values from the EPM 7700.
Sliding Window Demand Settings
???Sliding Demand Sub Interval Settings for KW, KVAR, KVA, and Iavg.
???Sliding Demand Number of Sub Intervals for KW, KVAR, KVA, and Iavg.
???Sliding Demand Predicted Response for KW, KVAR, KVA, and Iavg.
Waveform Recorder Settings
???Depth of Waveform Recorder
Sag / Swell / Transient Settings
???Sag / Swell Nominal
???Sag Limit
???Swell Limit
???Change Criteria
???Transient Threshold
Relative Setpoint Settings
???Nominal value for Over KW, Over Current, and Over Vunbal.
???Under Dropout for Over KW, Over Current, and Over Vunbal.
???Over Dropout for Over KW, Over Current, and Over Vunbal.
???Under Pickup for Over KW, Over Current, and Over Vunbal.

???Over Pickup for Over KW, Over Current, and Over Vunbal.
???Time On for Over KW, Over Current, and Over Vunbal.
???Time Off for Over KW, Over Current, and Over Vunbal.
The Setup 2 tab also provides push buttons for performing the following commands:
Download??? Executes a script to check for values that have changed and downloads those values to the device via the GE 7700 Gateway.
Note: Be sure to click the Refresh button prior to changing or downloading any settings to the EPM7700, as the latest settings may not be displayed.
149

Universal Relay
The Universal Relay devices are a
A UR tabular wizard can display between one and eight screens of data ??? the number of screens is determined by the user during wizard configuration. There are a total of Twenty Three screens available, depending on the type of UR device connected. For example, the C30 device does not support any metering functions, so the metering an source tabs are not available for this device.
The UR wizard supports connection to the PMCS Modbus and Ethernet servers and third party MMS servers. A UCA/MMS check box is provided on the wizard configuration dialog to correctly set up the Intouch tag names for use with MMS.
Special Note: UCA/MMS support for PMCS 6.11a is removed. Do notcheck this checkbox.
Note: If WindowViewer is running when the wizard configuration dialog is called up, a message appears warning that any changes made to the UR wizard configuration will not take effect until WindowViewer is shut down and restarted. For example, if a user elects to change the number of tabs configured for a device, the changes will not be reflected in the runtime environment until WindowViewer is restarted.
In the following pages, each of the Tabular Data Screen Wizards??? tabs will be displayed and described.

Metering Tab
Universal Relay - Metering Data Screen
The Metering tab displays the following metered values from the B30, C60, D60, F30, F35, F60, G60, L60, L90, M60 and T60 devices: Actual Values for Voltage, Current, Power, Power Factor, and Frequency. These values are detailed below.
Current
RMS Current for each phase, ground, and neutral
Phasor magnitude and angle for each phase, ground and neutral
Voltage
RMS voltage for each
Phasor magnitude and angle for
Power
Shows Real (Watts), Reactive (VAR), and Apparent (VA) power values per phase and
By default, all power values are displayed in terms of kW, kVAR, and kVA. These values will scale as appropriate to MW, MVAR, and MVA.
Power values derived from a source wired in a delta configuration are displayed as "N/A".
151

Power Factor
Shows the signed power factor value in percent.
Power Factor values derived from a source wired in a delta configuration are displayed as "N/A".
Frequency
Frequency is shown in units of hertz.
Frequency is only displayed if the Frequency Tracking Reference setpoint is set to a
Power Quality Tab
Universal Relay - Quality Tab
The Quality tab provides six buttons labeled S1 ??? S6. These buttons enable you to select the source (1 ??? 6) for display. The text in the upper left corner of the tab indicates which source is currently displayed. Buttons are disabled for sources that have not been configured or enabled in the attached device. The Voltage parameters displayed are dependent on CT/VT configuration of the device hardware.
For the selected source, the Quality tab displays actual values for Zero Sequence, Positive Sequence, and Negative Sequence currents and voltages. The following devices are supported: B30, C30, C60, D60, F30, F35, F60, G60, L60, L90, M60 and T60. The displayed values are described below.
Current
Phasor magnitude and angle for negative, positive and zero sequence currents.
Voltage
Phasor magnitude and angle for negative, positive and zero sequence voltages.
Voltage values derived from a source wired in a delta configuration will appear as "N/A".
Protection Control Tab
Universal Relay - Protection Control Tab
The Protection Control tab is supported for the following devices: B30, C30, C60, D60, F30, F35, F60, G60, L60, L90, M60 and T60. The Protection Control tab provides the features described below.
Grouped Protection Settings
There are eight identical groups of protection settings in the UR - this tab provides an enable/disable status indication of selected protection elements, as well as a pushbutton to change the enable/disable status of those elements in each group. Function availability is determined by the Order Code read from the device ??? those functions that are not available in the connected device will be grayed out and disabled, as shown below:
153
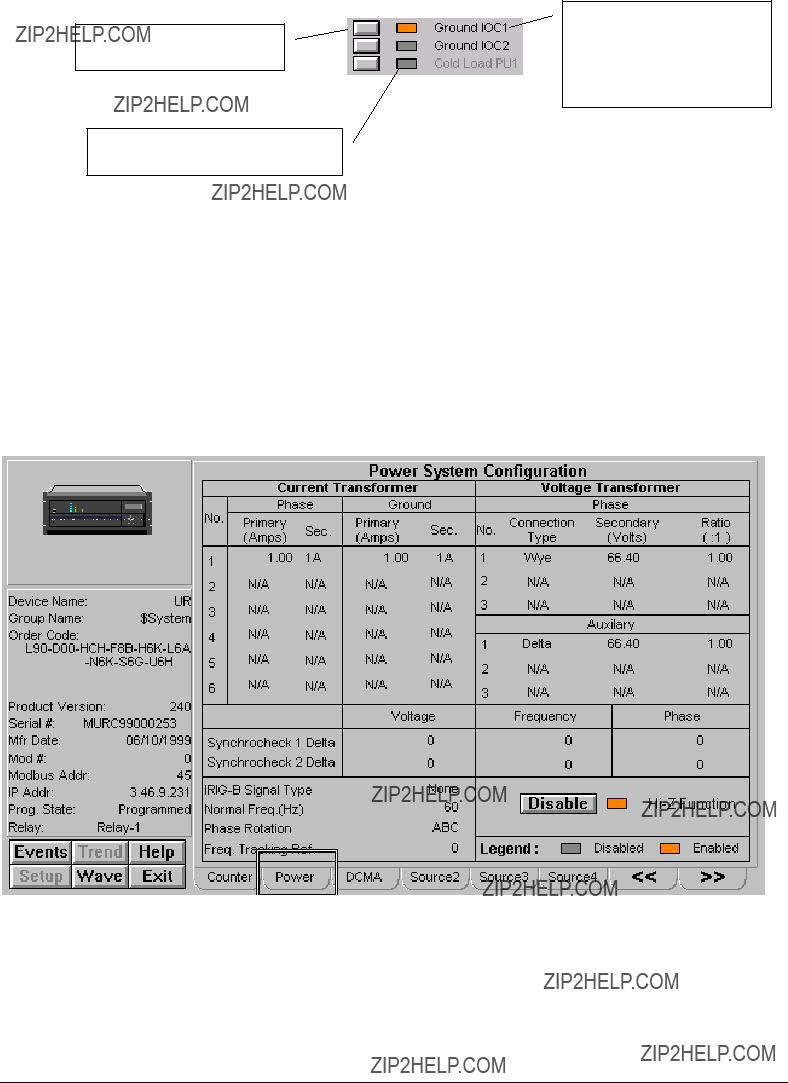
Button to enable or disable the indicated function.
Status indicator: gray = disabled, amber = enabled.
The label color indicates the function???s availability on the connected device: gray = not available, black = available.
To use this tab, the user selects one of the eight settings groups for editing using the control labeled "Select Settings Group". The status of the settings in the selected group will then be displayed, and the user can enable/disable functions without affecting settings in the other seven groups. Note that the displayed group may not be the active group currently in use by the relay???s protection algorithms. The pushbuttons are subject to user level security in Intouch.
Phase TOC and IOC Settings
The Phase, Neutral, and Ground buttons in this section may be used to select the display of the TOC and IOC values.
Power System Configuration Tab
Universal Relay - Power System Configuration Tab
The Power System Configuration tab supports the B30, C60, D60, F30, F35, F60, G60, L60, L90, M60 and T60 UR devices, and shows the source CT and VT configuration of the entire relay. The supported UR devices can be configured with one to three DSP cards containing voltage and/or current transformers for measurement purposes.

Current Transformers (CT)
Primary: indicates the current rating of the CT primary.
Secondary: indicates the output current of the CT secondary, either 1A or 5A.
Displays "N/A" if the Order Code indicates no CT is installed in the affected location.
Voltage Transformers (VT)
Secondary: indicates the output voltage of the VT.
Ratio: the turns ratio of the VT.
Displays "N/A" if the Order Code indicates no VT is installed in the affected location.
Synchrocheck 1/2 Delta
The Delta values for Synchrocheck 1 and 2, voltage frequency, and phase.
Displays the
Normal Frequency
The system nominal frequency in hertz.
Phase Rotation
The system phase rotation, ABC or ACB.
Frequency Tracking Reference
A numerical setpoint value associated with a specific source. The indicated source is used by the relay for developing frequency metering information. A value of zero indicates that the relay is not intended to meter frequency.
Enable or Disable the device's High Impedance
155

Transformer Tab
Universal Relay - Transformer Tab
The T60 device alone supports a Transformer Tab on its wizard. This tab is unique to the T60 device type. The following values are shown:
Differential Current
Phasor magnitude and angle.
Differential 2nd Harmonic
Phasor magnitude and angle
Differential 5th Harmonic
Phasor magnitude and angle
Restraint Current
Phasor Magnitude and angle
Transformer Winding Reference
Indicates which of the six possible transformer windings will serve as the reference winding.

Elements Tab
Universal Relay - Digital Elements Tab
The Elements tab displays
157

Digital Counter Tab
Universal Relay - Digital Counter Tab
The digital counter tab supports B30, C30, C60, D60, F30, F35, F60, G60, L60, L90, M60 and T60 device types, showing information about the eight digital counters provided in each UR.
Status ??? this indicator is amber if the counter is enabled, gray if disabled.
Enable/Disable ??? this button gives the user the ability to enable or disable the specified counter.
Name ??? displays the
Time Stamp ??? shows the time and date when the frozen count was acquired.
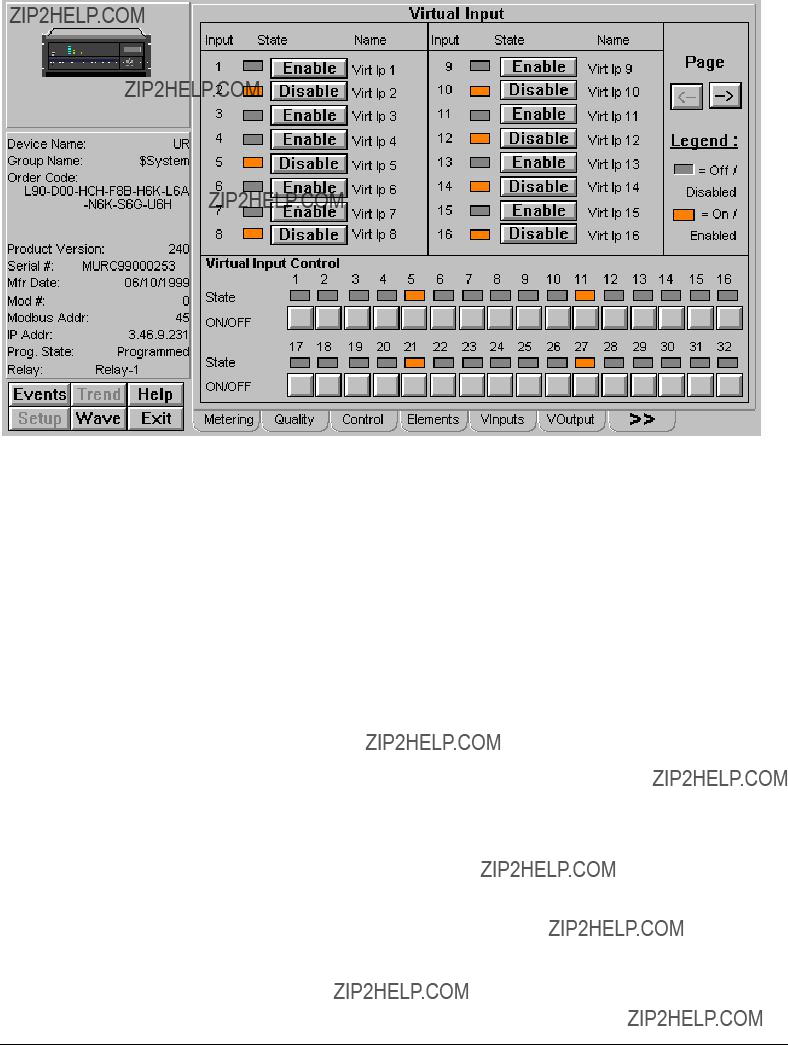
Virtual Inputs Tab
Universal Relay - Virtual Inputs Tab
The Virtual Inputs (VInputs) tab allows the user to enable/disable all configured virtual inputs in the connected device and provides indication of their status. The 32 virtual inputs can be manually operated with the pushbuttons provided at the bottom of the screen. This tab supports the B30, C30, C60, D60, F30, F35, F60, G60, L60, L90, M60 and T60 devices.
Virtual Inputs
The enable/disable controls and status indicators are presented as a series of pages. To view the virtual inputs, the use the Page arrow keys provided to navigate between the pages. The arrow keys are disabled when the virtual inputs are not being displayed.
The state of each virtual input can be controlled with the pushbuttons along the bottom of the screen. Clicking one of these buttons toggles the status of the virtual input, changing its state as shown in the indicator blocks associated with each button. Note that a virtual input must be enabled before the toggling action will take effect in the relay.
159
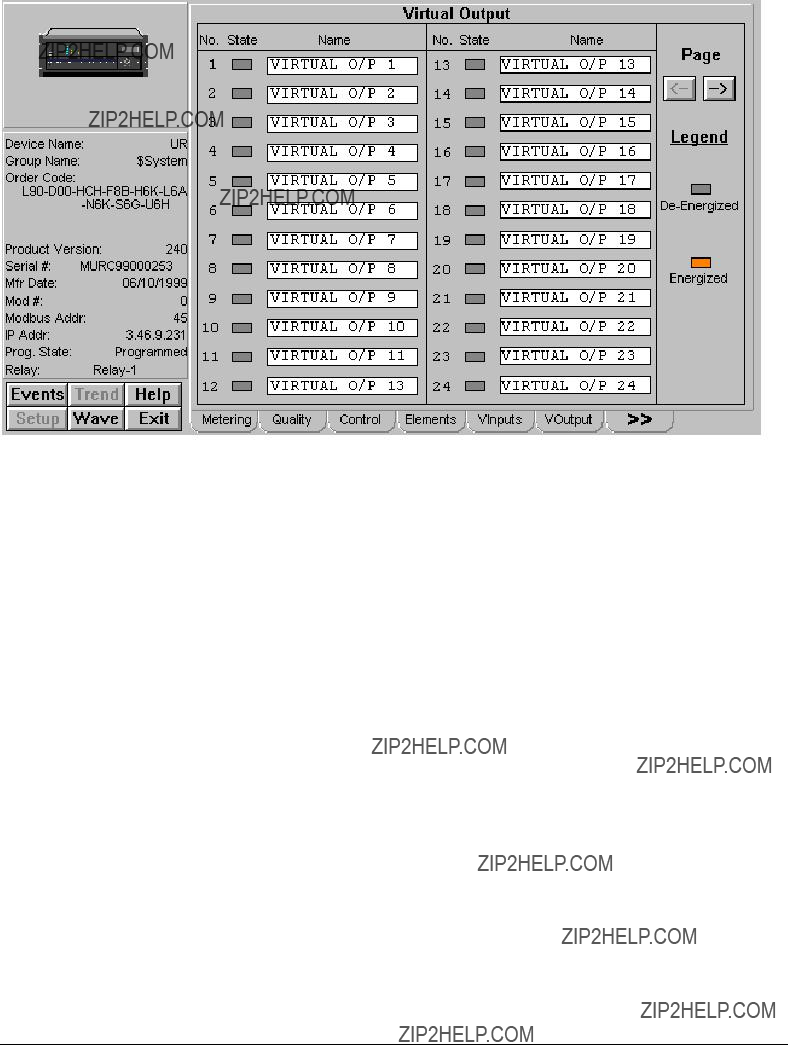
Virtual Outputs Tab
Universal Relay - Virtual Outputs Tab
The Virtual Outputs (VOutput) tab allows the user to view the status (energized/de- energized) of all available virtual outputs on the device. The user can also assign a textual name to each of the outputs. Up to 64 virtual outputs can be diplayed. This tab supports the B30, C30, C60, D60, F30, F35, F60, G60, L60, L90, M60 and T60 devices.
Virtual Outputs
The outputs and their status indicators are presented as a series of pages. To view the virtual outputs, the use the Page arrow keys provided to navigate between the pages.
To assign a name to a virtual output, click in the text field to the right of the output number label. The field becomes editable; make any desired changes, then press Enter.

Contact Inputs Tab
Universal Relay - Contact Input Tab
The Contact Input tab supports the B30, C30, C60, D60, F30, F35, F60, G60, L60, L90, M60 and T60 UR devices, and shows the contact inputs installed on the selected relay. Up to 96 contact inputs may be displayed.
Contact Inputs
The contacts are presented as a series of pages. To view the contact inputs, use the Prev(ious) and Next keys provided to navigate among the pages. The number of contact inputs available is determined from the Order Code read from the device, and is dependent on the number of digital I/O cards installed in the relay. If a contact input is not available in the connected relay, the associated control button is grayed and disabled, and the input name field shows "N/A". If the corresponding Contact Input State is Energized then the LED is lit with an amber color; otherwise the LED remains gray
161
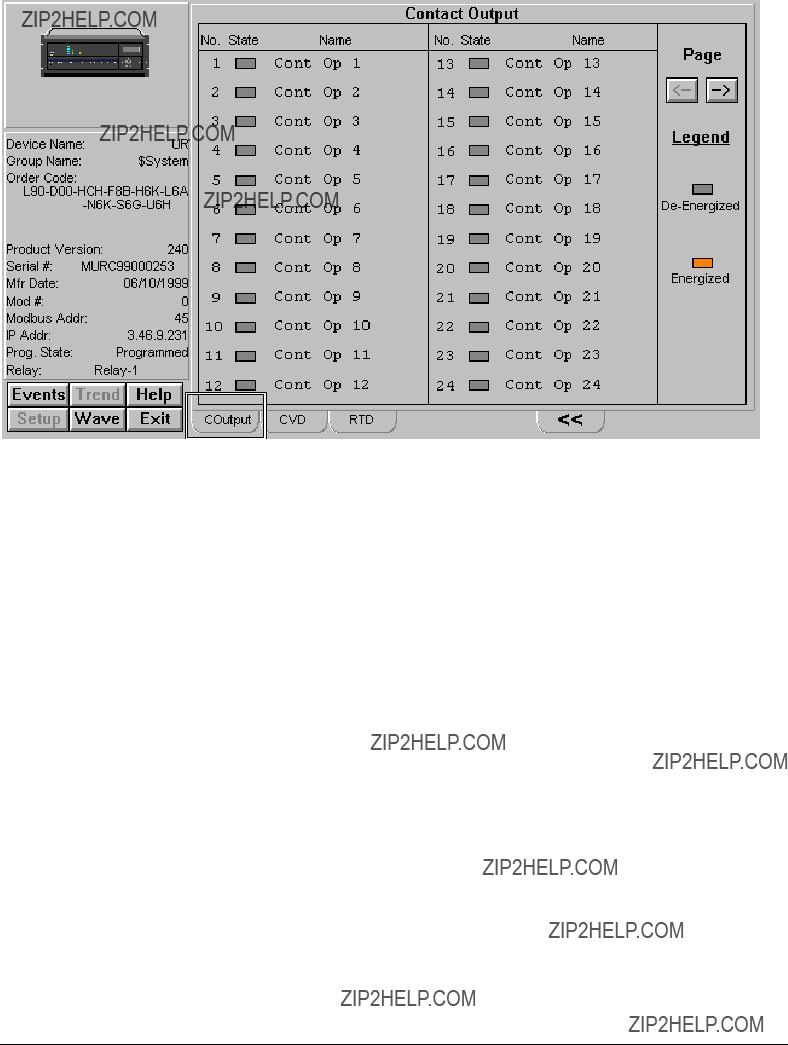
Contact Output Tab
Universal Relay - Contact Output Tab
The Contact Output tab supports the B30, C30, C60, D60, F30, F35, F60, G60, L60, L90, M60 and T60 UR devices, and shows the contact outputs installed on the selected relay. Up to 64 contact outputs may be displayed.
Contact Output
The contacts are presented as a series of pages. To view the contact outputs, use the Page arrow keys provided to navigate among the pages. The number of contact outputs available is determined from the Order Code read from the device, and is dependent on the number of digital I/O cards installed in the relay. If a contact output is not available in the connected relay, the associated control button is grayed and disabled, and the output name field shows "N/A".
DCMA Tab
Universal Relay - DCMA Tab
The Direct Current MilliAmperes (DCMA) tab supports the B30, C30, C60, D60, F30, F35, F60, G60, L60, L90, M60 and T60 UR devices, and shows the state of the relay's DCMA inputs. DCMA inputs are analog inputs used to read external transducer values. An example might be rotational speed on a generator, translated into a
DCMA Inputs
The DCMA inputs and their parameters are presented as a series of pages. To view the inputs, the use the Page arrow keys provided to navigate between the pages.
For each DCMA input, its ID number, value, and units are displayed as read from the device. To enable or disable a selected input, click the Enable button next to its ID number.
163
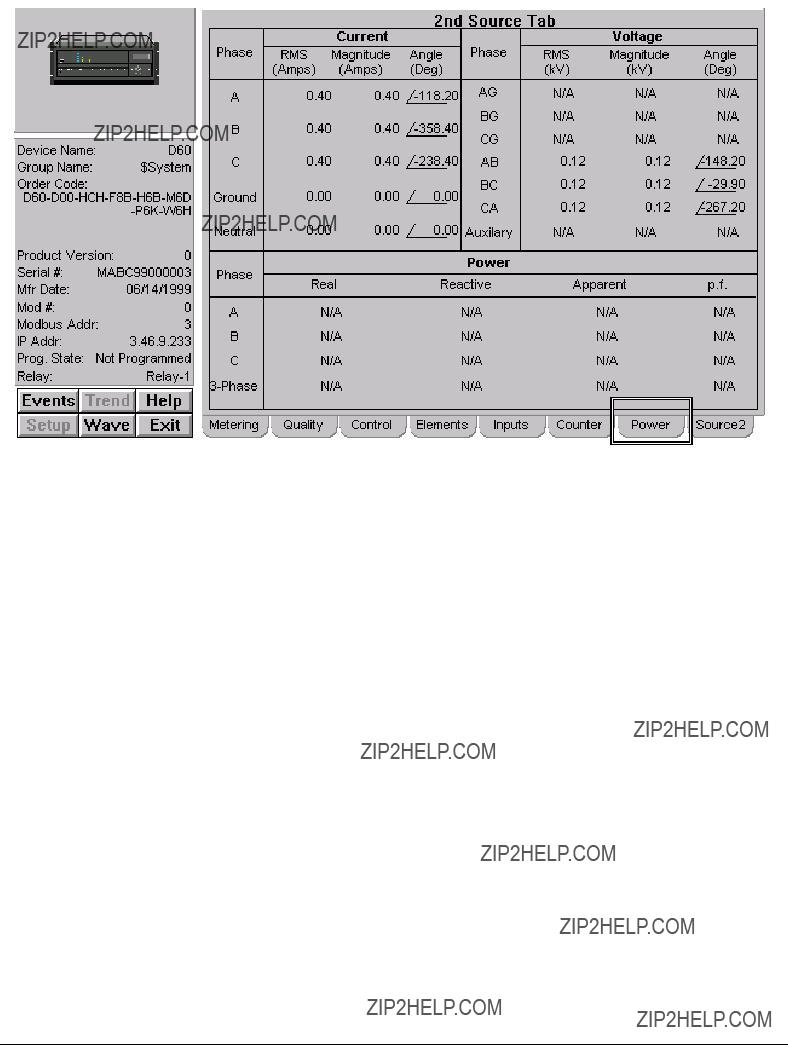
Source Tabs
Universal Relay - Source Tab Example
Similar in operation to the metering tab (except that frequency information is not displayed), there are five identical "Source" tabs (2 ??? 6) which display actual values information specific to the indicated source. There is no "Source 1" tab, since the Metering tab serves as the "Source 1" display. The B30, C60, D60, F30, F35, F60, G60, L60, L90, M60 and T60 UR device types are supported.
The display rules for the metering tab also apply to each Source tab.

Demand Tab
Universal Relay - Demand Tab
The Demand tab supports the B30, C60, D60, F30, F35, F60, G60, L60, L90, M60 and T60 UR devices, and shows a variety of energy measurements and demand parameters for a selected source.
These values are displayed for up to six sources, which may be toggled between using the S1 - S6 buttons. The Clear Demand button clears the values for the selected source. Note: Energy data is displayed as N/A for the L90 and L60 device types, and data logger data is displayed as N/A for the B30 device type.
Demand Values
The Demand panel shows the Data Logger parameters, which may be cleared using the Clear Data Logger button, the time/date stamps of the oldest and newest samples available, and information on the Demand Current and Demand Power Methods, and Demand Interval (if applicable).
Source (x) Energy
Displays positive and negative Watthour and Varhour values for the selected source.
Source (x) Demand, Peak Demand, Peak Demand Date
Displays Demand, Peak Demand, and Peak Demand Date values for a variety of measurements for the selected source.
165

Line Tab
Universal Relay - Line Tab
The Line tab supports the D60, F30, F60, G60, L60, L90 and UR devices, and shows a variety of energy measurements and demand parameters for a selected source.
These values are displayed for up to six sources, which may be toggled between using the S1 - S6 buttons. The Clear Demand button clears the values for the selected source.
Line Tab
Displays (for Remote 1, Remote 2, Local, and Differential) the magnitude and angle on phase A, B, and C.
Also displays information on various Direct Inputs, L90 Channels 1 and 2, and Line Position and Line Zero values.
Control Functions
The Control Functions panel displays status (enabled/disabled) and allows control of various relay elements, for example 87L and 87PC protection elements. Elements are greyed out if not installed or applicable to the device type. Each element's may be enabled or disabled by clicking the button next to its name.

Breaker Tab
Universal Relay - Breaker Tab
The Breaker tab supports the B30, C30, C60, D60, F30, F35, F60, G60, L60, L90, M60 and T60 UR devices, and shows a variety amperage measurements and breaker status, as well as allowing control of breaker functions and auto reclosers.
Arcing
Amperage at Breaker 1 and 2 is displayed for Phases A, B, and C. The Clear Current Arcing functions allow current arcing conditions to be cleared.
Breaker Arcing Current features are available for Breakers 1 and 2. This element calculates an estimate of the
These
Breaker Functions
Breaker control can be enabled or disabled using these controls, and the Breaker Arcing Amp function can be enabled or disabled for Breakers 1 and 2. These controls will be disabled if the connected device does not support breaker control.
Breaker Status
Selecting a settings group changes the display of functions. Up to 8 settings groups are available for display.
167
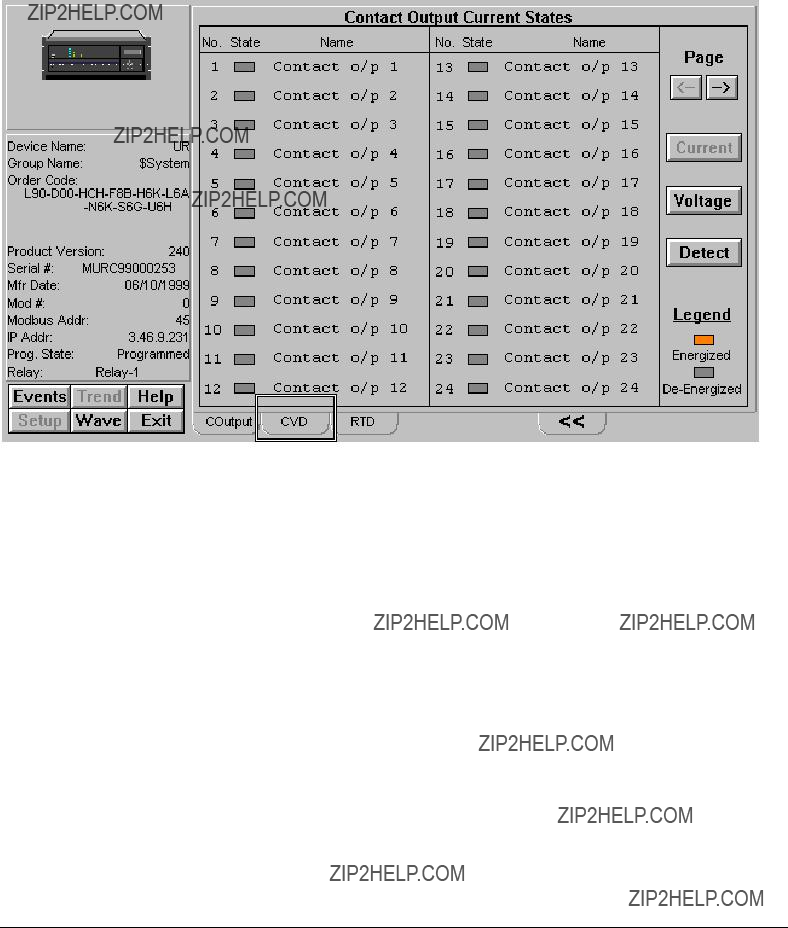
Auto Reclose
If the breaker is so equipped, the status of and reclose count for up to six Auto Reclose functions can be displayed, and each recloser may be enabled or disabled. Click the button next to each ID number to enable/disable the autorecloser.
Contact Output Current States Tab
Universal Relay - Contact Output Current States Tab
The Contact Output Current State tab supports the B30, C30, C60, D60, F30, F35, F60, G60, L60, L90, M60 and T60 UR devices, and indicates the current state of the contact outputs installed on the selected relay. Up to 64 contact outputs may be displayed.
Contact Output Current State
The Current, Voltage, and Detect buttons enable the user to shift the viewing mode of the contacts displayed.
The contacts are presented as a series of pages. To view the contact outputs, use the Page arrow keys provided to navigate among the pages. The number of contact outputs available is determined from the Order Code read from the device, and is dependent on the number of digital I/O cards installed in the relay. If a contact output is not available in the connected relay, the associated control button is grayed and disabled, and the output name field shows "N/A".

Remote Temperature Detection Tab
Universal Relay - Contact Output Tab
The RTD tab supports the B30, C30, C60, D60, F30, F35, F60, G60, L60, L90, M60 and T60 UR devices, and shows the RTD sensors installed on the selected relay. Up to 48 input sensors may be displayed.
RTD Tab
Each RTD sensor's status, function (name), and current temperature are shown. Individual RTD's may be disabled or enabled using the control button next to the RTD number.
The sensors are presented as a series of pages. To view each page of RTD's, use the Prev(ious) and Next keys provided to navigate among the pages. The number of parameters displayed is determined from the Order Code read from the device, and is dependent on the number of RTD sensors wired to the relay. If a sensor is not available in the connected relay, the associated control button is grayed and disabled, and the name field shows "N/A".
169
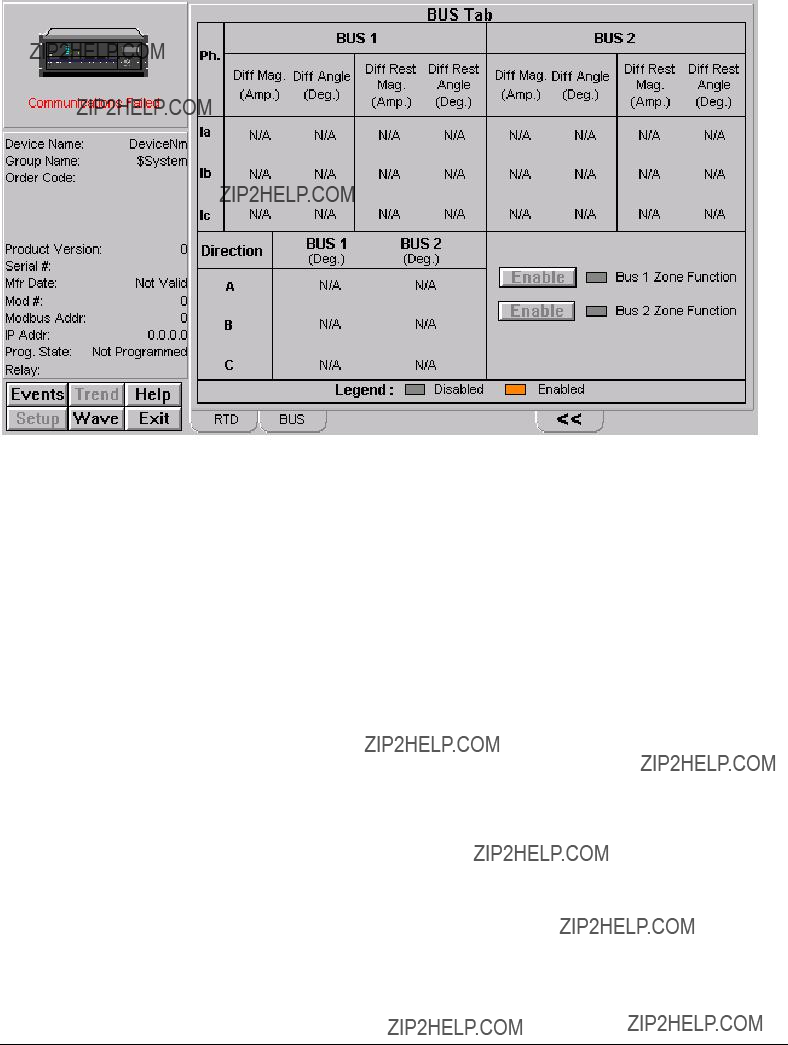
Bus Tab
Universal Relay - Bus Tab
The Bus tab is supported for the B30 UR device only. It displays Phase Magnitude and Angle measurements on Bus 1 and Bus 2 for phases A, B, and C.
Current direction is shown in degrees for each phase, and the Zone function can be enabled or disabled on each Bus.

239 Motor Protection Relay
The 239 does not support Waveform Capture or Event generation, therefore these buttons are disabled beneath the Info box.
The 239 Tabular Data Screen???s command buttons are described below:
Table 23. 239 Tabular data screen commands.
???The Status tab displays 35 Pickup LEDs (amber) and 35 Alarm LEDs (red), along with a text string for each alarm condition on the Status tab.
See the 239 Motor Protection Relay Instruction Manual (Chapter 5, Actual Values) for information on the display of data values under different device configurations. Values not configured for use are displayed as N/A.
Metering tab
The Multilin 239 Metering screen shows:
???Current
???RTD Status and Temperature
???Motor Status
???Switches
???Output Relays
171

The Reset Device button, when clicked, will issue a RESET command to the 239.
The Emergency Restart button, when clicked, will issue a RESTART command to the 239.
Status Tab
???The Status tab displays Alarm, Trip, Auxilary Status Pickup is shown in Amber color and Active Alarm shown in Red, along with a text string for each alarm condition.
???See the 239 Motor Protection Relay Instruction Manual (Chapter 5, Actual Values) for information on the display of data values under different device configurations. Values not configured for use are displayed as N/A.
Trip Data
The Multilin 239 Last Trip Data screen shows:
???Cause of Last Trip and their corresponding currents and RTD Temperatures at the time of trip.
???Trip Record
The Clear Trip Data button, when clicked, will clear all the trip data.
173

Setpoints Tab
The Multilin 239 System Setpoints screen shows:
???CT Inputs
???Motor Data
???Phase Current Overload
???Breaker Failure
???Immediate Overload
???Mechanical Jam
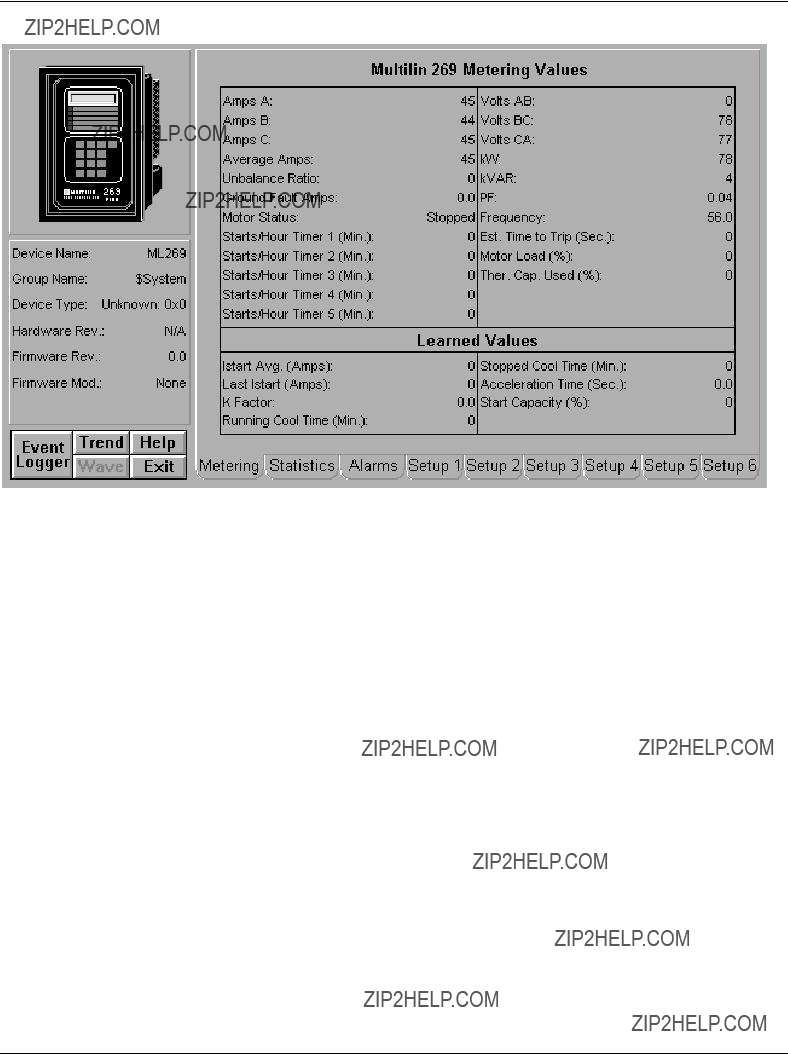
269 Plus Motor Management Relay
The 269 Tabular Data Screen wizard provides two reset push buttons on the Setup 6 tab.
Table 24. 269+ Tabular data screen commands.
For complete explanations of parameters, refer to the 269+ Users Guide.
175

369 Motor Management Relay
Metering Tab
369 - Metering Data Screen
The Metering tab displays the following metered values from the 369 device: Actual Values for Voltage, Current, Power, Power Factor, and Frequency. These values are detailed below.
Current
???Per phase magnitude and angle
???Phase average
???Ground current
???Motor Load as a percentage of the Full Load Current rating defined in setpoints.
???Thermal Capacity used in percent
???Estimated time to trip
???Current Unbalance ratio
Voltage
Voltage values are only displayed if the Metering or Backspin option is installed in the relay, and if a voltage transformer (VT) connection has been programmed in the relay.
Line - Line voltage magnitude. Average
Line ??? Neutral voltage magnitude and angle (only shown for wye configurations)

Average
Power
Power values are displayed only if the Metering or Backspin option is installed in the relay and a VT connection has been programmed.
???Real power
???Reactive power
???Apparent power
???Power Factor
Motor Status
The current status of the motor is shown in a colored indicator block
Timer Functions & Learned Values
The lower right quadrant of the metering tab has two pages ??? Timer Functions and Learned Values. You can toggle between these two displays by clicking on the button located in the bottom right corner of the metering tab display.
Timer Functions: this section displays the current values of several internal timers within the device. Most of these functions must be programmed in the relay in order to function. Refer to the device manual for specific usage details.
Learned Values: this section displays items tracked by the relay. For full details on their usage, consult the relay manual.
Backspin features ??? these are only enabled when the Backspin option is installed in the relay.
Learned cool time constants ??? these are enabled only if the "Enable Learned Cool Times" feature is programmed.
Learned k factor is only enabled by setting the unbalance biasing of thermal capacity to on/learned.
Clearing Motor Data (see control tab) will set all these values to their defaults.
177
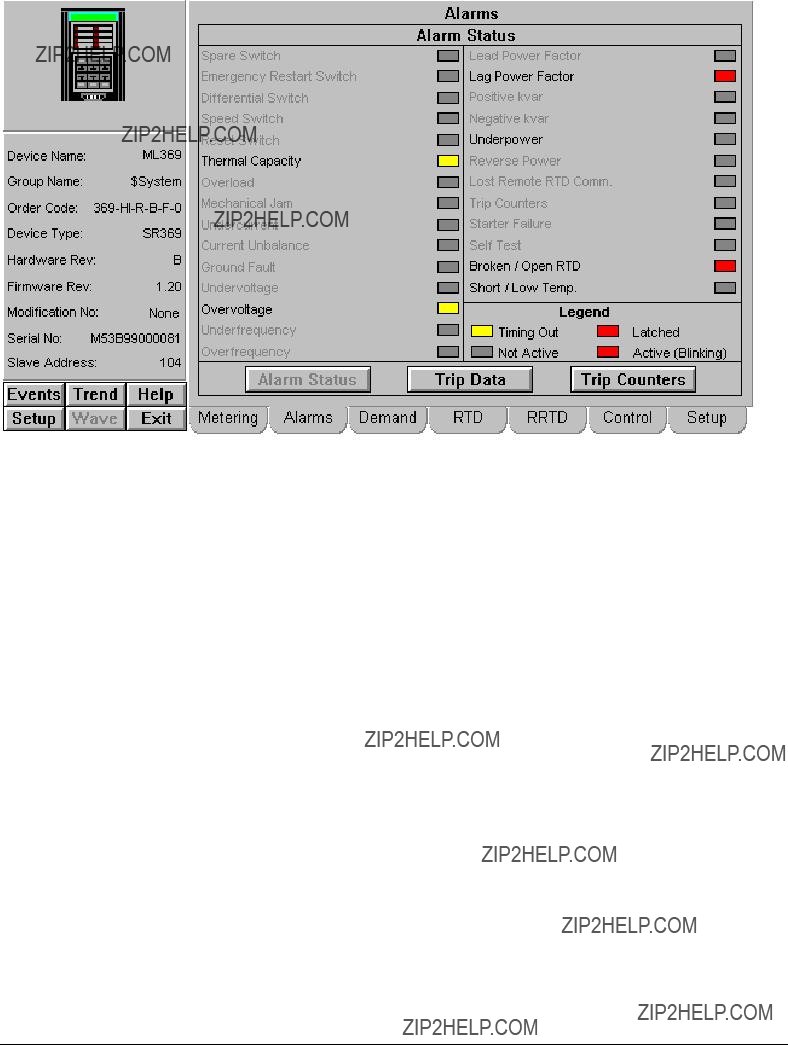
Alarms Tab
369 Relay - Alarms Tab
The Alarms tab consists of three pages ??? Status, Trip Data, and Trip Counters. You can navigate between pages by clicking the buttons located along the lower edge of the tab display.
Alarm Status
This page displays the current status of the alarm functions within the relay.
If a function is disabled or not programmed, its label appears as dark gray text, and its associated indicator will be dark gray at all times.
If a function is enabled, its label appears as black text, and its indicator will show the current status of that function.
Trip Data
This page displays information about the last trip event.
Voltage, power, and power factor values are only indicated if the Metering or Backspin option is installed and a VT connection has been programmed in the relay.
The Hottest Stator RTD field is only shown if a Stator RTD is programmed.
Trip Counters
This page displays information about the accumulated trips experienced by the relay. Data on this page can be cleared using the Clear Last Trip Data button on the Control tab.

Demand Tab
369 Relay - Demand Tab
This tab displays current and power demand metering information. Current demand is indicated regardless of options/VT settings.
Power demand values are only available when the Metering or Backspin option is installed on the relay and a VT connection is programmed.
Peak demand values may be cleared using the Clear Peak Demand Data button on the Control tab.
179

Local RTD Tab
369 Relay - Local RTD Tab
This tab displays information about any RTD temperature probes connected directly to the device. Information on this tab is only available if the RTD option is installed in the relay.
Information and alarm indication for each RTD is only available when that RTD is programmed for operation. If an RTD???s Application is set to "none" then all fields for that RTD display "N/A".
The hottest Stator RTD indicates which RTD is currently returning the highest temperature. This condition is indicated by red text in the Temperature field.
Only one alarm condition can be displayed at a time ??? highest priority alarms are displayed in the alarm indicator. For example, if a "High Alarm" was triggered and latched and the RTD value returned to the "Alarm Active" state, the "High Alarm" latched indicator would persist.

Remote RTD Tab
369 Relay - Remote RTD Tab
This tab displays information about any RTD temperature probes connected to one or more Remote RTD units. These external accessories connect via Modbus to the 369 relay. A maximum of four RRTD modules can be connected to a 369 relay ??? each module is assigned a page on this tab. Use the RRTD Selection buttons in the lower left corner of the tab to navigate between pages. Information on this tab is only available if an RRTD module is connected to the relay.
Information and alarm indication for each RTD is only available when that RTD is programmed for operation. If an RTD???s Application is set to "none" then all fields for that RTD display "N/A".
The hottest Stator RTD indicates which RTD is currently returning the highest temperature. This condition is indicated by red text in the Temperature field.
Only one alarm condition can be displayed at a time ??? highest priority alarms are displayed in the alarm indicator. For example, if a "High Alarm" was triggered and latched and the RTD value returned to the "Alarm Active" state, the "High Alarm" latched indicator would persist.
The Status indicators are dedicated to the indicated RRTD module, except for the Comm. Failure indicator ??? this will be energized if any configured RRTD module stops communicating.
181

Control Tab
369 Relay - Control Tab
This tab provides limited control functionality over Modbus.
Status ??? indicates the current status of the output relays and general digital inputs.
Preset Values ??? shows the current value of the indicated field. Note that these values are only updated when the tab is first displayed ??? not continuously. To preset a new value, click the white box containing the value you want to change. The Intouch Calculator window appears ??? type in the new value and click OK. The new value is now displayed in the Control tab, but has not yet been sent to the device. Click the Set button to store the new value in the device.
Control ??? These buttons are disabled unless the Serial Communications Control setpoint in the relay is programmed to "On". These buttons are subject to Intouch user level security. The security level is set during wizard configuration.
Clear Data ??? These buttons clear the designated values within the device. All buttons are subject to Intouch user level security which is set during wizard configuration.
Setup Tab
369 Relay - Setup Tab
This tab displays selected setpoints from the device. All fields on this tab are read- only. Setpoints may be changed via the relay???s own setup program or manually via the front panel.
183

SR469 Motor Management Relay
All six function buttons under the Info area are enabled for the SR469.
The SR469 Tabular Data Screen wizard has nine command buttons, described below.
Table 25. SR469 Tabular data screen commands.
See the SR469 Motor Management Relay manual (Chapter 5, Actual Values) for information on the display of data values under different device configurations. Values not configured for use are displayed as N/A.
Metering Tab
The Multilin SR469 Metering Values screen shows the metering values, for example, Amps A, Amps B and Amps C; and

Volts AB, Volts BC and Volts CA. Also shows Power, Energy, Motor Data and RTD information. The Clear Peak Demand button will clear all Peak Demand data
The Clear MWh & Mvarh button will clear all MWh and Mvarh values. The RESET Device button will issue a RESET command to the SR469.
Status Tab
The Multilin SR469 Status screen shows:
???Start Blocks
???Motor Status
???Real Time Clock
???RTD Maximums
The Clear RTD Maximums button will clear all maximum RTD values.
185

Alarms Tab
The Multilin SR469 Alarm Status screen shows the status of various alarms such as Overload Alarm and Underpower Alarm.

Trip Tab
The Multilin SR469 Trip screen shows the values of last trip data.
The Clear Last Trip Data button will clear all values of the last trip data.
187
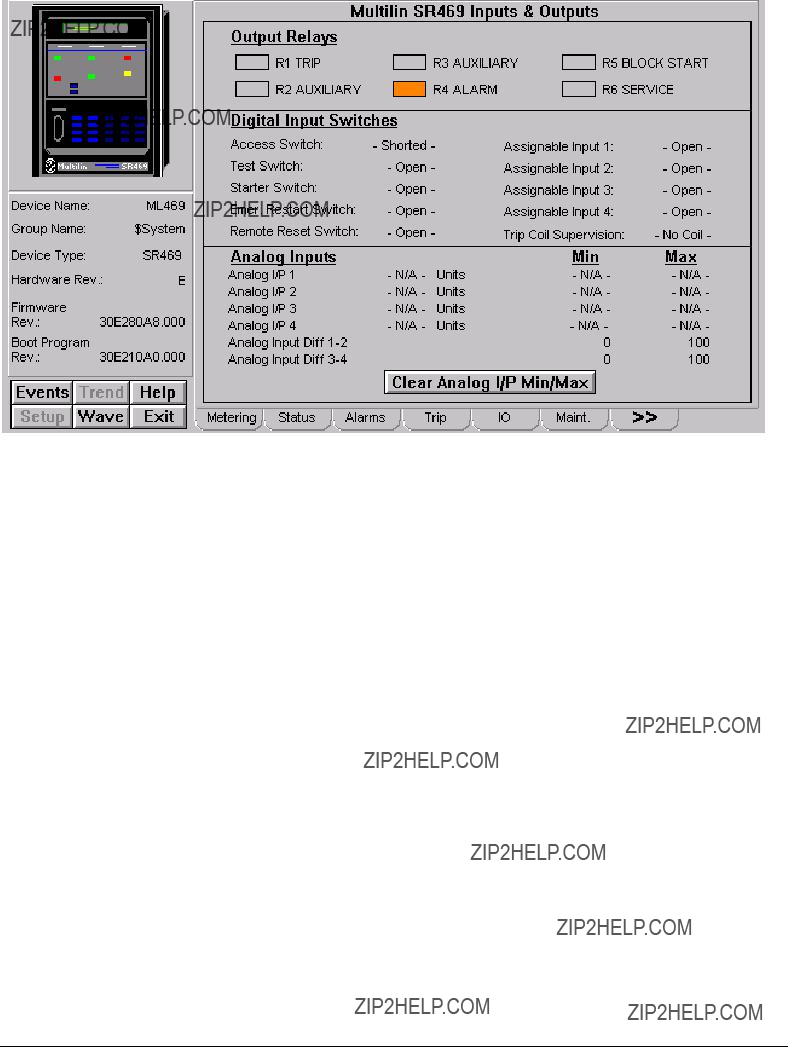
IO Tab
The Multilin SR469 Inputs & Outputs screen shows values related to:
???Output Relays
???Digital Input Switches
???Analog Inputs
The Clear Analog I/P Min/Max button will clear all minimum and maximum values of Analog I/P.

Maintenance Tab
The Multilin SR469 Maintenance screen shows values related to:
???Trip Counters
???Timers
???General Counters
The Clear Trip Counters button will clear all values of trip counters and the Preset Digital Ctr will preset trip counters.
189

Analog Tab
The Multilin SR469 Analog Input Differential screen shows:
???Analog Input Diff
???Analog Input Diff

RTD HI Tab
The Multilin SR469 HI Alarm Status screen shows various RTD values.
Setpoints Tab
The Multilin SR469 System Setpoints screen shows values of Thermal Model, Current, Voltage Sensing, Power System
191
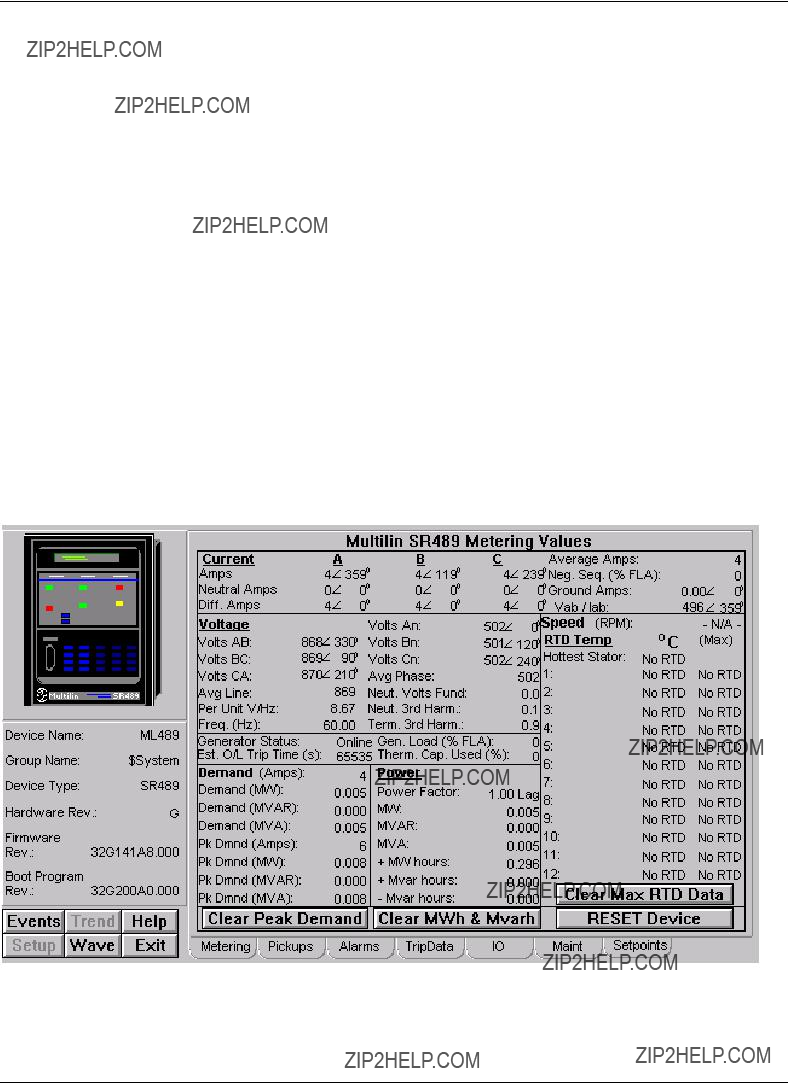
SR489 Generator Management Relay
All the SR489???s function buttons below the Info box are enabled.
The SR489 Tabular Data Screen wizard has nine command buttons, described below.
Table 26. SR489 Tabular data screen commands.
See the SR489 Generator Management Relay manual (Chapter 5, Actual Values) for information on the display of data values under different device configurations. Values not configured for use are displayed as N/A.
Metering Tab
The Multilin SR489 Metering Values screen shows various metering values:
???Current
???Voltage
???Demand
???Power
???RTD Information
???Motor Data
The Clear Peak Demand button clears all peak demand values. The Clear MWh & Mvarh button clears all MWh and Mvarh data The Clear Max RTD Data button clears the maximum RTD data and
The RESET Device button will issue a RESET command to the device.
Pickup Tab
The Multilin SR489 Pickups screen shows:
???Phase Differential Trip
???Overvoltage Trip
???Volts/Hertz Trip
CLICK MORE BUTTON TO SEE MORE PICKUPS
Alarms Tab
193

The Multilin SR489 Alarm Pickups screen shows all the Alarms.
Trip Data Tab
The Multilin SR489 Last Trip Data screen shows the values of last trip data and the corresponding values at the time of trip.
The Clear Last Trip Data button clears all values of the last trip data.

IO Tab
The Multilin SR489 Inputs & Outputs screen shows:
???Digital Input Switches
???Analog Inputs
???Output Relays
???Learned Data Values
The Clear Analog I/P Min/Max button clears all the minimum and maximum analog I/P.
195
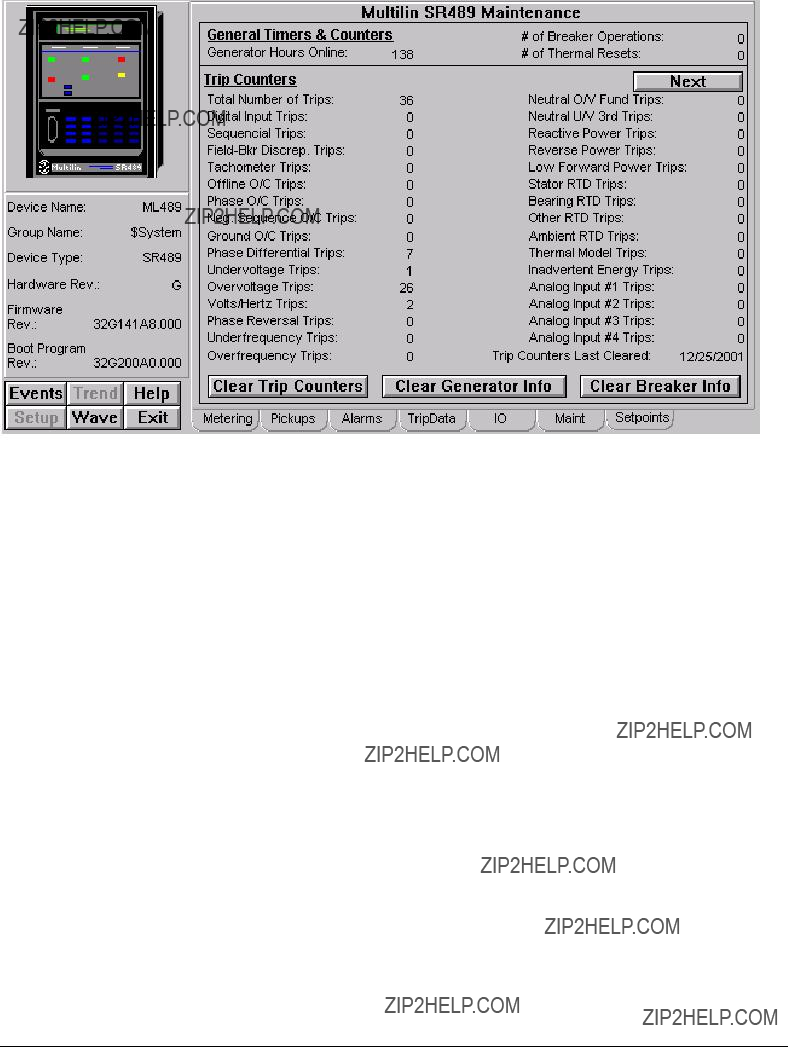
Maintenance Tab
The Multilin SR489 Maintenance screen shows:
???General Timers & Counters
???Trip Counters
The Clear Trip Counters button will clear all values of trip counters; the Clear General Info button will clear all general information; and the Clear Breaker Info button will clear all breaker information from the memory.

Setpoints Tab
The Multilin SR489 System Setpoints screen shows various values related to the setpoints such as Phase CT Primary, Ground CT Type, VT Connection Type, Voltage Transformer Ratio etc.
197

565 Feeder Management Relay
The 565 Tabular Data Screen wizard has the following buttons on the Command tab:
Table 27. 565 Tabular data screen commands.
The Setup 2 tab has two data input areas. Analog Input Title creates a user label for the analog input used in the device. Analog Input Units performs the same function for the units of the analog input. These labels appear on the Metering tab and on the Large Faceplate wizard when the analog input is displayed. The analog input can be

scaled to display any desired units from the front of the device, but these labels are not sent to the DDE Server.
For complete explanations of parameters, refer to the 565 Users Guide.
199

735 Feeder Relay
The Events and Wave function buttons below the Info box are disabled since the 735 does not support Waveform Capture or Event generation.
The 735 Tabular Data Screen wizard has two command buttons, described below.
Table 28. 735 Tabular data screen commands.
Metering Tab
The 735 Metering screen shows:
???Current and Output Relays
???Time Overcurrent Trip and Instantaneous Overcurrent Trip
???Configuration
The RESET/CLEAR Device button will issue a RESET command to 735.

Trip Data Tab
The 735 Trip Data screen shows trip data information such as:
???Last Trip Data
???Trip Record
The Clear Last 5 Trip Causes button will clear values of last 5 trip causes.
201
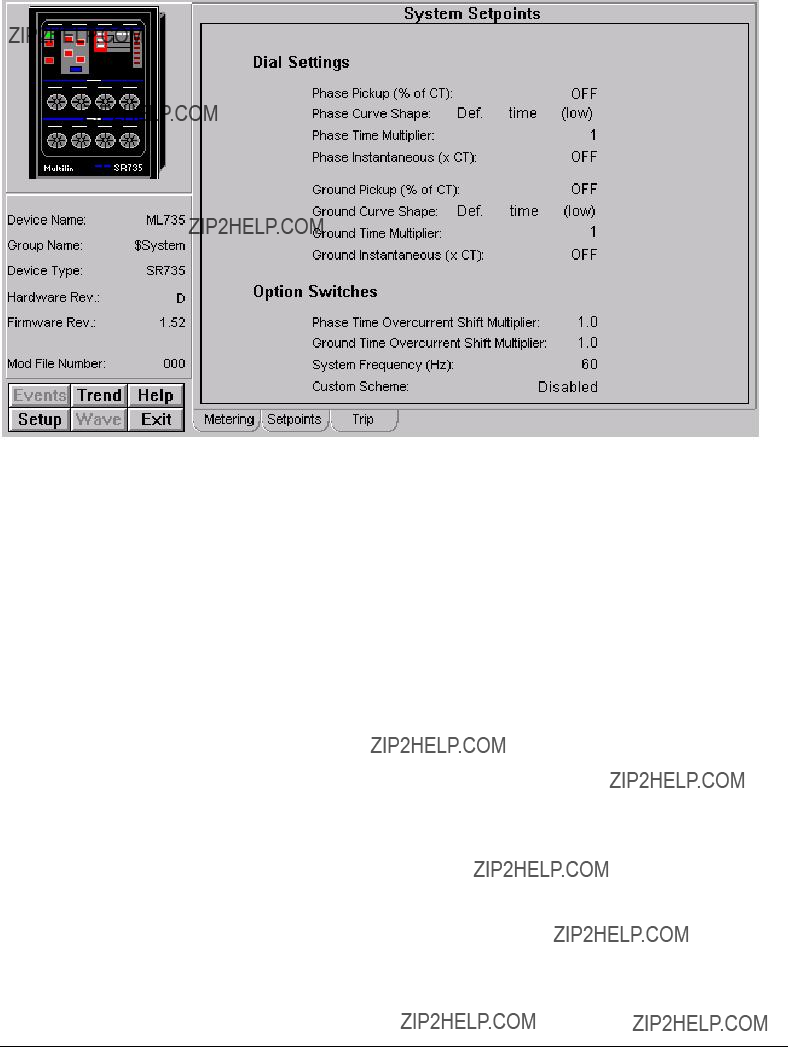
Setpoints Tab
The 735 System Setpoints screen shows setpoints information such as:
???Dial Settings
???Option Switches
SR745 Transformer Management Relay
Under the Info area, the SR745???s function buttons are all enabled.
The SR745 Tabular Data Screen wizard has three command buttons:
Table 29. SR745 Tabular data screen commands.
See the SR745 Transformer Management Relay Instruction Manual (Chapter 6, Actual Values) for information on the display of data values under different device configurations. Values not configured for use are displayed as N/A. When configured for only 2 Windings, the Winding 3 fields on the Tabular Data wizard are not visible.
Metering Tab
The Multilin SR745 Metering Values screen shows:
???Current
???Sequence Current
???Status Flags
The RESET Device button will issue a RESET command to the device.
203

Flags Tab
The Multilin SR745 Element Flags screen shows the state and phases of various elements.
IO Tab
The Multilin SR745 Inputs & Outputs screen shows:

???Logic Inputs
???Virtual Inputs
???Output Relays
???Virtual Outputs
???Analog Input
Demand Tab
The Multilin SR745 Demand Data screen shows:
???Configuration
???Present Values
???Maximums
The Clear Max Demand Data button will clear all maximum values of the demand data.
205

Harmonic Tab
The Multilin SR745 Harmonic & Misc Data screen shows:
???Harmonic Data
???Misc
The Reset Loss of Life button will clear

Setpoints Tab
The Multilin SR745 System Setpoints screen shows information such as Nominal Phase to Phase Voltage, Rated Load (MVA), Transformer Type and Analog Outputs.
207

Power Tab
The Multilin SR745 Power & Energy screen shows:
???Power
???Energy
???Aging Factor
???Tap Changer

SR750/760 Feeder Management Relay
The SR750 and SR760 are very similar devices and share a common Tabular Data Screen wizard. During wizard configuration, select which type of device the wizard represents (SR750 or SR760) by selecting the corresponding radio button in the Tabular Data Screen Configuration dialog box.
Under the Info area, the SR750/760???s function buttons are all enabled. The SR750/760 Tabular Data Screen wizard has eight command buttons:
Table 30. SR750/760 Tabular data screen commands.
The SR750/760 Tabular screen offers a tab labeled LOGIC. This tab allows you to access the SR750/760's 20 logic inputs. You can use these logic inputs to operate a variety of logic functions for circuit breaker control, external trips, blocking of protection elements, etc., and use the PCMS Wizard to monitor the status of the logic inputs. For more information, refer to the SR750 or SR760 user manual, in the section titled Setpoints - S3 Logic Inputs.
The SR750/SR760 Tabular Data Screen Wizard supports the Lockout/Tagout wizard. Please refer to the section titled Using and Configuring PMCS Wizards: Lockout/Tagout Wizard for details.
If a Danger or Ground Lockout/Tagout symbol is installed on this wizard, attempts to issue a Breaker Open or Breaker Close command will generate an error message.
See the SR750/760 Feeder Management Relay Instruction Manual (Chapter 5, Actual Values) for information on the display of data values under different device configurations. Values not configured for use are displayed as N/A.
209

Metering Tab
The SR750/760 Metering screen shows:
???Current
???Energy
???Voltage
???Power
The Clear Energy Data button will clear all values of energy data. The RESET Device button will issue a RESET command to the device.

Status Tab
The SR750/760 Status screen shows Active Conditions.
Fault Tab
The SR750/760 Fault & Maintenance Data screen shows:
211
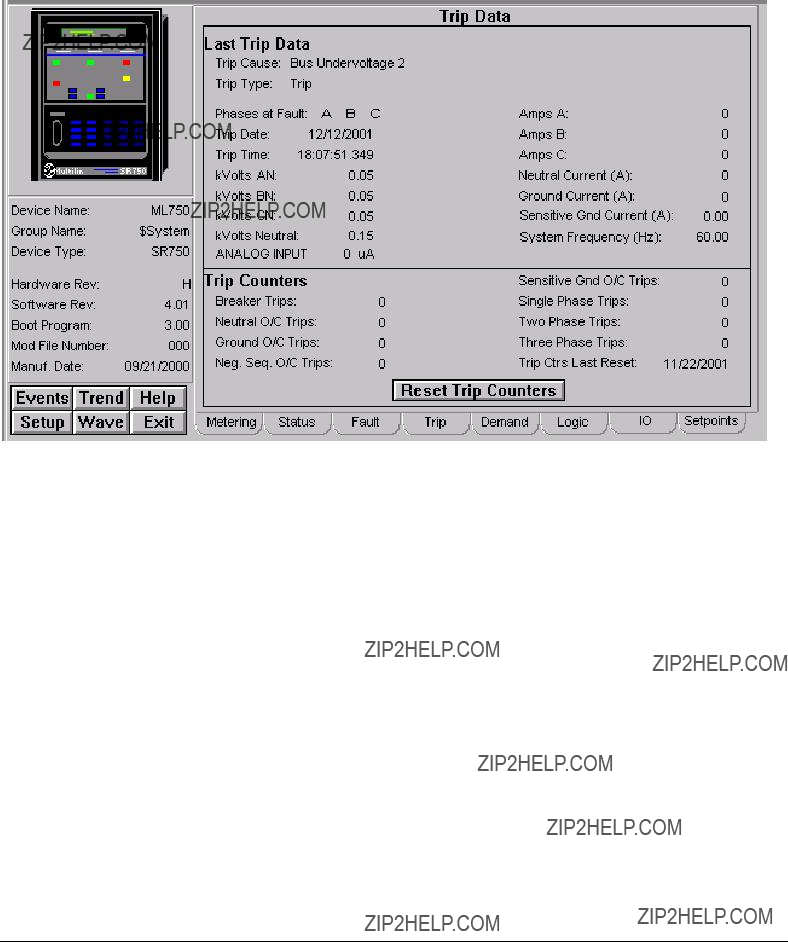
???Fault Locations
???Total Arcing Current
The Reset Arcing Current button will reset all values of the arcing current.
Trip Tab
The SR750/760 Trip Data screen shows:
???Last Trip Data
???Trip Counters
The Reset Trip Counters button will reset all values of the trip counters.
Demand Tab
The SR750/760 Demand screen shows details of:
???Configuration
???Values
The Reset Max Demand button will reset all maximum values of demand.
213

Logic Tab
The SR750/760 Logic screen shows:
???Contact Inputs
???Virtual Inputs
???Logic Input States
IO Tab
The SR750/760 Inputs & Outputs screen shows:

???Output Relays
???Analog Input
???Hardware Input Coils
???Breaker Operation
The Open Breaker button will issue an Open Breaker command. The Close Breaker button will issue a Close Breaker command.
Setpoints Tab
The SR750/760 System Setpoints screen shows:
???System Setup
???Analog Output Configuration
215

Fanuc 90/30
The Fanuc 90/30 Tabular Data Screen wizard is blank. This allows any desired data to be placed on the screen.
Fanuc 90/70
The Fanuc 90/70 Tabular Data Screen wizard is blank. This allows any desired data to be placed on the screen.

Fanuc Micro 90
The GE Fanuc Micro 90 Tabular Data Screen is blank. This allows for any desired data to be placed on the screen.
217

MX200
The MX 200 device is an Automatic Transfer Switch. The Tabular Data Screen wizard has several special features. You can use the Setup screen to change the meter configuration. Values displayed in white boxes are changeable. Clicking on the displayed value changes some, while clicking on the box changes others. The Download and Refresh buttons on the setup screen upload and download all of the setpoints from the device.
To change setpoints at the device, first press the refresh button to upload current setpoint values from the device (otherwise the defaults are shown and used for download). Modify setpoints as desired then press the download button to send all setpoints to the unit. In the following pages, each of the MX 200 Meter???s Tabular Data Screen Wizards??? tabs will be displayed and detailed.
Metering Tab
The Metering tab displays the following metered values from the MX 200 device.

Voltages
Normal and Emergency Voltage values for all the phases.
Timer Functions
???Timer Active
???Timer Countdown Value
???Time on Emergency
???No. of Transfers
???Nominal FS Vol. Value
???ATS Mode
???Fault Present
???Exerciser Enabled
???Load Test Running
???Load, No Load, Fast Load Status
Communications
???
Displays communication status, for example, Comm OK
Status
???Q3 Input
???Auxiliary 2 Input
???Auxiliary 1 Input
???Automatic Transfer Relay
???SN Limit Switch
???SE Limit Switch
???SNO Limit Switch
???SEO Limit Switch
???S5 Selector
???S12 Selector
???Load Shed Input
???Q7 Input
The status is either ON or OFF. If the relay is ON, the status is displayed in green and if relay is OFF, it is displayed in red.
Others
219

The tab shows frequency and number of phases on source:
???Position Status
???Phase Rotation
The status for Source is displayed as Available (displayed in green) or Not Available (displayed in red). The Position Status is displayed as Normal (displayed in green) or Emergency (displayed in red). The Phase Rotation is displayed as ON (displayed in green) or OFF (displayed in red).
Setup Tab
The Setup tab displays the following demand values from MX 200 device.

Control
???YE
???YN
???No Load Test
???Load Test
???Fast Load Test
???S5
???S12
???LS
???Q7
???Q3
???Aux2
???Aux1
The legend is ON and OFF. If ON, it is indicated by amber and if OFF by gray color.
Options
???T3 Timer Bypass
???T3 Timer
???W3 Timer Bypass
???W3 Timer
???T Timer Bypass
???W Timer Bypass
???In Ph. Mon/Closed Trans
???ATS Type
???S12 Auto/Manual
???S5 Auto/Manual Bypass
???Phase Sequence Check
???Emg Over Frequency
???Emg Over Voltage
???Normal Over Frequency
???Normal Under Frequency
???Normal Over Voltage
The value against each option is displayed as either as Confirmed or Not Confirmed.
Voltage (Volts)
221

???Normal Pickup
???Normal Dropout
???Emer Pickup
???Emer Dropout
The user can enter values against each parameter.
Frequency (Hz)
???Normal Pickup
???Emer Pickup
The user can enter values against each parameter.
Time (Seconds)
???P Time
???W Time
???W3 Time
???DW Time
???T Time
???T3 Time
???DT Time
???U Time
The Setup tab also provides push buttons for performing the following commands:
Download ??? Executes a script to check for values that have changed and downloads those values to the device Refresh ??? Executes a script to upload all of the meter values for the settings on the screen.
Note: Be sure to click the Refresh button prior to changing or downloading any settings to the MX 200, as the latest settings may not be displayed.
GEN PLC
The Generator Programmable Logic Controller (PLC) is a specially programmed PLC with specific number of I/O modules, controlled by a Master PLC program up to maximum number of 16 Generators.
GEN PLC Tabular wizard mainly have 3 tabs as described below.
Master Tab
The Master PLC lists 16 generators displaying status for each generator separately. The status types are:
???Run/Stop
???Alarm
???Shutdown
???Runtime (in hours)
???Lead Value
If a particular generator is stopped, it is displayed in gray color; if a generator is running, in green; if there is an alarm, in amber; and shutdown of a generator in red.
The parameters of generators are:
???Engine Crank Time (In seconds)
???No. of Cranks
???Cool Down Time (In seconds)
223

Generator Tab
This tab displays generator parameters for 16 generators represented as G1 to G16 (buttons). When a button is clicked, the parameters of that generator are displayed on the screen. The parameters are:
Status
???Gen Brkr Aux Contact
???Breaker Close Ready
???Not in Auto
???CPU Running
???Engine in Cooldown
???Engine Run Contact
If a generator is running, the status is displayed in gray and if it is Status Stop, it is displayed as green. The status Not In Auto is displayed in red.
Alarm
???Undervoltage
???Hi Water Temp Warn
???Battery Charger Failure
???Low Fuel Day Tank
???Oil Pressure Warning
???Low Water Temp
???Low Water Level
???Day Tank Critically ??? Low Fuel Level
???Day Tank Hi Fuel Level
???Day Tank Fuel Leak
???Summary Alarm
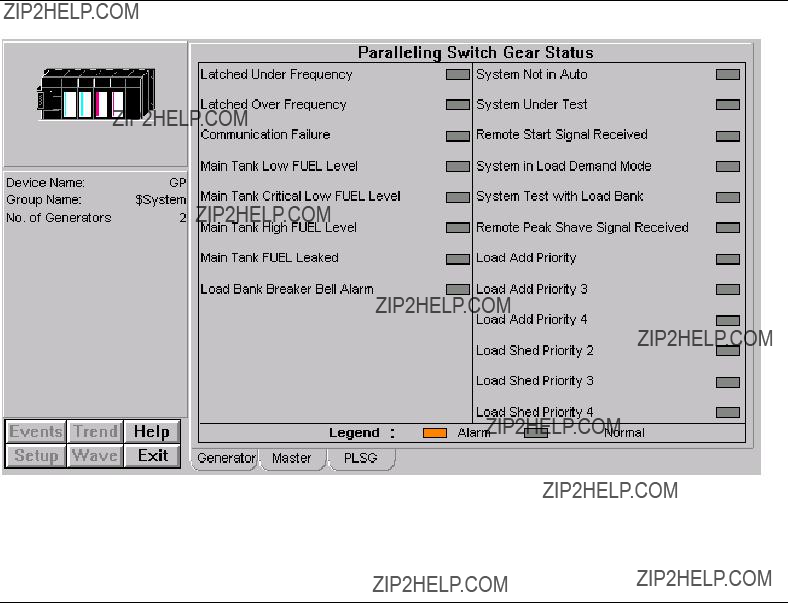
Any alarm in generator???s status is displayed in amber. Otherwise the status is displayed in gray.
Shutdown
???Overcrank
???Overspeed
???High Water Temp
???Oil Pressure
???Overvoltage
???Reverse Power
???Breaker Locked Out
???Fail to Synchronize
???General Failure
???Emergency Stop
???EMCP Diagnostic Failure
???Gen Set Breaker
???Air Damper Switch
???Lock Out 489 Relay
???Fail Safe 489 Relay
Note: Any kind of shutdown is displayed in red.
PSG
The screen shows Paralleling SwitchGear Status of generators.
225

Status
???Latched Under Frequency
???Latched Over Frequency
???Communication Failure
???Main Tank Low Fuel Level
???Main Tank Critical Low Fuel Level
???Main Tank High Fuel Level
???Main Tank Fuel Leaked
???Load Bank Breaker Bell Alarm
???System Not in Auto
???System Under Test
???Remote Start Signal Received
???System in Load Demand Mode
???System Test With Load Bank
???Remote Peak Shave Signal Received
???Load Add Priority
???Load Add Priority 3
???Load Add Priority 4
???Load Shed Priority 2
???Load Shed Priority 3
???Load Shed Priority 4
Note: Any alarm is displayed in amber, otherwise normal status is shown in gray color.

EPM5300P
This device belongs to Electro Industries family, which is tightly integrated device in to PMCS product. This device contains the following tabs.
Metering Tab
The screen explains various parameters of the device:
Current (Amps)
???Phase (A, B, C and Neutral)
???Inst
???Max
227

Voltage (Volts)
???Phase (AN, BN, CN, AB, BC and CA)
???Inst
???THD Current
???THD Voltage
Energy
???WATT Hour
???VA Hour
???VAR Hour
Power
???Real (WATT)
???Reactive (VAR)
???Apparent (VA)
???PF

Setup One Tab
The screen explains various parameters in relation with Relay 1 and Relay 2 such as:
Configuration
???Kilo Volt Inputs
???Kilo Amp Input
???Mega Watt Input
???Phase Reverse Limits
???Meter Setup
???Limits Set By
Relay 1 / Relay 2
???Phase Reversal
???Phase Imbalance
???Delay On
???Delay Off
Decimal Placement
???Volts Decimal Placement
???Amps Decimal Placement
???WATT Decimal Placement
???VOLTS Full Scale
???AMPS Full Scale
???Lim. Threshold for lmb (%)
229
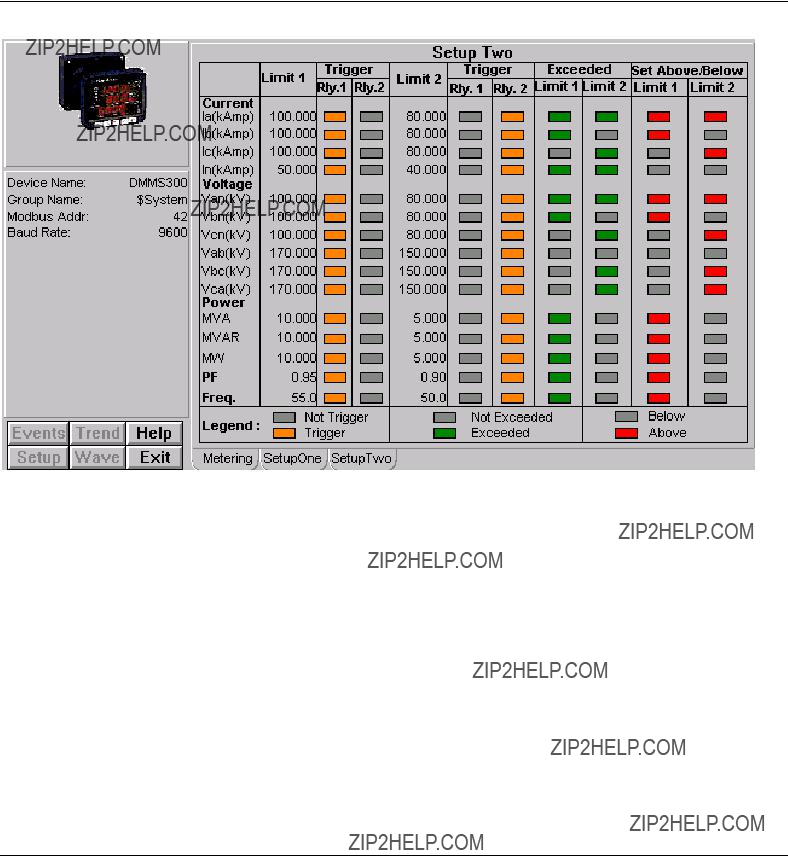
Reset
???WATT Hour
???VAR Hour
???VA Hour
If it is kilo volt inputs, the decimal placement is 2 (as shown in the screen); if kilo amp input the decimal placement is 3 and if mega watt input, it is 1.
Note: Configured is displayed in green, Enabled in red and Reset in Amber.
Setup Two Tab
The screen explains various parameters related to Limits and Triggers:
Brief explanation of each of the columns is described below

Current
???Phase A
???Phase B
???Phase C
???Neutral
Voltage
???AN
???BN
???CN
???AB
???BC
???CA
Power
???VA
???VAR
???WATT
???PF
???Frequency
231

EPM5200P
This device belongs to Electro Industries family, which is tightly integrated device in to PMCS product. This device contains the following tabs.
Metering Tab
The screen explains various parameters of the device:
Current (Amps)
???Phase (A, B, C, Neutral)
???Inst
???Max
Voltage (Volts)
???Phase (AN, BN, CN, AB, BC, CA)
???Inst
THD Current/THD Voltage
???Displays Phase A, Phase B and Phase C THD Current and Voltage values.
Energy
???WATT Hour
???VA Hour
???VAR Hour
Power
???Real (WATT)
???Reactive (VAR)
???Apparent (VA)
???PF
Setup One Tab
The screen explains various parameters in relation with Relay 1 and Relay 2 such as:
233

Configuration
???Kilo Volt Inputs
???Kilo Amp Input
???Mega Watt Input
???Phase Reverse Limits
???Meter Setup
???Limits Set By
Relay 1 / Relay 2
???Phase Reversal
???Phase Imbalance
???Delay On
???Delay Off
Decimal Placement
???Volts Decimal Placement
This value decides the precision. User can change the values from 1 to 4.
???Amps Decimal Placement
This value decides the precision. User can change the values from 1 to 4.
???WATT Decimal Placement
???VOLTS Full Scale
If kilo volt inputs value is set then Voltage
??? AMPS Full Scale
If kilo Amp inputs value is set then Amps
Reset
???WATT Hour
???VAR Hour
???VA Hour
Note: Configured is displayed in green, Enabled in red and Reset in Amber.

EPM5350P
Special Note: This device supports GE32MTCP Server ONLY.
This device belongs to Electro Industries family, which is tightly integrated device in to PMCS product. This device contains the following tabs.
Metering Tab
The screen explains various parameters of the device:
Current (Amps)
???Phase (A, B, C and Neutral)
???Inst
???Max
Voltage (Volts)
???Phase (AN, BN, CN, AB, BC and CA)
???Inst
235
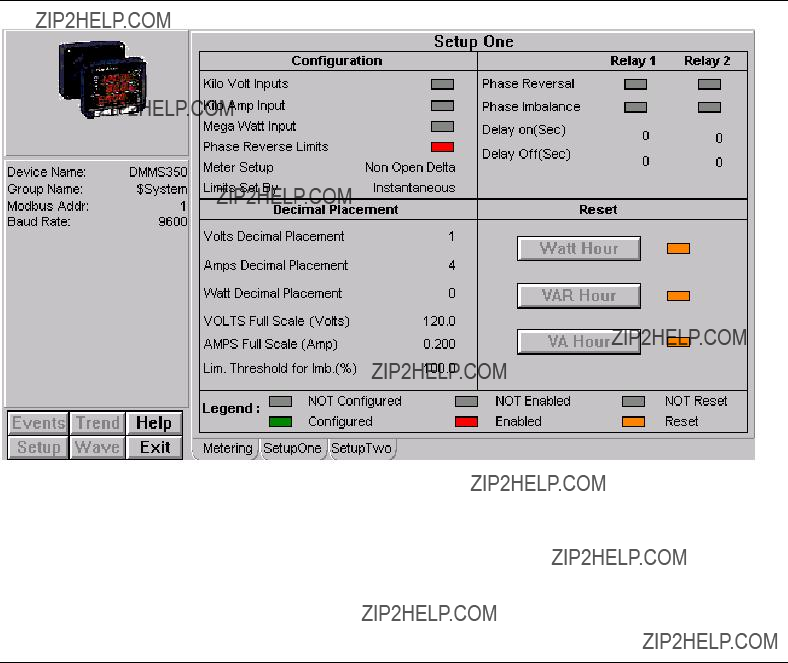
???THD Current
???THD Voltage
Energy
???WATT Hour
???VA Hour
???VAR Hour
Power
???Real (WATT)
???Reactive (VAR)
???Apparent (VA)
???PF
Setup One Tab
The screen explains various parameters in relation with Relay 1 and Relay 2 such as:
Configuration
???Kilo Volt Inputs
???Kilo Amp Input
???Mega Watt Input
???Phase Reverse Limits

???Meter Setup
???Limits Set By
Relay 1 / Relay 2
???Phase Reversal
???Phase Imbalance
???Delay On
???Delay Off
Decimal Placement
???Volts Decimal Placement
???Amps Decimal Placement
???WATT Decimal Placement
???VOLTS Full Scale
???AMPS Full Scale
???Lim. Threshold for lmb (%)
Reset
???WATT Hour
???VAR Hour
???VA Hour
If it is kilo volt inputs, the decimal placement is 2 (as shown in the screen); if kilo amp input the decimal placement is 3 and if mega watt input, it is 1.
Note: Configured is displayed in green, Enabled in red and Reset in Amber.
Setup Two Tab
The screen explains various parameters related to Limits and Triggers:
Brief explanation of each of the columns is described below
237


EPM5000P
This device belongs to the Electro Industries family, which is a tightly integrated device in to the PMCS product. The device contains the following tabs:
Metering
The screen explains various parameters related to metering and status.
Power (WATT): Instantaneous, Average, Maximum and Negative Maximum.
Relay 1/Relay 2: Positive Limit 1, Negative Limit 1, Positive Limit 2 and Negative Limit 2. Delay On is displayed too. If the relay is on, it is displayed in green. If the relay is off, it remains in gray.
Energy (kWh): WATT Hour and Negative WATT Hour. Interval is displayed.
Power Full Scale: This value internally depends on the Power Displacement Value. Based on this the value the number of decimals will be displayed. For example
If the Power Decimal Placement is set to 1, the value will have only one decimal place.
If the Power Decimal Placement is set to 2, the value will have two decimal places, and so on and so forth. The maximum value allowed is 4.
239
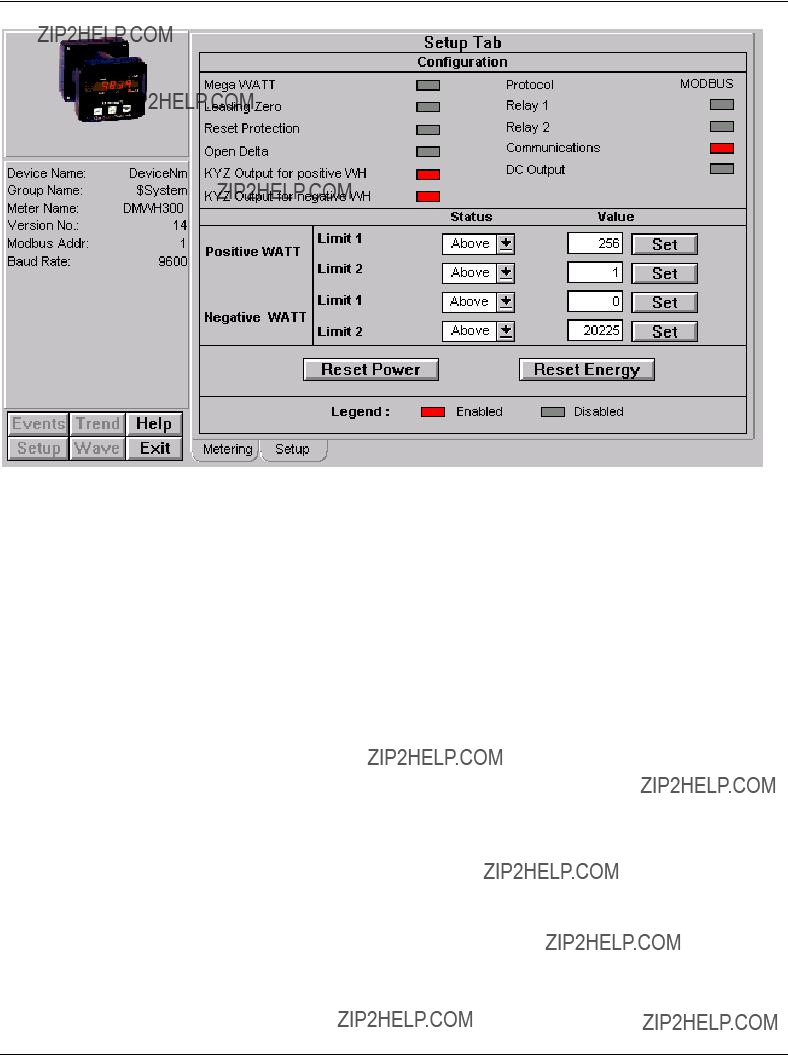
Setup
The screen explains various parameters related to configuration and setup.
Configuration: Mega WATT, Leading Zero, Reset Protection, Open Delta, KYZ Output for positive WH, KYZ Output for negative WH.
Protocol: Relay 1, Relay 2, Communications and DC Output.
Status/Value: The user can set the values in the Status and Value fields. Under Positive WATT and Negative WATT, the status is shown as Above/Below for Limit 1 and Limit 2. The user can directly set the status to the device by clicking on the arrow buttons on respective fields to change the value from Above to Below or from Below to Above. The user can enter the set values by clicking on the field that contains the rectangular box that filled with White color on respective fields by entering the desired set values. Once the user enters the set value, by clicking on the Set button of the respective field, will set the value in to the device. Against these settings the wizard will prompt user for the conformation.
Legend: The Legend is applicable for Configuration parameters. Enabled status is displayed in red, Otherwise the status is displayed in gray.

EPM9450Q/EPM9650Q
This device belongs to the Electro Industries family, which is a tightly integrated device in to the PMCS product.
The device comes with 2 versions ??? EPM9450Q and EPM9650Q. The EPM9450Q device does not support Waveform feature. The EPM9650Q supports Waveform features.
The device offers the following features:
???Max/Min integration: Offers Maximum and Minimum values for every measured reading.
???8
???Demand: Measures Fixed window, Sliding window, Predictive and Themal demands.
???4 Communication Ports: There are 4 ports ??? Port 1, Port 2, Port 3 and Port 4.
The device contains the following tabs:
Metering
The Metering tab shows following various parameters:
???Voltage Normal/ High Speed: This tab displays the voltage values of AN, BN, CN, AB, BC, CA and Aux.
???Current Normal/ High Speed: Displays currents of Phase A, B, C, measured and calculated.
???THD Normal/ High Speed: Displays THD values of Phase A, B, C for Voltage and Current an d K Factor.
???Power: Displays Phase A, B, C and 3 Phase Power Values for Real (Watt), Reactive (VAR), Apparent (VA) and
241
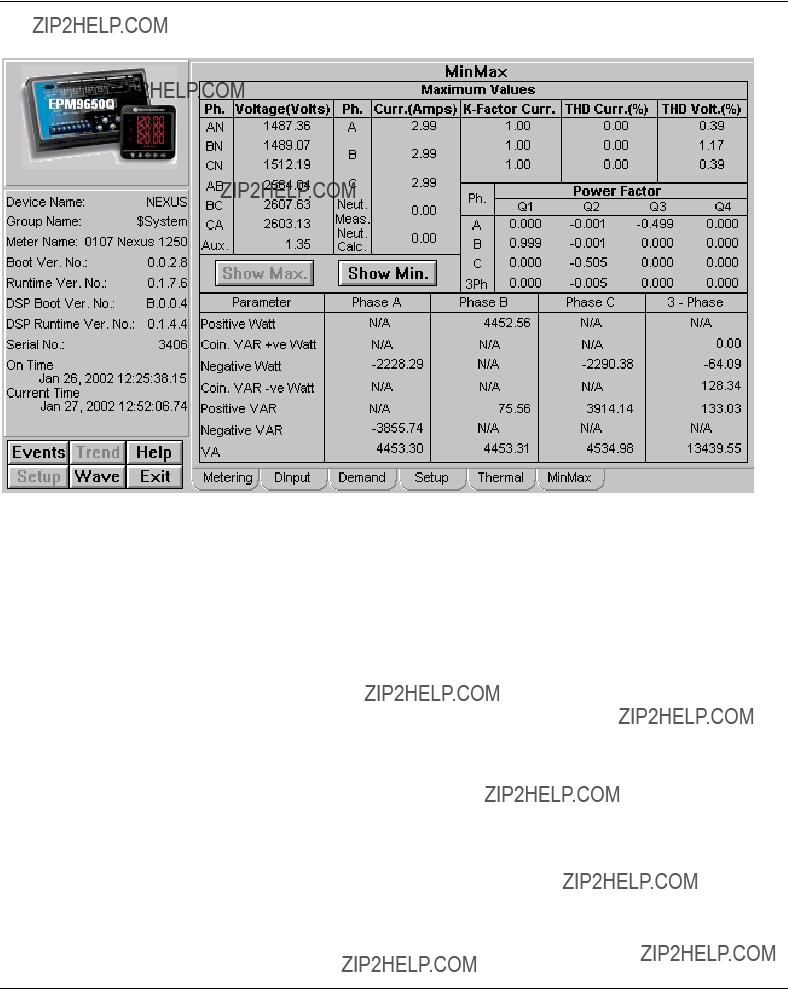
PF.
???Frequency Normal/ High Speed: Displays Frequency in Hz.
Min/Max
The tab displays Maximum and Minimum values of various parameters. The user can get maximum and minimum values by clicking on respective buttons labeled Show Max and Show Min.
???Voltage: This tab displays the voltage values of AN, BN, CN, AB, BC, CA and Aux.
???Current: Displays currents of Phase A, B, C, measured and calculated.
???THD : Displays THD values of Phase A, B, C for Voltage and Current an d K Factor.
???Power Factor : Displays PF of Phase A, B, C and 3 Phase of 4 Quadrants namely Q1, Q2, Q3 and Q4.
???Power: Displays Phase A, B, C and 3 Phase Power Values for Positive Watt, Coincendence VAR for Postive Watt, Negative Watt, Coincedance VAR for Negative Watt, Positive VAR, Negative VAR and VA.
Demand
The screen explains various parameters related to demand values:
???Sliding Window Demand: Displays Average and Maximum Sliding window demand for Positive Watt, Coincendence VAR for Maximum Postive Watt, Negative Watt, Coincedance VAR for Maximum Negative Watt, Positive VAR, Negative VAR and VA. User can click on Sliding Window button to see the Sliding window Demand.
???Fixed Window Demand: Displays Average and Maximum Sliding window demand for Positive Watt, Coincendence VAR for Maximum Postive Watt, Negative Watt, Coincedance VAR for Maximum Negative Watt, Positive VAR, Negative VAR and VA. User can click on Fixed Window button to see the Fixed window Demand.
???Predictive Sliding Window Demand: Displays Predictive Sliding Window demand for WATT, VAR and VA.
???Energy: Displays Energy values for the parameters namely Positve kWh, Negative kWh, Positve kVARh, Negative kVARh and kVAh.
243

Thermal Average
The screen explains about various parameters related to thermal average:
???Current (Amps): Displays the current readings for the phases A, B, C, Mea. (measured) and Cal. (calculated).
???Voltage (Volts): Displays the Voltage readings for the phases AN, BN, CN, AB, BC, CA and Aux.
???Power: Displays Phase A, B, C and 3 Phase Power Values for Real (Watt), Reactive (VAR) and Apparent (VA).

Digital Inputs
The Digital Inputs tab displays the following parameters of 8 digital inputs. They are Name: Displays the name of the Digital Input. The maximum allowed is 16 Character string.
Open/Close Label: Based on the Digital input status, the corresponding label will be displayed. For example if the digital input status is OPEN then label for Open condition is displayed or if the digital input status is CLOSED then label for Closed condition is displayed.
Status: The status is displayed Open/Closed. Open status showed in green and Closed status in gray.
Counter: Displays the corresponding digital input counter value.
245

Setup
The screen explains various parameters related to setup.
Current Set Points: Above and Below Current Setpoints are shown for Phase A, B, C, Measured and Calculated.
Voltage Set Points: Above and Below Voltage Setpoints are shown AN, BN, CN, AB, BC, CA and Aux.
PT Ratio: Displays Phase and Auxiliary values for Numerator and Denominator.
CT Ratio: Displays Phase and Neutral values for Numerator and Denominator.
Communication Parameters: Displays Port Addresses and Baudrate for each of the 4 Ports.
Reset: This wizard allows user to reset the following Parameters.
???Energy
???Log
???Maximum and
???Minimum
Voltage Phase Sequence: Displays Phase sequence as either

EPM7430D/EPM7450D
These devices belong to the Electro Industries family, which is a tightly integrated device in to the PMCS product. These devices communicate through EI Protocol (Electro Industries Protocol). The server used for these devices is
GE32EIND.
The device comes with 2 versions ??? EPM7430D and EPM7450D. Both the devices does not support Waveform and events features. So these two buttons will be disabled.
Metering
The Metering tab shows following various parameters:
???Voltage: This tab displays the voltage values of AN, BN, CN, AB, BC and CA.
???Current: Displays currents of Phase A, B, C and neutral.
???THD Current/THD Voltage: Displays THD values of Phase A, B and C for current and voltage.
???Energy: Displays values for Positive kWh, Negative kWh, Positive kVARh, Negative kVARh and kVAh,.
???Power: Displays Phase A, B, C and 3 Phase Power Values for Real (kW), Reactive (kVAR), Apparent (kVA) and PF.
The wizard also displays the parameters Frequency (Hz), Phase Imbalance (%) and Phase Reversal. If Phase Reversal is ON, the wizard shows CBA, if not then shows ABC.
247

Min/Max
The tab displays Maximum and Minimum values of various parameters. The user can get maximum and minimum values by clicking on respective buttons labeled Show Max. Values and Show Min. Values.
???Voltage: This tab displays the voltage values of AN, BN, CN, AB, BC and CA.
???Current: Displays currents of Phase A, B, C and Neutral.
???THD : Displays THD values of Phase A, B, C for Current and Voltage.
???Power: Displays Phase A, B, C and 3 Phase Power Values for Positive kW, Negative kW, Positive kVAR, Negative kVAR, kVA, Positive PF and Negative PF.
???Frequency: Displays frequency in Hz.

Limits
The screen explains various parameters related to Limits and Triggers:
Limit 1 Trigger/Limit 2 Trigger (Relay 1, Relay 2 and Relay 3)
Relay 1, Relay 2 and Relay 3 are triggered depending upon the Limit 1 and Limit 2 values. The screen also displays whether the Limit 1 and Limit 2 are set above or set below.
Relay 1, Relay 2 and Relay 3 of Limit 1 and Limit 2 are displayed either as Not Triggered or Triggered. If the relay is triggered, the LED fills with amber, if not then gray.
If Limit 1 or Limit 2 are set above, then the status is displayed in red, if not gray, meaning the Limits are set below, The Limit 1 and Limit 2 Parameters that are shown on the tab are
Current: Phase A, Phase B, Phase C and Neutral.
Voltage: AN, BN, CN, AB, BC, CA
Power: VA, VAR, WATT, PF and Frequency
Brief explanation of each of the columns is described below
249


Setup
The screen shows the following parameters in relation with Relay 1, Relay 2 and Relay 3 such as:
Configuration: The Parameters under configuration are Kilo Volt Inputs, Kilo Amp Input, Mega Watt Input, Phase Reverse Limits. If any of the above parameters are configured the LED shows Green otherwise LED shows Gray in color. Meter Setup: If this parameter is set then text displayed as Open Delta, if not then shows Non Open Delta.
Limits Set By: If this parameter is set then text displayed as Average, if not then shows Instantaneous.
Relay 1 / Relay 2/ Relay 3: This section shows the parameters Phase Imbalance, Delay On and Delay Off of Realy 1, Relay 2 and Relay 3.
The Legend applicable Phase Imbalance is if any of the above parameters are Enabled the LED shows RED otherwise LED shows Gray in color.
Full Scale Values: Displays Full Scale Voltage values for phases AN, B and CN; and Full Scale current values for phases A, B and C. Also shows Decimal Placement values of Volts, Amps and Power.
Reset of Min and Max: Resets Minimum and Maximum values. For example:
To reset Minimum values, when the button is clicked, a dialog box will appear asking ???Reset minimum values????. The dialog box contains Ok and Cancel buttons. If the Ok button is clicked, all the minimum values of parameters are reset. If the Cancel button is clicked, no Reset will occur.
Reset of WATT Hour, VAR Hour and VA Hour:
In resetting the above parameters 2 dialog boxes will prompt user to implement the functionality.
For example:
Dialog box 1: To reset Watt Hour, when the button is clicked, a dialog box will appear asking ???Do you want to reset Watt Hour????. The dialog box contains Ok and Cancel buttons. If the Ok button is clicked, then another dialog box prompts the user. If Cancel button is clicked the Dialog box 2 will not appear and no Reset will occur.
Dialog box 2: Asking ???Confirm the reset within 10 seconds???. If the Ok button is clicked the parameter is reset. If Cancel button is clicked no Reset will occur.
251

Troubleshooting
Assertion Error
Q: While switching between InTouch's Runtime and Development modes, the program crashed with an Assertion Error.
A: This is a problem with InTouch Wonderware, not the GE PMCS Wizards. It occurs rarely during the development phase, and is not seen once a stable application has been developed and put into use. Reboot the computer and restart the application.
EPM 3710/EPM 3720 ??? no data or incorrect data displayed
Q: The values on the EPM 3710/3720 wizards come up showing zeros or incorrect data.
A: The EPM 3710/3720 wizards require you to click the Refresh button on the wizard before the display is updated. Also, the first time the wizard is displayed, it may take a few moments for the DDE conversation to be established and data to be displayed.
EPM 3720 ??? KVAH import values incorrect
Q: On the EPM 3720 Tabular data screen, the KVAH import value does not equal the value of KVAH total or KVAH net when KVAH export equals zero.
A: Some rapidly changing values and/or values requiring extensive calculations cannot be updated on the wizards quickly enough to reflect the data displayed on the device in real time. Be patient while the software catches up with the device.
Long update when changing setpoints
Q: I attempted to change a device setpoint (such as changing the VT connection type from WYE to DELTA). It took a long time to update the Wizards setpoint tab to reflect the changes.
A: When changing setpoints, which are polled very slowly, the display may take a long time (a minute or more) to update. This means the metering data will be postponed while the display updates. Setpoint changes are a relatively rare change to make - please be patient during the delay.
PLEPM ??? Wrong Metering tab displayed
Q: When I
A: Click another tab and then click back to the Metering tab. The correct configuration will now be displayed.
InTouch applications ??? Windows not displayed properly
Q: When an InTouch application containing PMCS Wizards has its resolution changed, the fonts in the wizard are not sized correctly. For instance, if I develop an application in 600 x 480 resolution and then convert it to 800 x 600 resolution, the screens look terrible, things extend off the screen, text formatting is changed, etc.
A: First, make sure that the TrueType fonts option is turned on in Windows 2000 SP2. If this option is off, it can cause font display problems even if windows have not been resized. Next, any time you change the resolution of an InTouch application containing PMCS Wizards, you'll need to delete the wizards from any converted Windows, and then add the wizards back in. When you add the wizard back in, it will display correctly.
253

Appendix A:
EPM 3720 Sliding Window
Demand Keys
Downloading Sliding Demand Window Keys to the EPM 3720
The EPM 3720 supports up to 10 sliding demand measurements that are user- programmable via the Tabular Data screen wizard. The Sliding Demand tab offers a set of adjustable fields, into which a user can enter a key (a unique string of values) which, when downloaded to the EPM 3720, will trigger a measurement.
For explanations of what the EPM 3720's various parameters mean, refer to the EPM 3720 Users Guide, in the section titled Sliding Window Demand.
To set the EPM 3720's sliding demand keys, follow the procedure below: Locate the key code for the parameter you wish to measure in the table below.
1.Open the EPM 3720 Tabular Data screen wizard and select the Sliding Demand tab.
2.Enter the appropriate sliding demand window key by clicking the on- screen thumbwheels up or down until the key code from the table below is displayed.
3.Press the Download button to send the key to the device.
4.Allow several seconds for transmission time, then press the Refresh button to verify that the device has accepted the setup parameter. The values displayed should be those downloaded. When it receives the downloaded key, the meter will perform a sliding demand measurement for the parameter selected by the key.
255


257


259


Table
261

(This page left blank intentionally.)
Appendix B:
Automatic Waveform Capture and Waveform Retrieval on EPM3720
Using a setpoint to trigger waveform capture or record on the EPM 3720
When a Setpoint is programmed from the MMI, the EPM3720 has the ability to automatically capture or record waveforms based on the value of a specified parameter. In order to display a Waveform Capture, the meter takes 128 samples from a full cycle of any single selected channel. For a Waveform Record, the meter takes 16 samples per cycle from multiple cycles on all 8 inputs simultaneously. The device will store 36 cycles of 1 event, 18 cycles of 2 events, or 12 cycles of 3 events, depending on the Record Depth programmed by the user. Please follow the instructions below to use a Setpoint to trigger a waveform capture or record on the EPM3720.
For explanations of what the EPM 3720's various parameters mean, refer to the EPM 3720 Users Guide, in the section titled Sliding Window Demand.
1.In the EPM3720 MMI tabular screen, click on the Setpoints tab.
2.Choose an unassigned setpoint number. Either Standard or High Speed may be used, but High Speed is recommended for quicker response. (See Section 6 of the 3720 ACM Installation & Operation Manual for more details on configuring Setpoints.)
3.Based on the parameter that will be set in the Trigger Key, select the Setpoint Type.
4.Set the Trigger Key. The Trigger Key is a code for the parameter that, when its value passes a set limit, triggers an Action. Refer to the table in this section for a list of Trigger Key codes.
5.Enter the High and Low Limits as well as any Time Delays to operate and release.
6.Select the required Action. To record a waveform, choose Waveform Recorder. For Waveform Capture, remember that the waveform of only one input may be automatically captured. Choose Waveform
263

Capture Channel X where X represents an integer between 1 and 8. Following are the Channel assignments for Wye and Delta systems.
7.Press the Download key. This will transmit the values entered into the Setpoints tabular screen for the selected setpoint number to the device. After several seconds press the Refresh button and scroll to the selected setpoint to verify that the device has accepted the setpoint entered parameters.
8.For waveform record, open the Waveform Capture program from within the MMI. On the main screen, select the appropriate Topic or device name and click on the Record radio button. Then, under the menu Waveform>Configure>Record Depth, select a depth of either 1 event x 36 cycles, 2 events x 18 cycles, or 3 events x 12 cycles. Press OK. The Trigger, Arm, and Retrieve buttons will become inactive as the depth is downloaded to the meter. For waveform capture proceed directly to step 9.
9.Once the Trigger, Arm, & Retrieve buttons become active, press the Arm button. The Trigger, Arm, & Retrieve buttons will momentarily become inactive. When the buttons become active, the meter is now ready to record/capture a waveform when the setpoint conditions are reached.
10.Once the waveform has been automatically captured or recorded and the event has been logged, choose the appropriate Topic and function; i.e., in the main screen of the Waveform Capture program, press
Retrieve.
11.View and save waveforms as desired.
12.To rearm the meter and clear the waveform data out of the device???s memory, press Arm on the main screen of the Waveform Capture program.

265


267


269


271

273


275

Table

Action keys marked with STD are supported by Standard Setpoints
277

(This page left blank intentionally.)

Appendix C: EPM 7700 - Special
Considerations
EPM 7700 Tags Subject to Deactivation by Tabular Data Screen Wizard
This appendix lists the EPM 7700 tags which may be activated or deactivated by the EPM 7700 Tabular Data Screen wizard. This information is of use for developers creating their own wizards to access the EPM 7700???s data. If you wish to use a tag in a custom wizard you are developing, check this table to see if it is subject to deactivation by the Tabular Data Screen wizard. If it is, you may wish to create a duplicate tag with a unique name to access the same register. Otherwise, it is possible that the tag may be deactivated by the Tabular Data Screen wizard, and the data will be unavailable for use by your custom wizard.
NOTE: It is important to keep in mind that tags which may be deactivated by the Tabular Data Screen Wizard will not work properly with InTouch???s trending features.
NOTE: _Anlg or _Msg indicate Internal Tags for display use; _GWY indicates I/O
Tags which talk to GE77GTWY. All others tags talk to ION_LINK
279


281

283


285


287


289


291

Index
2
239 Motor Protection Relay, 171
269 Plus Motor Management Relay, 87, 88, 175
3
369 Motor Management Relay, 176
5
565 Feeder Management Relay, 92, 198
7
735 Feeder Relay, 200
9
90/30, 216 90/70, 216
A
alarm, 88, 95
Annunciator Panel wizard, 25
C
Custom Table wizard, 35
E
Elevation views, 1, 6, 22, 23, 55, 56
Elevation Views, 55
Elevation wizards, 5, 22, 55
EPM 3710 Meter, 80, 120
EPM 3720 Meter, 82, 121
EPM 7300 Meter, 84, 122, 126
EPM 7500 Meter, 130
EPM 7700 Meter, 140
event, 96, 99
F
Fanuc, 216, 217
Floor Plan wizards, 5, 23
Floor Plans, 55, 57
I
Interface Toolkit, 1, 3, 5
L
Large Faceplate Wizards, 8
Lockout/Tagout wizard, 42
M
MDP Digital Overcurrent Relay, 107
Micro 90, 217
MMII (Motor Manager II), 119
P
PMCS Interface Toolkit, 1
POWER LEADER EPM, 68, 101
POWER LEADER Meter, 76, 105
S
Sample Application, 61 Small Faceplate Wizards, 6 Spectra ECM, 78, 106 Spectra MVT trip unit, 71, 102
SR469 Motor Management Relay, 184 SR489 Generator Management Relay, 192 SR745 Transformer Management Relay, 203 SR750 Feeder Management Relay, 209 System Statistics wizard, 40
293
T
Tabular Data Screen Wizards, 11, 99 Toolbar wizard, 24
U
Universal Relay, 150
Universal Relay Devices, 150
UR, 150
W
waveform capture, 99

(This page left blank intentionally.)
295

GE Industrial Systems
General Electric Company
41 Woodford Ave., Plainville, CT 06062